Statistics > EXAM > STATISTICS 620 - Test statistic (All)
STATISTICS 620 - Test statistic
Document Content and Description Below
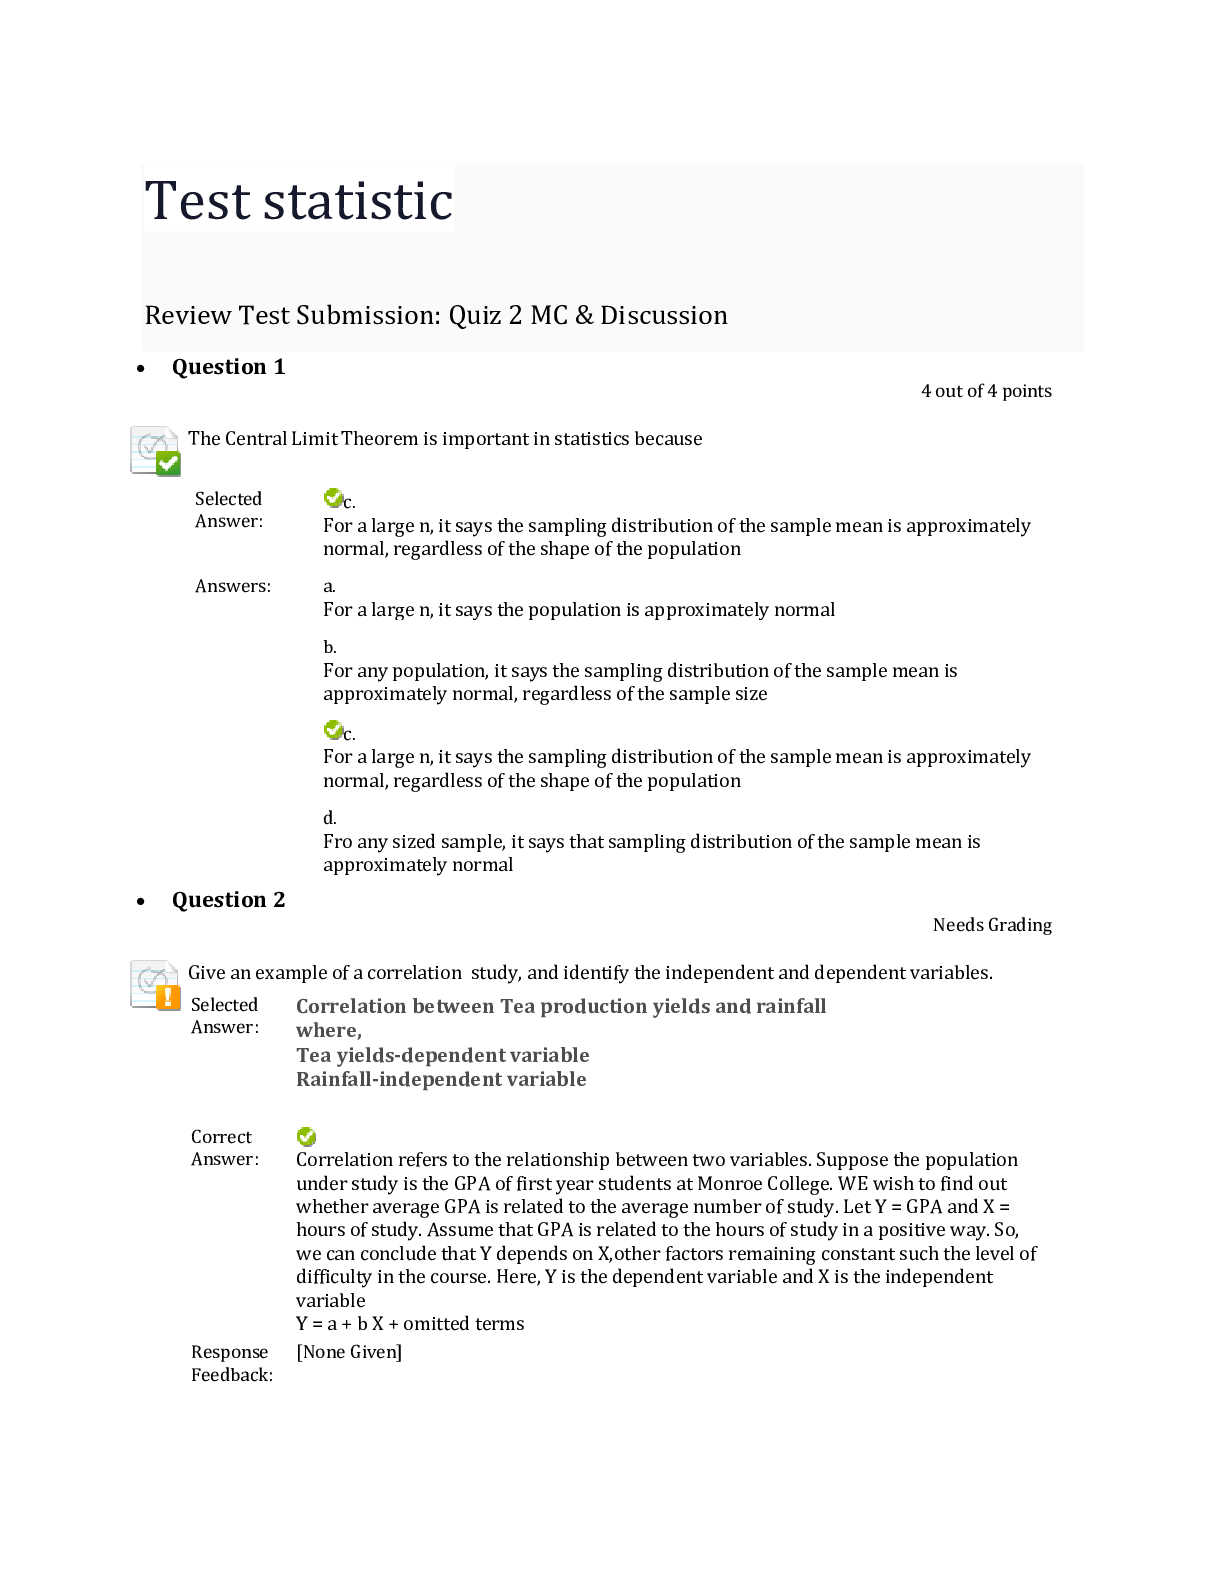
Test statistic Review Test Submission: Quiz 2 MC & Discussion • Question 1 4 out of 4 points The Central Limit Theorem is important in statistics because • Question 2 Needs... Grading Give an example of a correlation study, and identify the independent and dependent variables. • Question 3 4 out of 4 points A probability distribution is an equation that Response Feedback: associates a particular probability of occurrence with each outcome. • Question 4 4 out of 4 points Which of th efollowing is TRUE about the sampling distribution of the sample mean • Question 5 Needs Grading What is the diagram of the independent and dependent variables called? Why is the drawing of this diagram important? • Question 6 4 out of 4 points All the events in the sample space that are not part of the specified event are called Response Feedback: The complement of an event • Question 7 Needs Grading What is meant by the statement that two variables are related? Explain • Question 8 Needs Grading Major league baseball salaries averages $3.26 million with a standard deviation of $1.2 million in a certain year in the past. Suppose a sample of 100 major league players was taken . Find the approximate probability that the mean salary of the 100 players was no more than $3.0 million. SHOW your work: a) Approximately 0 b) 0.0151 c) 0.9849 d) Approximately 1 • Question 9 0 out of 4 points If we know that the length of time it takes a college student to find a parking spot in the library parking lot follows a normal distribution with a mean of 3.5 minutes and a standard deviation of 1 minute, find the probability that a randomly selected college student will take between 2 and 4.5 minutes to find a parking spot in the library parking lot. HINT: For this question, work out the problem first by: Draw the normal distribution, identify the mean and standard deviation; identify the area under the curve to be solved, covert the value of X into Z, and then look up the normal table to find the desired answer • Question 10 4 out of 4 points The standard error of the mean • Question 11 0 out of 4 points If a particular set of data is approximately normally distributed, we would find that approximately • Question 12 4 out of 4 points If event A and event B cannot occur at the same time, then events A and B are said to be • Question 13 4 out of 4 points Simple probability is also called • Question 14 Needs Grading a) What is the Central Limit Theorem? It is always true that as the sample size, n, increases, the distribution of the sample means will be approximately normally distributed. Explain b) If the underlying population of study is not normally distributed, how large should the sample size be? What if the population is normally distributed ? • Question 15 4 out of 4 points For some value of Z, the value of the cumulative standardized normal distribution is 0.8340. The value of Z is Response Feedback: 0.97. • Question 16 Needs Grading How do you find the area between two values under the normal curve? Explain • Question 17 4 out of 4 points If the outcome of event A is not affected by event B, then events A and B are said to be Response Feedback: Statistically independent • Question 18 Needs Grading What is the difference between mutually exclusive events and collectively exhaustive events? Explain and offer examples • Question 19 Needs Grading When two variables are correlated, can the researcher be sure that one variable causes the other? Why or why not? Hint: Causation vs. Correlation • Question 20 Needs Grading What is the difference between a simple event and a joint event? Expalin and give example(s) • Question 21 Needs Grading a) What are some of the distinguishing properties of a normal Distribution? Discuss b) The sampling distribution of the sample means is the curve that describes how the sample means are distributed. True or False Explain c) The mean of sample means is the same as the popualtion for a given sample of size n. True False Explain • Question 22 4 out of 4 points The connotation "expected value" or "expected gain" from playing roulette at a casino means Response Feedback: the amount you expect to "gain" in the long run over many plays. • Question 23 4 out of 4 points Which of the following about the normal distribution is not true? Response Feedback: Theoretically, the mean, median, and mode are the same. • Question 24 0 out of 4 points Suppose a sample of n=50 items is selected from a population of manufactured products and the weight,X,of each item recorded. Prior experience has shown that the weight has a probability distribution with µ= 6 ounces and σ= 2.5 ounces. Suppose a sample of size 15 is selected, which of the following is TRUE? = • Question 25 4 out of 4 points For some positive value of Z, the probability that a standard normal variable is between 0 and Z is 0.3770. The value of Z is: Review Test Submission: Quiz 1 • Question 1 4 out of 4 points The smaller the spread of scores around the arithmentic mean, • Question 2 4 out of 4 points At a meeting of information systems for regional offices of a national company, a survey was taken to determine the number of employees the officers supervise in the operation of their departments, where X is the number of employees overseen by each information systems officer. X Frequency 1 7 2 5 3 11 4 8 5 9 Referring tot he Table above, across all of the regional offices, how many total employees were supervised by those surveyed? • Question 3 4 out of 4 points What graphs should be used to show the relationship between th eparts and the whole? • Question 4 4 out of 4 points A researcher divided subjects into groups according to gender and then selected members from each group for her samples. What sampling method was the researcher using? • Question 5 4 out of 4 points When data are categorized as, for example, places of residence (rural, suburban, urban), the most appropriate measure of central tendency is the • Question 6 4 out of 4 points What is the value of the mode when all values in the data set are different? • Question 7 0 out of 4 points Those methods involving the collection, presentation, and characterization of a set of data in order to properly describe the various features of that data set are called: • Question 8 Needs Grading List three reasons why samples are used in statisitics • Question 9 4 out of 4 points The number of ads on a one-hour television show is what type of data? • Question 10 0 out of 4 points The frequency distribution below represents the rents of 250 randomly selected federally subsidized apartments in Minneaplois. Rents in $ Frequency 300 but less than 400 113 400 but less than 500 85 500 but less than 600 32 600 but less than 700 16 700 but less than 800 4 The percentage of apartments renting for less than $600 iss---------------------------------- • Question 11 0 out of 4 points In a sample of size 20, the sample mean is 60. In this case, the sum of all observation in the sample is: • Question 12 0 out of 4 points The frequency distribution below represents the rents of 250 randomly selected federally subsidized apartments in Minneaplois. Rents in $ Frequency 300 but less than 400 113 400 but less than 500 85 500 but less than 600 32 600 but less than 700 16 700 but less than 800 4 The class mid-point for the second class is ----------------------- • Question 13 4 out of 4 points Researchers are concerned that the weight of the average American school child is increasing implying, among other things, that children's clothing should be manufactured and marketed in larger sizes. If X is the weight of school children sampled in a nationwide study, then X is an example of • Question 14 0 out of 4 points Rents in $ Frequency 300 but less than 400 113 400 but less than 500 85 500 but less than 600 32 600 but less than 700 16 700 but less than 800 4 The frequency distribution above represents the rents of 250 randomly selected federally selected subsidized apartments in Minneapolis. ------------------- apartments rented for at least $400 but less than $600 • Question 15 4 out of 4 points Stem Leaves 3 24 4 03478999 5 0112345 6 12566 7 01 8 9 2 A survey was conducted to determine how people rated the quality of programming available on television. Respondents were asked to rate the overall quality from 0 (no quality at all) to 100 (extremely good quality). The stem-and-leaf display of the data is shown above. What percentage of the respondents rated overall television quality with a rating of 80 or above? • Question 16 4 out of 4 points Most data analysts focus on the cost of tuition as the way to measure the cost of a college education. But incidentals, such as textbook costs, are rarely considered. A researcher at Drummand University wishes to estimate the textbook costs of firtst-year studetns at Drummand. To do so, she monitored the terxtbook cost of 250 first-year students and found that thier average textbook cost was $300 per semetest. Identify the sample in the study • Question 17 4 out of 4 points A statistics that tells the number of standard deviations a data value is above or below the mean is called • Question 18 4 out of 4 points Except for rounding errors, relative frequencies should add up to what sum? • Question 19 4 out of 4 points The summary measure that is computed to describe a characteristic from only a sample of the population is called • Question 20 Needs Grading 11 15 23 29 19 22 21 20 15 25 17 The data above represents the amount of grams of carbohydrates in a serving of breakfast cereal in a sample of 11 different servings: a) Compute the arithmetic mean: SHOW YOUR WORK! b) What is the first quartile? Interpret your results? Show all work • Question 21 4 out of 4 points Data that can be classified according to color are measured on what scale? • Question 22 4 out of 4 points When a distribution is bell-shaped, approximately what percentage of the data values will fall within 1 standard deviation of the mean? • Question 23 0 out of 4 points At a meeting of information systems for regional offices of a national company, a survey was taken to determine the number of employees the officers supervise in the operation of their departments, where X is the number of employees overseen by each information systems officer. Table X Frequency 1 7 2 5 3 11 4 8 5 9 Referring to the Table above, how many regional officers are represented in the survey results? • Question 24 4 out of 4 points Which of the arithmetic mean, median, and mode are resistant mesaures of central tendency? • Question 25 Needs Grading Complete these statements with the best answer: Matching Questions Answer Question Answer Key __ A measure obtained from sample data is called a a. Parameters __ Generally, Greek letters are used to represent b. Statistics __ Generally, Roman letters are used to represent c. Standard Deviation _ The positive square of the variance is called d. σ __ The symbol for the population standard deviation e. Statistics 1. A probability distribution is an equation that_______. 2. The connotation "expected value" or "expected gain" from playing roulette at a casino means _______. 3. Which of the following about the binomial distribution is not a true statement? 4. Whenever π=0.5, the binomial distribution will_______. 5. If n equals=10 and π=0.70, then the mean of the binomial distribution is _______. 6. What type of probability distribution will the consulting firm most likely employ to analyze the insurance claims in the following problem? An insurance company has called a consulting firm to determine if the company has an unusually high number of false insurance claims. It is known that the industry proportion for false claims is 3%. The consulting firm has decided to randomly and independently sample 100 of the company's insurance claims. They believe the number of these 100 that are false will yield the information the company desires. 7. What type of probability distribution will most likely be used to analyze warranty repair needs on new cars in the following problem? The service manager for a new automobile dealership reviewed dealership records of the past 20 sales of new cars to determine the number of warranty repairs he will be called on to perform in the next 90 days. Corporate reports indicate that the probability any one of their new cars needs a warranty repair in the first 90 days is 0.05. The manager assumes that calls for warranty repair are independent of one another and is interested in predicting the number of warranty repairs he will be called on to perform in the next 90 days for this batch of 20 new cars sold. 8. A company has 125 personal computers. The probability that any one of them will require repair on a given day is 0.025. To find the probability that exactly 20 of the computers will require repair on a given day, one will use what type of probability distribution? 9. If the outcomes of a variable follow a Poisson distribution, then their _______. 10. A professor receives, on average, 24.7 e-mails from students the day before the midterm exam. To compute the probability of receiving at least 10 e-mails on such a day, he will use what type of probability distribution? 11. On the average, 1.8 customers per minute arrive at any one of the checkout counters of a grocery store. What type of probability distribution can be used to find out the probability that there will be no customer arriving at a checkout counter? 12. The local police department must write, on average, 5 tickets a day to keep department revenues at budgeted levels. Suppose the number of tickets written per day follows a Poisson distribution with a mean of 6.5 tickets per day. Interpret the value of the mean. 13. The number of customers arriving at a department store in a 5-minute period has a binomial distribution. 14. The number of customers arriving at a department store in a 5-minute period has a Poisson distribution. 15. The largest value that a Poisson random variable X can have is n. 16. Suppose that the number of airplanes arriving at an airport per minute is a Poisson process. The average number of airplanes arriving per minute is 3. The probability that exactly 6 planes arrive in the next minute is 0.05041. 17. Whenever piπequals=0.5, the binomial distribution will _______. 18. The diameters of 10 randomly selected bolts have a binomial distribution. 19. If π remains constant in a binomial distribution, an increase in n will increase the variance. 20. If π remains constant in a binomial distribution, an increase in n will not change the mean. 21. In its standardized form, the normal distribution has which of the following properties? 22. Which of the following is not true about the normal distribution? 23. The value of the cumulative standardized normal distribution at Z is 0.8770. What is the value of Z? 24. For some value of Z, the value of the cumulative standardized normal distribution is 0.2090. What is the value of Z? 25. For some value of Z, the value of the cumulative standardized normal distribution is 0.8340. What is the value of Z? 26. The value of the cumulative standardized normal distribution at 1.5X is 0.9332. What is the value of X? 27. The probability that a standard normal variable, Z, falls between minus−1.50 and 0.81 is 0.7242. 28. The probability that a standard normal variable, Z, is between 1.50 and 2.10 is the same as the probability Z is between minus−2.10 and minus−1.50. 29. The probability that a standard normal variable, Z, is between 1.00 and 3.00 is 0.1574. 30. The probability that a standard normal variable, Z, falls between minus−2.00 and minus−0.44 is 0.6472. 31. The probability that a standard normal variable, Z, is less than 5.0 is approximately 0. 32. Any set of normally distributed data can be transformed to its standardized form. 33. The "middle spread," that is the middle 50% of the normal distribution, is equal to one standard deviation. 34. It is known that the length of time it takes a college student to find a parking spot in the library parking lot follows a normal distribution with a mean of 3.5 minutes and a standard deviation of 1 minute. Find the probability that a randomly selected college student will find a parking spot in the library parking lot in less than 3 minutes. 35. It is known that the length of time it takes a college student to find a parking spot in the library parking lot follows a normal distribution with a mean of 3.5 minutes and a standard deviation of 1 minute, 75.8% of the college students will take more than how many minutes when trying to find a parking spot in the library parkinglot? 36. The owner of a fish market determined that the average weight for a catfish is 3.2 pounds with a standard deviation of 0.8 pound. A citation catfish should be one of the top 2% in weight. Assuming the weights of catfish are normally distributed, at what weight (in pounds) should the citation designation be established? 37. A worker earns $15 per hour at a plant and is told that only 2.5% of all workers make a higher wage. If the wage is assumed to be normally distributed and the standard deviation of wage rates is $5 per hour, the average wage for the plant is $7.50 per hour. 38. A normal probability plot may be used to assess the assumption of normality for a particular set of data. 39. If a data set is approximately normally distributed, its normal probability plot would be S-shaped. 40. Sampling distributions describe the distribution of _______. 41. The Central Limit Theorem is important in statistics because _______. 42. Which of the following is true about the sampling distribution of the sample mean? 43. Suppose the ages of students in Statistics 101 follow a right skewed distribution with a mean of 23 years and a standard deviation of 3 years. If we randomly sampled 100 students, which of the following statements about the sampling distribution of the sample mean age is incorrect? 44. Why is the Central Limit Theorem so important to the study of sampling distributions? 45. Suppose a sample of n=50 items is selected from a population of manufactured products and the weight, X, of each item is recorded. Prior experience has shown that the weight has a probability distribution with μ=6 ounces and σ=2.5 ounces. Which of the following is true about the sampling distribution of the sample mean if a sample of size 15 is selected? 46. Sales prices of baseball cards from the 1960s are known to possess a right skewed distribution with a mean sale price of $5.25 and a standard deviation of $2.80. Suppose a random sample of 100 cards from the 1960s is selected. Describe the sampling distribution for the sample mean sale price of the selected cards. 47. Player salaries in a professional baseball average averaged $3.26 million with a standard deviation of $1.2 million in a certain year in the past. Suppose a sample of 100 league players was taken. What was the standard error for the sample mean salary? 48. The owner of a fish market has an assistant who has determined that the weights of catfish are normally distributed, with mean of 3.2 pounds and standard deviation of 0.8 pound. If a sample of 16 fish is taken, what would the standard error of the mean weight equal? 49. The owner of a fish market has an assistant who has determined that the weights of catfish are normally distributed, with mean of 3.2 pounds and standard deviation of 0.8 pound. If a sample of 25 fish yields a mean of 3.6 pounds, what is the Z-score for this observation? 50. For sample size 16, the sampling distribution of the mean will be approximately normally distributed _______. 51. Which of the following is true regarding the sampling distribution of the mean for a large sample size? 52. For sample sizes greater than 30, the sampling distribution of the mean will be approximately normally distributed _______. 53. For sample size 1, the sampling distribution of the mean will be normally distributed _______. 54. If the population distribution is symmetric, the sampling distribution of the mean can be approximated by the normal distribution if the samples contain 15 observations. 55. If the population distribution is unknown, in most cases the sampling distribution of the mean can be approximated by the normal distribution if the samples contain at least 30 observations. 56. As the sample size increases, the effect of an extreme value on the sample mean becomes smaller. 57. The standard error of the mean is also known as the standard deviation of the sampling distribution of the sample mean. 58. As the size of the sample is increased, the standard deviation of the sampling distribution of the sample mean for a normally distributed population will stay the same. 59. The fact that the sample means are less variable than the population data can be observed from the standard error of the mean. 60. The amount of bleach a machine pours into bottles has a mean of 36 oz with a standard deviation of 0.15 oz. Suppose we take a random sample of 36 bottles filled by this machine. The sampling distribution of the sample mean has a mean of 36 oz. 61. The sample mean is an unbiased estimator for the population mean. 62. The standard error of the population proportion will become larger _______. 63. The sample proportion is an unbiased estimate of the population proportion. 64. The standard error of the sampling distribution of a sample proportion is where ρ is the sample proportion. 65. The standard deviation of the sampling distribution of a sample proportion is where π is the population proportion. 66. The sample proportion is an unbiased estimator for the population proportion. 67. A point estimate consists of a single sample statistic that is used to estimate the true population parameter. 68. The sample mean is a point estimate of the population mean. 69. A population parameter is used to estimate a confidence interval. 70. The confidence interval obtained will always correctly estimate the population parameter. 71. The difference between the upper limit of a confidence interval and the point estimate used in constructing the confidence interval is called the sampling error. 72. Sampling error equals half the width of a confidence interval. 73. The width of a confidence interval equals twice the sampling error. 74. The sampling error can either be positive or negative. 75. The difference between the sample proportion and the population proportion is called the sampling error. 76. The confidence interval estimate of the population mean is constructed around the sample mean. 77. It is desired to estimate the mean total compensation of CEOs in the service industry. Data were randomly collected from 18 CEOs and a 95% confidence interval was calculated to be ($2,181,260, $5,836,180). Which of the following interpretations is correct? 78. The t distribution approaches the standardized normal distribution when the number of degrees of freedom increases. 79. The t distribution is used to develop a confidence interval estimate of the population mean when the population standard deviation is unknown. 80. Which of the following is true about a t distribution? 81. Which of the following is not true about the Student's t distribution? 82. A major department store chain is interested in estimating the mean amount its credit card customers spent on their first visit to the chain's new store in the mall. Fifteen credit card accounts were randomly sampled and analyzed with the X=$50.50 and S=20. Assuming the distribution of the amount spent by customers on their first visit is approximately normal, what is the shape of the sampling distribution of the sample mean that will be used to create the desired confidence interval for μ? 83. The t distribution allows the calculation of confidence intervals for means when the actual standard deviation is not known. 84. The t distribution is used to develop a confidence interval estimate of the population proportion when the population standard deviation is unknown. 85. The standardized normal distribution is used to develop a confidence interval estimate of the population proportion regardless of whether the population standard deviation is known. 86. The standardized normal distribution is used to develop a confidence interval estimate of the population proportion when the sample size is sufficiently large. 87. The president of a university would like to estimate the proportion of the student population that owns a personal computer. In a sample of 500 students, 417 own a personal computer. Determine whether the statement is true or false.The parameter of interest is the mean number of students in the population who own a personal computer. 88. The president of a university would like to estimate the proportion of the student population that owns a personal computer. In a sample of 500 students, 417 own a personal computer. Determine whether the statement is true or false. The parameter of interest is the proportion of the student population who own a personal computer. 89. The president of a university would like to estimate the proportion of the student population that owns a personal computer. In a sample of 500 students, 417 own a personal computer. Determine whether the statement is true or false. A 99% confidence interval will contain 99% of the student population who own a personal computer. 90. For a given data set, the confidence interval will be wider for 95% confidence than for 90% confidence. 91. Holding the sample size fixed, increasing the level of confidence in a confidence interval will necessarily lead to a wider confidence interval. 92. Holding the width of a confidence interval fixed, increasing the level of confidence can be achieved with a lower sample size. 93. Suppose a 95% confidence interval for μ has been constructed. It is decided to take a larger sample and to decrease the confidence level of the interval. How would the resulting interval be affected? (Assume that the sample statistics gathered would not change very much for the new sample.) 94. Other things being equal, as the confidence level for a confidence interval increases, the width of the interval increases. 95. Other things being equal, the confidence interval for the mean will be wider for 95% confidence than for 90% confidence. 96. When determining the sample size necessary for estimating the true population mean, which factor is not considered when sampling with replacement? 97. Which of the following is true about the width of a confidence interval estimate for a proportion? 98. When determining the sample size for a proportion with a given level of confidence and sampling error, how is the required sample size affected as the estimated value of π gets closer to 0.50? 99. The difference between the sample size and the population size is called the sampling error. 100. Suppose a 95% confidence interval for μ turns out to be (1,000, 2,100). Give a definition of what it means to be "95% confident" as an inference. WEEK 11 HW Correlation QUESTION 1 Fat Grams and Secondary Schools. The number of fat calories and grams of saturated fat in a number of fast-food non-breakfast entrees are shown below. Fat Calories 190 220 270 360 460 540 Sat. Fat 9 8 13 17 23 27 Compute the t statistics for testing the correlation between variables; Null hypothesis H0: ρ = 0 Alternative hypothesis HA: ρ ≠ 0 or HA: ρ < 0 or HA: ρ > 0 Second, we calculate the value of the test statistic using the following formula: Test statistic: t statistics = r (√ n−2 )/ (√ 1−r 2 ) QUESTION 2 The symbol for the sample correlation coefficient is ____________________ The symbol for the population correlation coefficient is ______________________ QUESTION 3 What is the range of values for the correlation coefficient? QUESTION 4 When two variables are correlated, can the researcher be sure that one variable causes the other? If YES , why? If NO , why? QUESTION 5 What is meant by the statement that two variables are related? QUESTION 6 Fat Grams and Secondary Schools. The number of fat calories and grams of saturated fat in a number of fast-food non-breakfast entrees are shown below. Fat Calories 190 220 270 360 460 540 Sat. Fat 9 8 13 17 23 27 Compute the value of the correlation coefficient? QUESTION 7 Fat Grams and Secondary Schools. The number of fat calories and grams of saturated fat in a number of fast-food non-breakfast entrees are shown below. Fat Calories 190 220 270 360 460 540 Sat. Fat 9 8 13 17 23 27 QUESTION 8 a) What is the diagram of the independent and dependent variables called? b) Why is drawing this diagram important? QUESTION 9 What statistical test is used to test the significance of the correlation coefficient ? [Show More]
Last updated: 2 years ago
Preview 1 out of 38 pages
Buy this document to get the full access instantly
Instant Download Access after purchase
Buy NowInstant download
We Accept:

Reviews( 0 )
$32.00
Can't find what you want? Try our AI powered Search
Document information
Connected school, study & course
About the document
Uploaded On
Nov 13, 2020
Number of pages
38
Written in

Additional information
This document has been written for:
Uploaded
Nov 13, 2020
Downloads
0
Views
84