DATA ANALYSIS > QUESTIONS & ANSWERS > Questions & Answers> Vellore Institute of Technology SWE_ Fundamentals of Data Analytics_Quiz. Scor (All)
Questions & Answers> Vellore Institute of Technology SWE_ Fundamentals of Data Analytics_Quiz. Score 100%
Document Content and Description Below
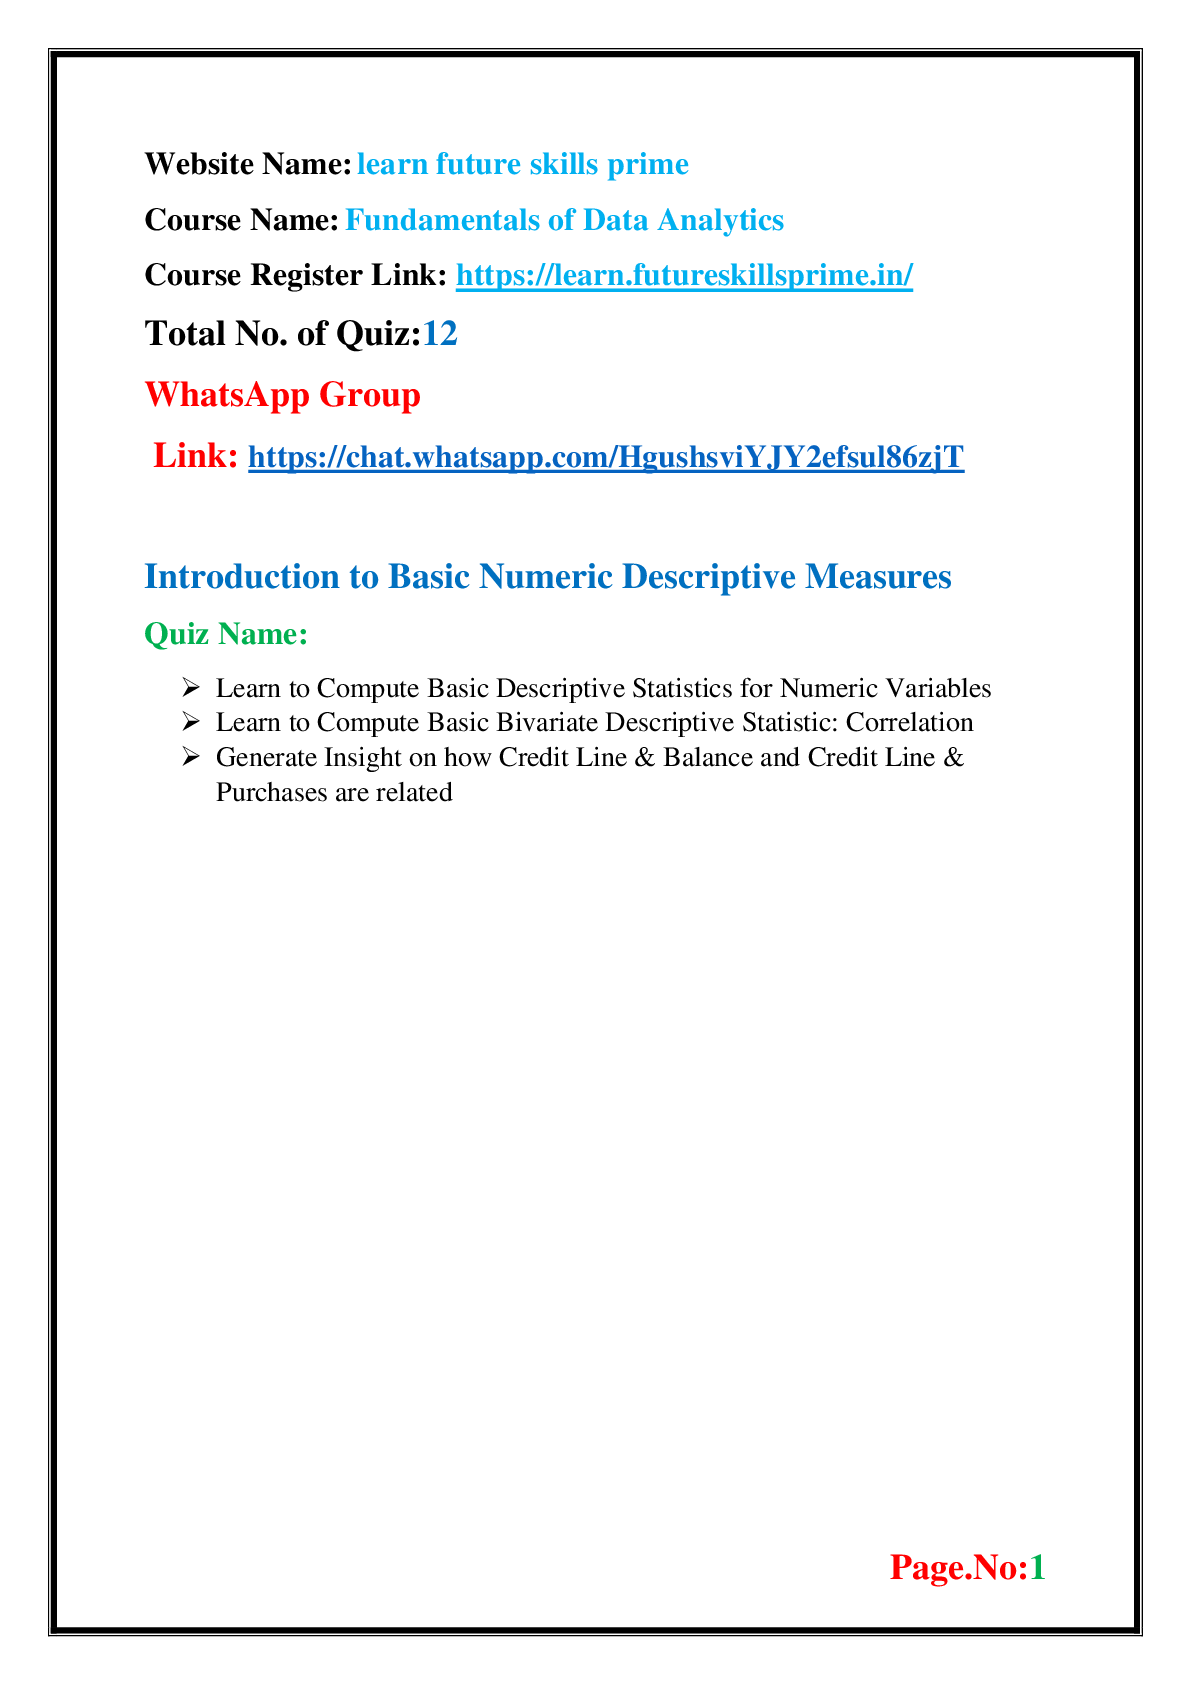
Website Name: learn future skills prime Course Name: Fundamentals of Data Analytics Course Register Link: https://learn.futureskillsprime.in/ Total No. of Quiz:12 WhatsApp Group Link: https://cha... t.whatsapp.com/HgushsviYJY2efsul86zjT Introduction to Basic Numeric Descriptive Measures Quiz Name: ➢ Learn to Compute Basic Descriptive Statistics for Numeric Variables ➢ Learn to Compute Basic Bivariate Descriptive Statistic: Correlation ➢ Generate Insight on how Credit Line & Balance and Credit Line & Purchases are relatedPage.No:2 Quiz- 1 Learn to Compute Basic Descriptive Statistics for Numeric Variables Q1. Which stock has higher IQR? MSFT AAPL Q2. What is the standard deviation for MSFT Daily log return? 0.1206 0.0236 0.002 0.0032 Q3. What is the standard deviation for AAPL Daily log return? 0.0323 0.2367 0.3206 0.03736 Q4. Which stock is more volatile? MSFT AAPLPage.No:3 Quiz-2 Learn to Compute Basic Bivariate Descriptive Statistic: Correlation Q1. What conclusion can be drawn from the computed correlation between AAPL & MSFT daily log return? They move in the same direction Their movement is independent of each other They move in opposite direction Q2. What is the range of correlation function? It lies between -infinity to +infinity It lies between 0 to +1 It lies between -1 to +1 It lies between -1 to 0 Q3. Which pair of stocks had the highest correlation? AAPL & SPX MSFT & SPX AAPL & MSFT Q4. What is the sign of the correlation between AAPL & MSFT? Negative PositivePage.No:4 Quiz-3 Generate Insight on how Credit Line & Balance and Credit Line & Purchases are related Q1. During a survey the "Education Level" was coded "Primary or Low" as 1, "High School" as 2, "Graduate or Above" as 3. Can we do mathematical operations like addition or subtraction? Yes, we can No, we can not Q2. A measure of central tendency tells us, using a single value, the best representation for an entire set of scores TRUE FALSE Q3. Find the odd one out Standard Deviation Range Median IQR Q4. Mode of a data is the most frequently occurring value the middle most value the value that represents the data best the arithmetic average Q5. Pearson correlation between variable X and Y is found to be -1. What does that mean? There is strong negative correlationPage.No:5 There is no correlations There is perfect negative correlation If X increases by 1 unit, Y will decrease by 1 unit Q6. A researcher finds a correlation of .80 between personal income and number of foreign holiday trips a person undertakes. Based upon this finding he can conclude that? personal income is a positively skewed variable more income causes high number of foreign holiday trips Number of foreign trips is associated with higher income a person who goes for high number of such trips will have an annual income of $80,000 Q7. State true or false: Standard deviation of data series is negative Yes No Q8. Find the odd one out Number of dependents Financial Status of an individual Height of an individual Age of an individual Q9. During a survey the "Education Level" was coded "Primary or Low" as 1, "High School" as 2, "Graduate or Above" as 3. What central tendency measure can be used for representing a "Education Level" of the population? Mean Mode Median We cannot calculate any central tendency measure herePage.No:6 Topic 2: Introduction to Probability Distributions and Statistical In Quiz Name: 1. Learn to detect deviation of Data from Normality using Skewness & Kurtosis 2. Learn to Test for Normality of Data using Shapiro-Wilk Normality Test 3. Learn how the Measures of Central Tendency vary for a Normal Distribution 4. Determine if Credit Line, Balances & Purchases of Customers follow a Normal Distribution Quiz-1 Learn to detect deviation of Data from Normality using Skewness & Kurtosis Q1. Which of the following best describes skewness of AAPL? Right Tailed Left Tailed Q2. Is the distribution of Daily Log Return of AAPL or MSFT Normal? Yes No Q3. Which of the following best describes skewness of MSFT? Right Tailed Left Tailed Q4. Is the excess kurtosis for MSFT positive? No YesPage.No:7 Quiz-2 Learn to Test for Normality of Data using Shapiro-Wilk Normality Test Q1. s the MSFT Daily Log Return Normal? Hint: Look at p-value? Yes No Q2. Is the AAPL daily log return Normal? hint: look at p-value? Yes NoPage.No:8 Quiz-3 Learn how the Measures of Central Tendency vary for a Normal Distribution Q1. What is the value of Mean? 20 10 30 Q2. Is the distribution underlying "pcnt_trans_clothing" normal? Yes No Q3. What is the value of Median? 30 10 20 Q4. What is the value of Mode? 20 10 30Page.No:9 Quiz-4 Determine if Credit Line, Balances & Purchases of Customers follow a Normal Distribution Q1. Binomial distribution has mean greater than variance. True or False FALSE TRUE Q2. Skewness of Normal distribution is Negative 0 Can't Say Positive Q3. Binomial distribution can be seen as a sum of Bernoulli trials FALSE TRUE Q4. Any distribution can be approximated to normal distribution if number of observation is very high. Which statistical theorem tells this? Hypothesis Testing Central Limit Theorem None of the above Law of Large Numbers Q5. Approximately what percentage of scores fall within one standard deviation of the mean in a normal distribution? 0.34 0.95 0.99 0.68Page.No:10 Q6. In hypothesis testing, we always test: None of the above If the null hypothesis is right or not If the there is any experimental error or not If the alternate hypothesis is right or not Q7. In hypothesis testing, we fix the probability of type-I error value. This value is known as Significance Level Confidence Level P-value Power Q8. Poisson distribution has mean greater than variance. True or False? TRUE FALSE Q9. Number of printing mistakes in a book can be assumed to follow Binomial Distribution None of the Above Normal Distribution Poisson Distribution Q10. Number of parameters in binomial distribution 0 2 1 3Page.No:11 Frequently Applied Statistical Tests Quiz Name: 1. Learn to Compute One Sample One Tailed t-Test 2. Learn to Compute Paired t-Test 3. Learn to Apply Two Sample t-Test 4. Learn to Conduct Chi-Square Test for Independence 5. Determine if there is any Statistically Significant Difference in Food Habits by Gender Quiz-1 Learn to Compute One Sample One Tailed t-Test Q1. How many options can the alternate hypothesis have for one sided test? Less than Less than/greater than Greater than Q2. What is the hypothesized value of mean? 0.06 0.05 0.03 0.04 Q3. Based on the t-statistics, what is the conclusion regarding null hypothesis? Do not reject Reject Q4. P-value for a two-tailed test is always two times the P-value for either of the one-tailed tests? FALSE TRUEPage.No:12 Quiz-2 Learn to Compute Paired t-Test Q1. Based on the computed p-value, what is the conclusion regarding null hypothesis? Reject Do not reject Q2. What is the degree of freedom in this experiment? 99 199 200 100Page.No:13 Quiz-3 Learn to Apply Two Sample t-Test Q1. Do you think communicating with customers has made significant increase in campaign sale? Can't Say Yes No Q2. Based on F-statistics and p-value what is the conclusion regarding equality of variance? They are different They are same Q3. Based on t-statistics and p-value what is the conclusion regarding null hypothesis? Reject Do not reject Q4. Is the p-value for the F-test <0.05? No YesPage.No:14 Quiz-4 Learn to Conduct Chi-Square Test for Independence Q1. What is the correct conclusion regarding null hypothesis & independence of two categorical variables under test based on the computed p-value? Do not reject the null, variables are independent Do not reject the null, variables are dependent Reject the null, variables are independent Reject the null, variables are not independent i.e. there is relationship between them Q2. What is correct set of categorical variables that were selected for ChiSquare Test? Pizza order habit & seniority Pizza order habit & Gender Pizza order & Housing choice Housing choice & SeniorityPage.No:15 Quiz-5 Determine if there is any Statistically Significant Difference in Food Habits by Gender Q1. In which of the following scenarios, non-parametric test is NOT the best option Sample size is small Data is clearly not-normality Distributional form of data is not known Data is highly skewed Q2. Before performing a two-sample t-test, we should always Perform normality test Calculate means of the samples separately None of the above Perform test of homogeneity Q3. In which scenario, we cannot use t-Test? Testing if one population variance is greater or less than the other population variance Testing if a population mean is equal, less or greater than hypothesized one Testing if two population mean are equal Testing if one population mean is greater or less than the other population mean Q4. Find the odd one out F Test Z- test Chi-square test T- testPage.No:16 Q5. In z-tests, the test statistic follows Normal distribution with mean zero and variance 1 Normal distribution with mean zero F-Distribution T-Distribution [Show More]
Last updated: 2 years ago
Preview 1 out of 16 pages
Buy this document to get the full access instantly
Instant Download Access after purchase
Buy NowInstant download
We Accept:

Reviews( 0 )
$4.00
Can't find what you want? Try our AI powered Search
Document information
Connected school, study & course
About the document
Uploaded On
Jan 18, 2023
Number of pages
16
Written in

Additional information
This document has been written for:
Uploaded
Jan 18, 2023
Downloads
0
Views
66