Data Systems > QUESTIONS & ANSWERS > STAT 361 Data Analysis - Yale University WORKSHEET 3.7: STATISTICAL THINKING IN PYTHON (All)
STAT 361 Data Analysis - Yale University WORKSHEET 3.7: STATISTICAL THINKING IN PYTHON
Document Content and Description Below
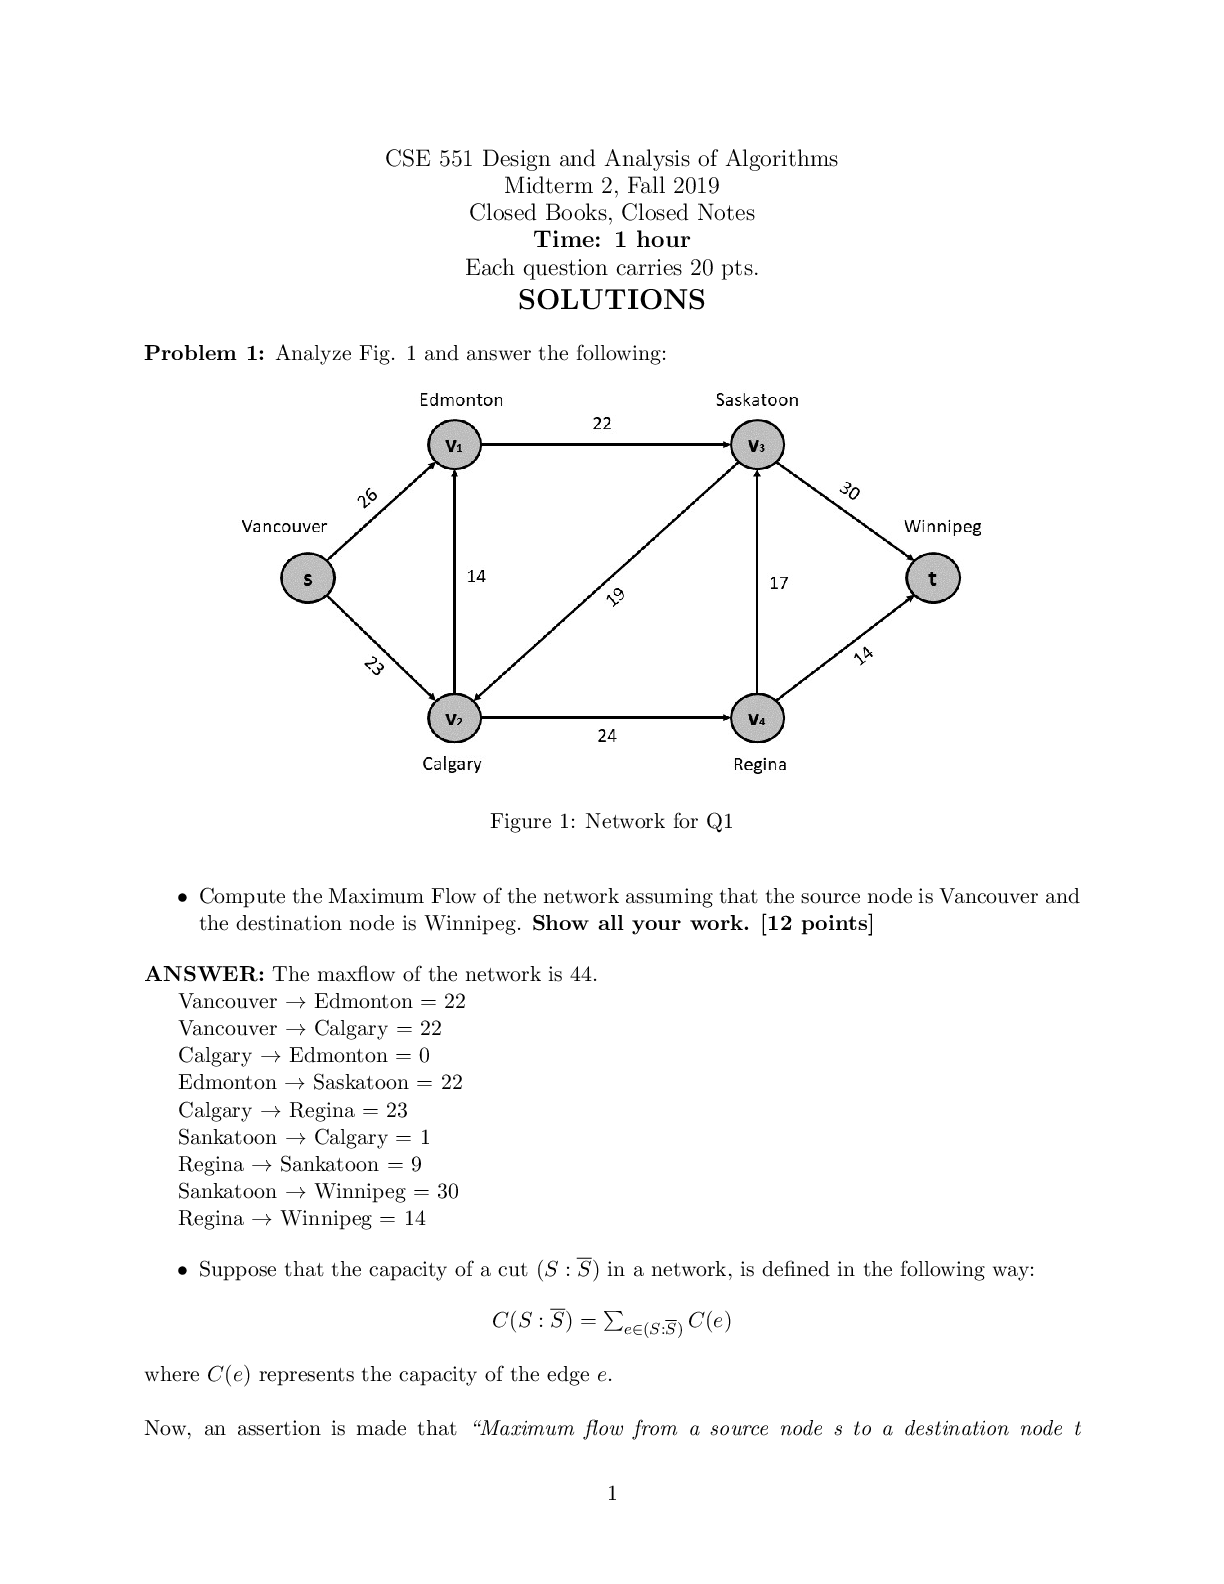
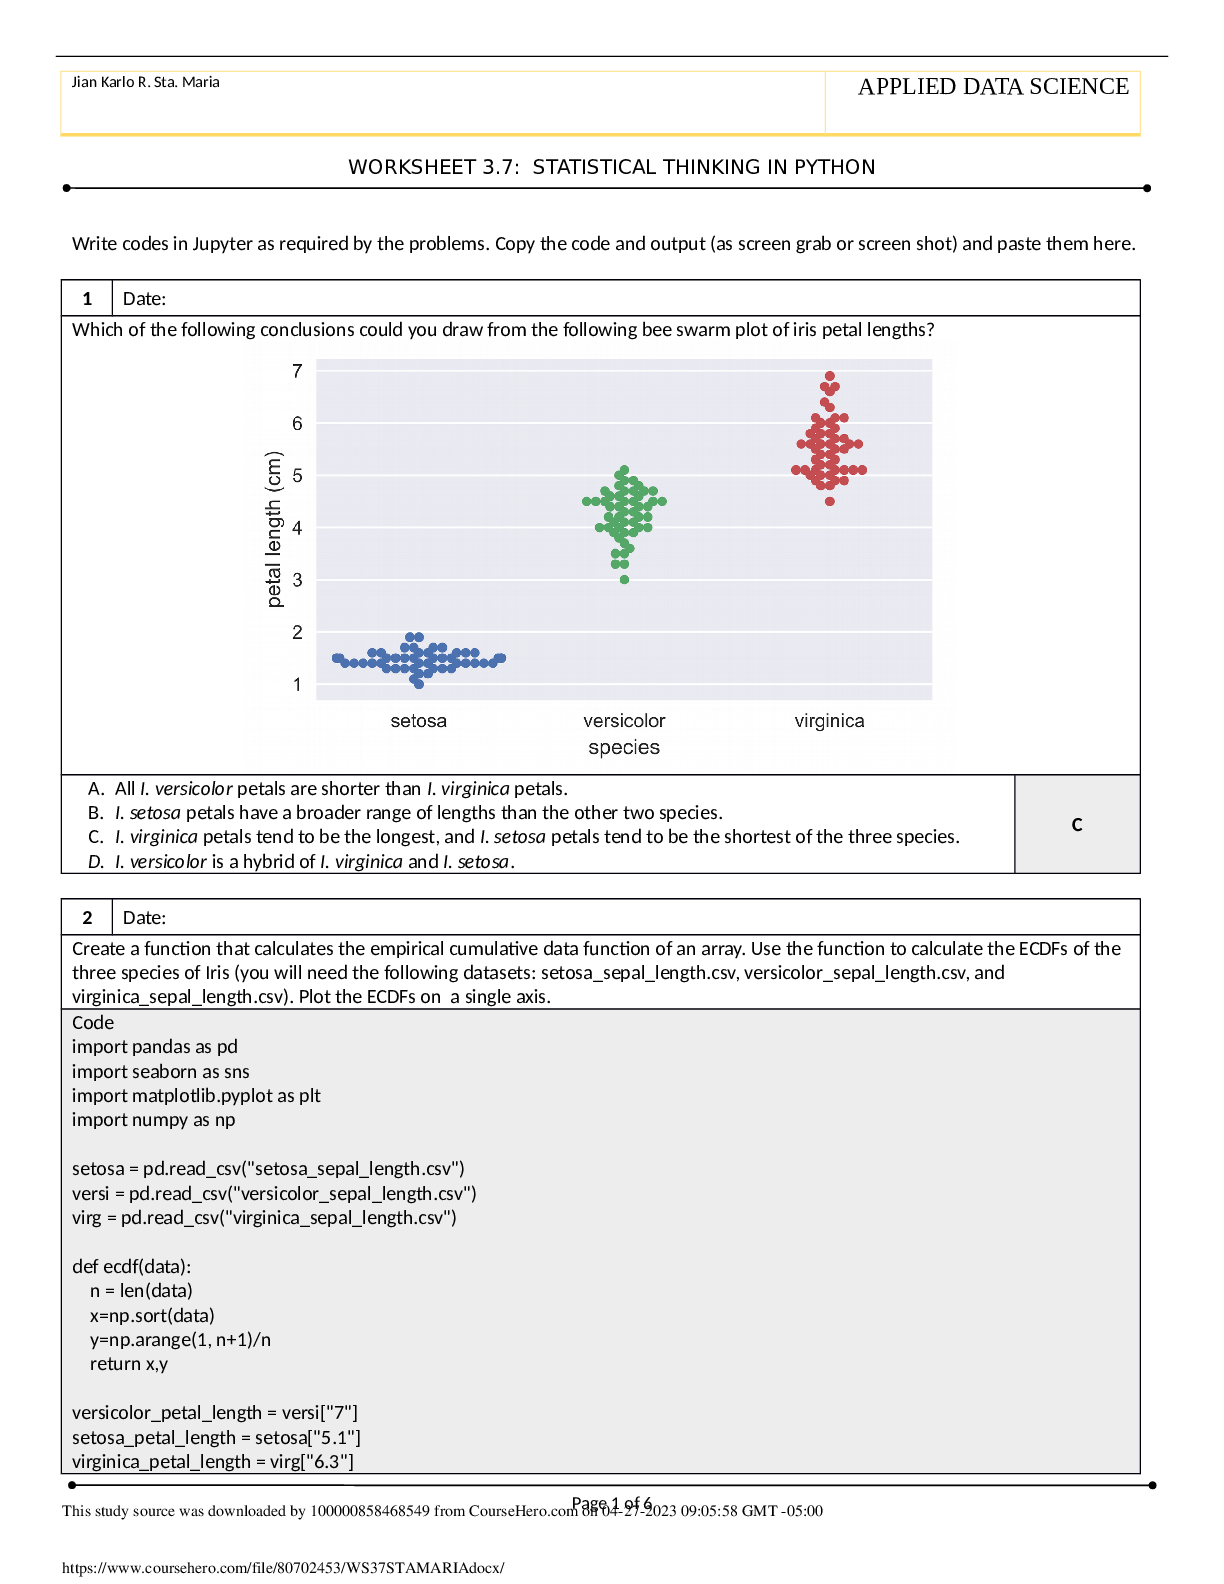
STAT 361 Data Analysis - Yale University WORKSHEET 3.7: STATISTICAL THINKING IN PYTHONWrite codes in Jupyter as required by the problems. Copy the code and output (as screen grab or screen shot) and p... aste them here. 1 Date: Which of the following conclusions could you draw from the following bee swarm plot of iris petal lengths? A. All I. versicolor petals are shorter than I. virginica petals. B. I. setosa petals have a broader range of lengths than the other two species. C. I. virginica petals tend to be the longest, and I. setosa petals tend to be the shortest of the three species. D. I. versicolor is a hybrid of I. virginica and I. setosa. C 2 Date: Create a function that calculates the empirical cumulative data function of an array. Use the function to calculate the ECDFs of the three species of Iris (you will need the following datasets: setosa_sepal_length.csv, versicolor_sepal_length.csv, and virginica_sepal_length.csv). Plot the ECDFs on a single axis. Code import pandas as pd import seaborn as sns import matplotlib.pyplot as plt import numpy as np setosa = pd.read_csv("setosa_sepal_length.csv") versi = pd.read_csv("versicolor_sepal_length.csv") virg = pd.read_csv("virginica_sepal_length.csv") def ecdf(data): n = len(data) x=np.sort(data) y=np.arange(1, n+1)/n return x,y versicolor_petal_length = versi["7"] setosa_petal_length = setosa["5.1"] virginica_petal_length = virg["6.3"] Page 1 of 6 This study source was downloaded by 100000858468549 from CourseHero.com on 04-27-2023 09:05:58 GMT -05:00 https://www.coursehero.com/file/80702453/WS37STAMARIAdocx/Jian Karlo R. Sta. Maria APPLIED DATA SCIENCE WORKSHEET 3.7: STATISTICAL THINKING IN PYTHON x_set, y_set = ecdf(setosa_petal_length) x_vir, y_vir = ecdf(virginica_petal_length) x_vers, y_vers = ecdf(versicolor_petal_length) plt.plot(x_set, y_set, marker='.', linestyle='none') plt.plot(x_vers, y_vers, marker='.', linestyle='none') plt.plot(x_vir, y_vir, marker='.', linestyle='none') plt.legend(('setosa', 'versicolor', 'virginica'), loc='lower right') plt.xlabel('sepal length (cm)') plt.ylabel('ECDF') plt.show() Output 3 Date: Which of the following statements is true about means and medians? A. An outlier can significantly affect the value of both the mean and the median. B. An outlier can significantly affect the value of the mean, but not the median. C. Means and medians are in general both robust to outliers. D. The mean and median are equal if there is an odd number of data points. B 4 Date: Without plotting the data, determine the 25th, 50th and 75th percentiles of the three iris species. Code import pandas as pd import seaborn as sns import matplotlib.pyplot as plt import numpy as np setosa = pd.read_csv("setosa_sepal_length.csv") Page 2 of 6 This study source was downloaded by 100000858468549 from CourseHero.com on 04-27-2023 09:05:58 GMT -05:00 https://www.coursehero.com/file/80702453/WS37STAMARIAdocx/Jian Karlo R. Sta. Maria APPLIED DATA SCIENCE WORKSHEET 3.7: STATISTICAL THINKING IN PYTHON versi = pd.read_csv("versicolor_sepal_length.csv") virg = pd.read_csv("virginica_sepal_length.csv") versicolor = np.percentile(versi["7"], [25, 50, 75]) setosa = np.percentile(setosa["5.1"], [25, 50, 75]) virginica = np.percentile(virg["6.3"], [25, 50, 75]) print("Versicolor: ", versicolor) print("Setosa: ", setosa) print("Virginica: ", virginica) Output Versicolor: [5.6 5.9 6.3] Setosa: [4.8 5. 5.2] Virginica: [6.2 6.5 6.9] 5 Date: Let’s say a bank made 100 mortgage loans. It is possible that anywhere between 0 and 100 of the loans will be defaulted upon. We would like to know the probability of getting a given number of defaults, given that the probability of a default is 0.05. Draw 10,000 samples of this binomial distribution and plot the CDF using our ecdf function. Do not forget to use np.random.seed(42). [Show More]
Last updated: 2 years ago
Preview 1 out of 6 pages
Buy this document to get the full access instantly
Instant Download Access after purchase
Buy NowInstant download
We Accept:

Reviews( 0 )
$9.50
Can't find what you want? Try our AI powered Search
Document information
Connected school, study & course
About the document
Uploaded On
Apr 30, 2023
Number of pages
6
Written in

Additional information
This document has been written for:
Uploaded
Apr 30, 2023
Downloads
0
Views
60