*NURSING > QUESTIONS & ANSWERS > Chamberlain College of NursingMATH 225N MATHWeek 3 Central Tendancy Questions and answers (All)
Chamberlain College of NursingMATH 225N MATHWeek 3 Central Tendancy Questions and answers
Document Content and Description Below
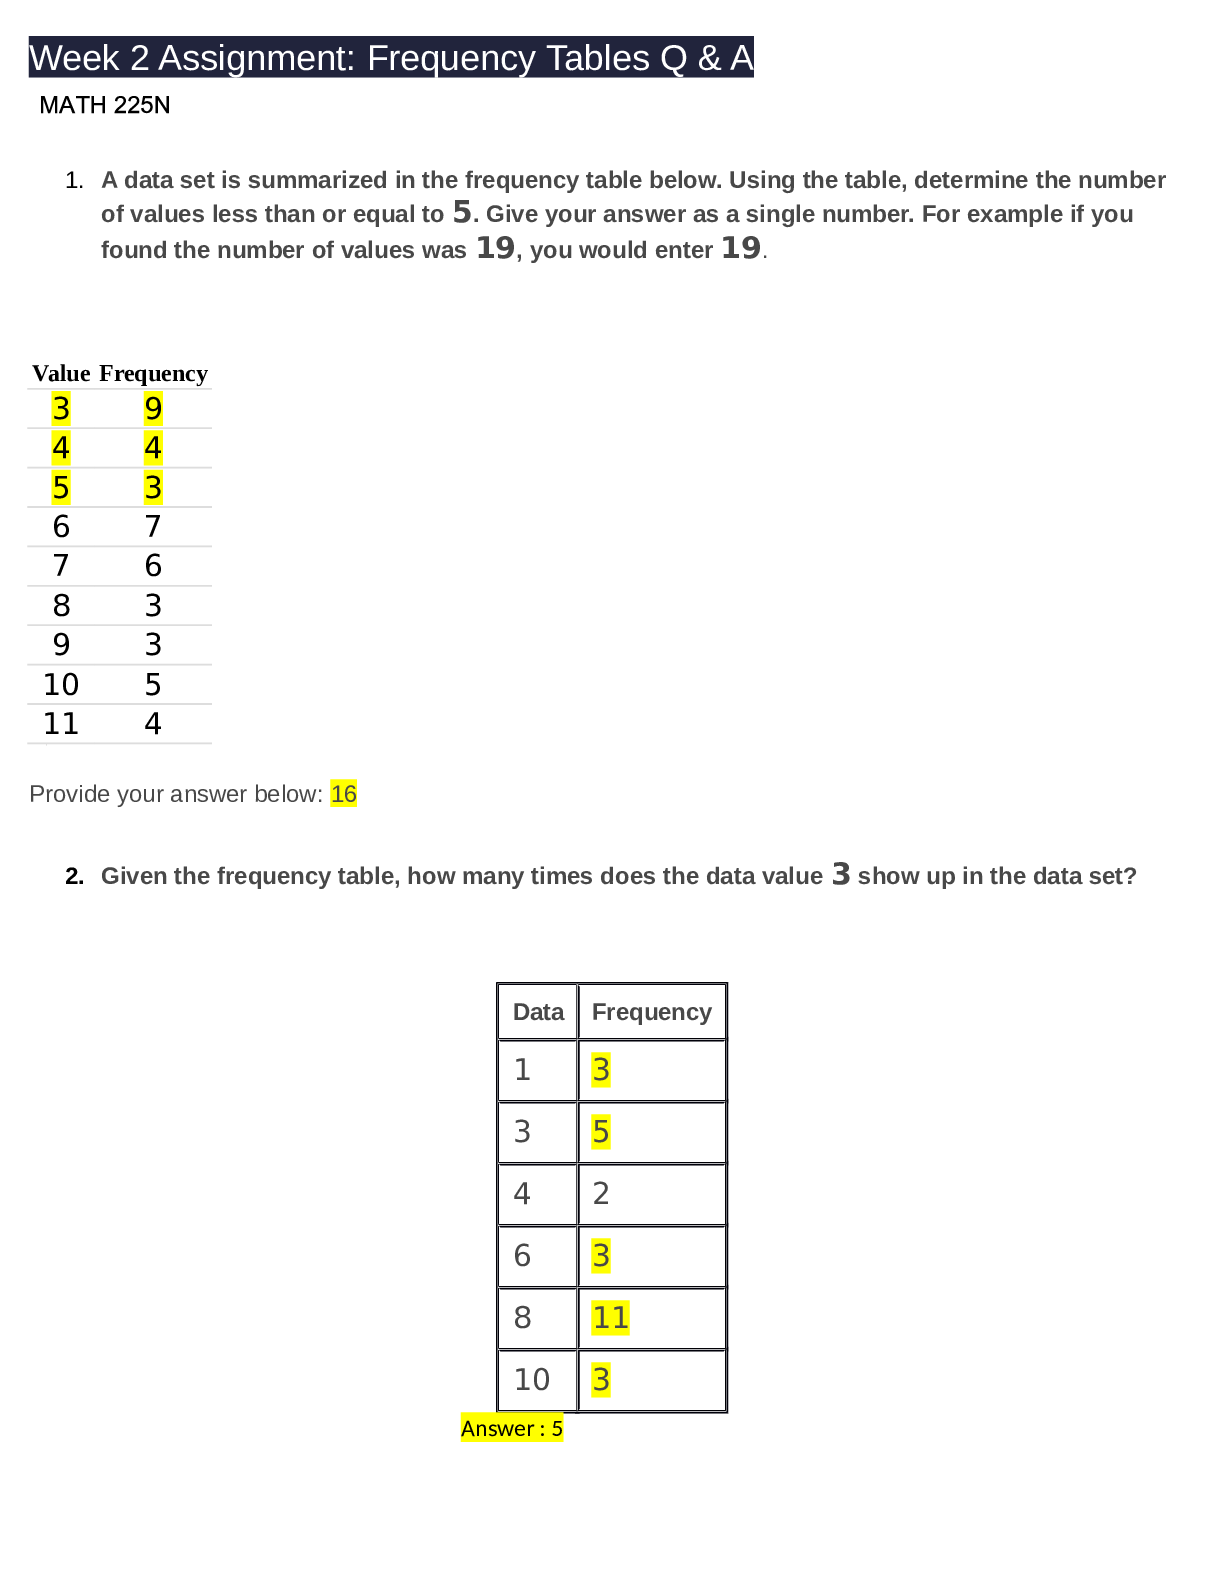
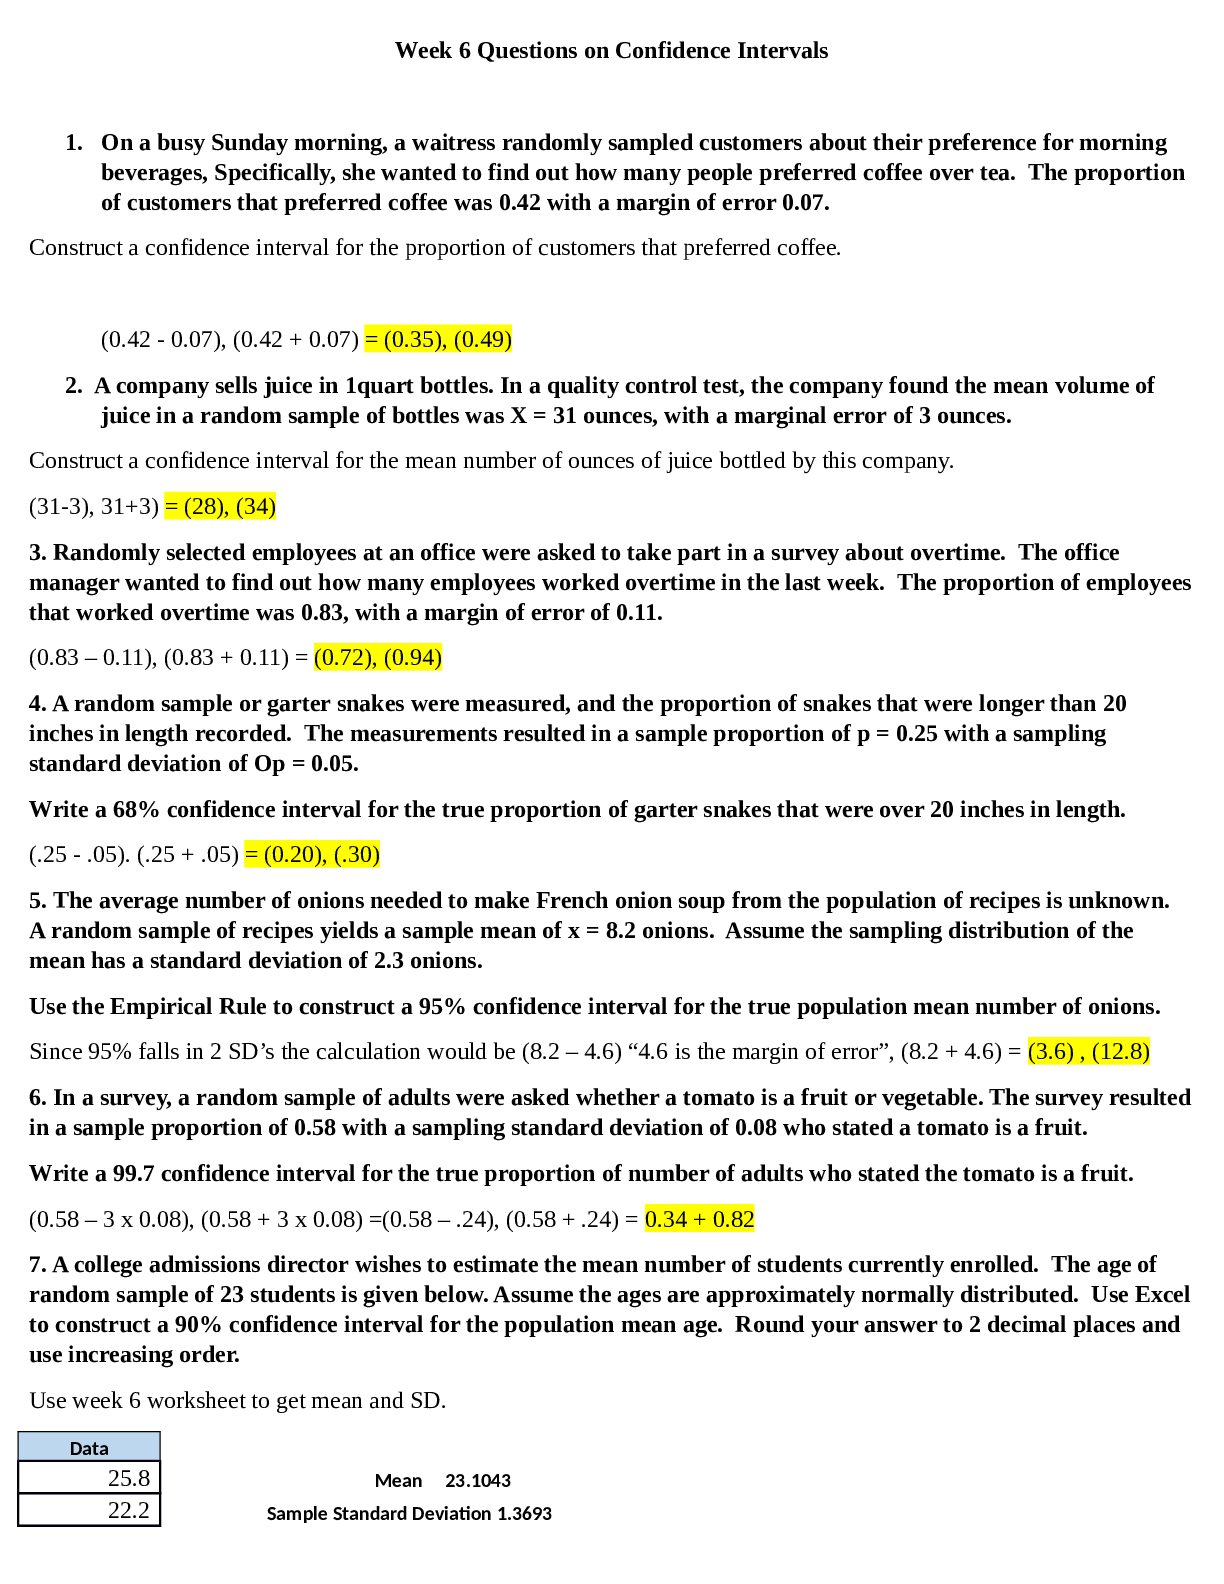
Week 3 Questions Given the following box-and-whisker plot, decide if the data is skewed or symmetrical. Select the correct answer below: The data are skewed to the left. The data are skewed to the... right. The data are symmetric. Which of the following frequency tables show a skewed data set? Select all answers that apply. Select all that apply: Select all that apply: Value Frequency 5 2 6 5 7 9 8 15 9 18 10 24 11 19 12 15 13 10 14 4 Value Frequency 13 2 14 5 15 14 16 13 17 23 18 2619 15 20 2 Value Frequency 5 1 6 1 7 9 8 20 9 24 10 20 11 9 12 4 13 1 14 1 15 1 Value Frequency 0 4 1 12 2 23 3 28 4 17 5 7 6 6 7 3 Which of the following frequency tables show a skewed data set? Select all answers that apply. Select all that apply: Value Frequency 0 2 1 11 2 30 3 22 4 155 12 6 6 7 1 8 1 Value Frequency 4 1 5 2 6 3 7 7 8 19 9 17 10 17 11 15 12 12 13 4 14 1 15 2 Value Frequency 13 1 14 6 15 9 16 15 17 27 18 28 19 10 20 4 Value Frequency 3 1 4 0 5 1 6 5 7 9 8 12 9 12 10 18 11 12 12 17 13 11 14 015 1 16 0 17 1 Which of the following frequency tables shows a skewed data set? Select all answers that apply. Select all that apply: Value Frequency 7 4 8 8 9 12 10 16 11 15 12 13 13 10 14 5 Value Frequency 5 3 6 3 7 8 8 12 9 15 10 19 11 19 12 10 13 4 14 3 15 3 16 1 Value Frequency 12 1 13 2 14 3 15 13 16 1017 26 18 25 19 15 20 5 Value Frequency 0 9 1 21 2 23 3 18 4 15 5 9 6 3 7 2 For the following dataset, you are interested to determine the "spread" of the data. Would you employ calculations for the sample standard deviation, or population standard deviation for this dataset: Ages of all students in a Statistics course with an enrollment of 30 students. Select the correct answer below: Use calculations for sample standard deviation Use calculations for population standard deviation Which of the following lists of data has the smallest standard deviation? [Show More]
Last updated: 2 years ago
Preview 1 out of 26 pages

Buy this document to get the full access instantly
Instant Download Access after purchase
Buy NowInstant download
We Accept:

Reviews( 0 )
$11.00
Can't find what you want? Try our AI powered Search
Document information
Connected school, study & course
About the document
Uploaded On
Aug 06, 2021
Number of pages
26
Written in

Additional information
This document has been written for:
Uploaded
Aug 06, 2021
Downloads
0
Views
64