Structured Data > GIZMOS > Time distance gizmo student worksheet (All)
Time distance gizmo student worksheet
Document Content and Description Below
Last updated: 3 years ago
Preview 1 out of 10 pages
Instant download

Buy this Document to get the Full Access Instantly
Provided by Students Who Aced it
We Verify Document Content to Gurantee Accuracy
Reviews( 0 )
Document information
Connected school, study & course
About the document
Uploaded On
Aug 09, 2021
Number of pages
10
Written in
All

Additional information
This document has been written for:
Uploaded
Aug 09, 2021
Downloads
0
Views
147
Document Keyword Tags
Recommended For You
Get more on GIZMOS »
Data Structures and Problem Solving Using Java, 4e Mark A. Wei...
TEST BANK STRUCTURE &FUNCTION OF THE BODY 16th Edition, Patton...
Fundamentals of Structural Analysis Solution Manual 5th editio...
Java Foundations Introduction to Program Design and Data Struc...
Test Bank For Data Structures and Abstractions with Java, 5th...

CIPP/E Exam Questions ALL ANSWERS 100% CORRECT SPRING FALL-202...
.png)
Professional Home Inspector Exam NHIE / TREC #2 Questions and...
.png)
.png)
.png)
National Home Inspector Examination Questions and Answers Rate...


Adobe InDesign Certification Exam ALL ANSWERS RATED GRADE A+ 1...
.png)
SHRM-CP - PRACTICE EXAM QUESTIONS AND ANSWERS ALREADY GRADED A...
.png)
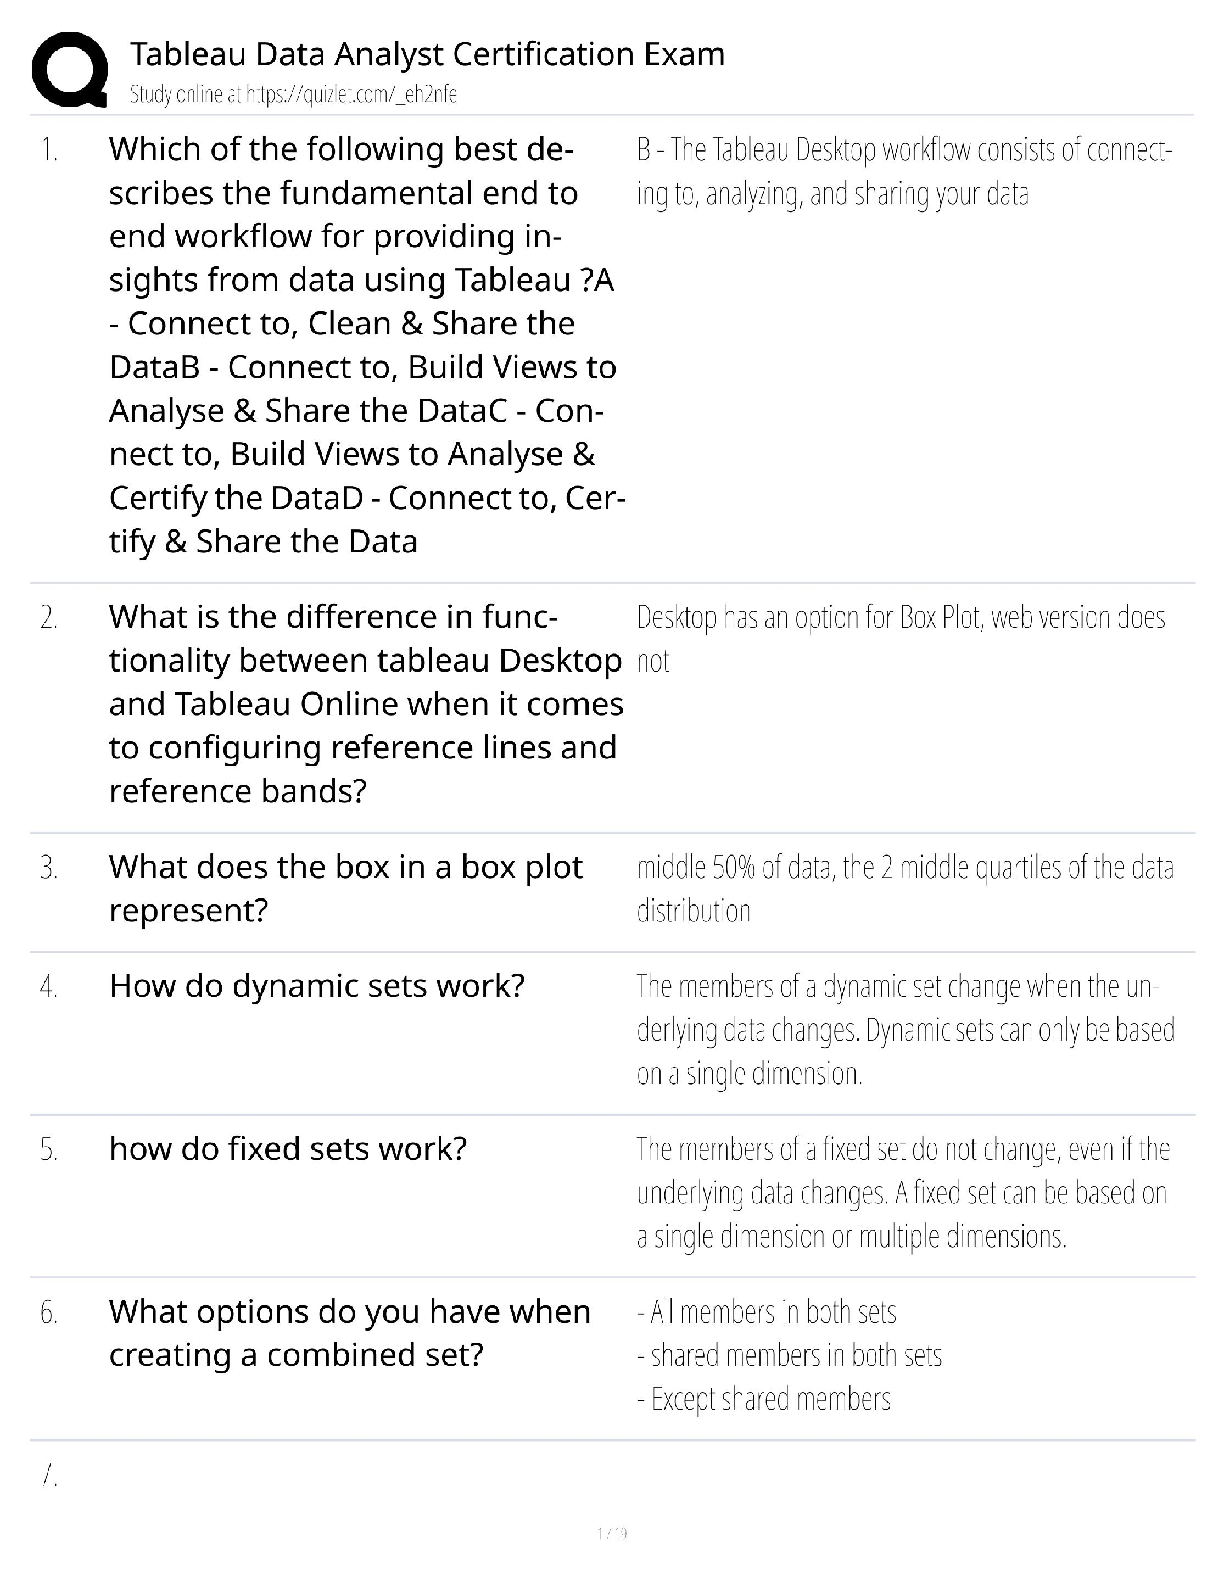
Tableau Data Analyst Certification / Exam Prep Guide / 2026 Up...
.png)