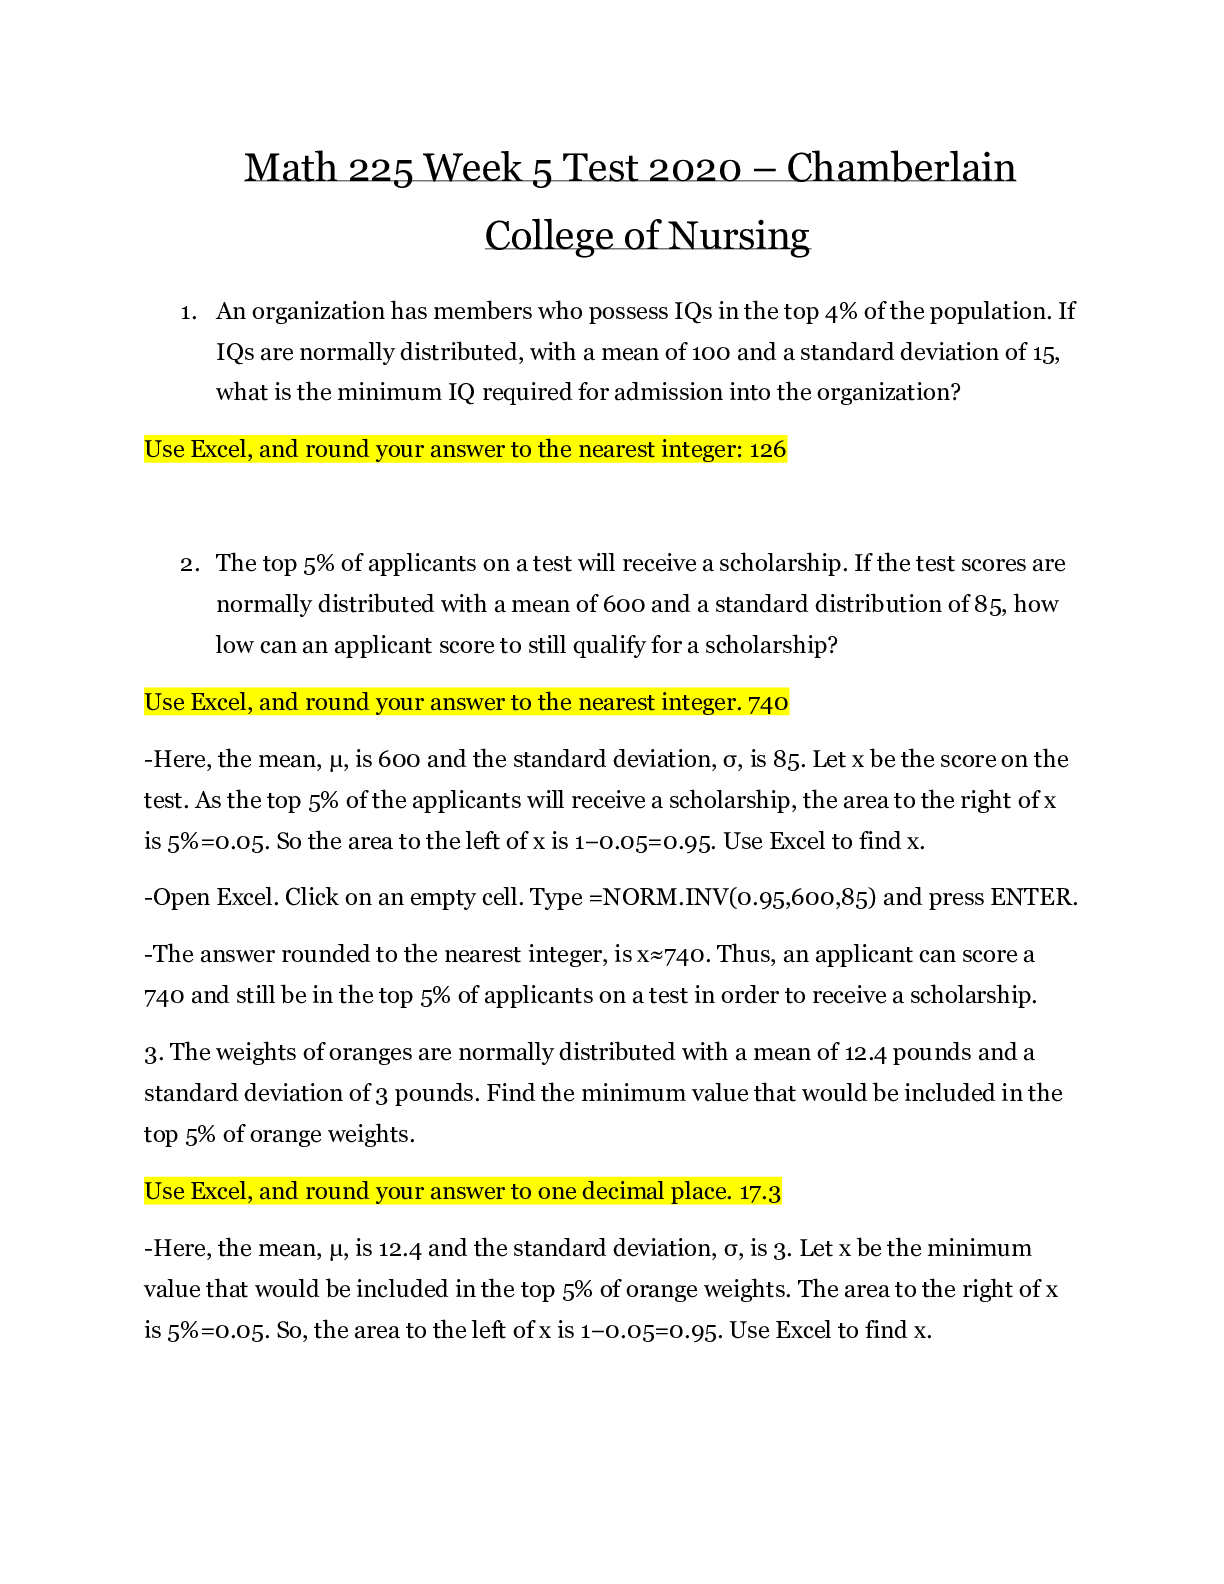
Math 225 Week 5 Test 2020 – Chamberlain College of Nursing
Math 225 Week 5 Test 2020
1. An organization has members who possess IQs in the top 4% of the population. If IQs are normally distributed, with a mean of 100 a
...
Math 225 Week 5 Test 2020 – Chamberlain College of Nursing
Math 225 Week 5 Test 2020
1. An organization has members who possess IQs in the top 4% of the population. If IQs are normally distributed, with a mean of 100 and a standard deviation of 15, what is the minimum IQ required for admission into the organization?
2. The top 5% of applicants on a test will receive a scholarship. If the test scores are normally distributed with a mean of 600 and a standard distribution of 85, how low can an applicant score to still qualify for a scholarship?
-Here, the mean, μ, is 600 and the standard deviation, σ, is 85. Let x be the score on the test. As the top 5% of the applicants will receive a scholarship, the area to the right of x is 5%=0.05. So the area to the left of x is 1−0.05=0.95. Use Excel to find x.
-Open Excel. Click on an empty cell. Type =NORM.INV(0.95,600,85) and press ENTER.
-The answer rounded to the nearest integer, is x≈740. Thus, an applicant can score a 740 and still be in the top 5% of applicants on a test in order to receive a scholarship.
3. The weights of oranges are normally distributed with a mean of 12.4 pounds and a standard deviation of 3 pounds. Find the minimum value that would be included in the top 5% of orange weights.
-Here, the mean, μ, is 12.4 and the standard deviation, σ, is 3. Let x be the minimum value that would be included in the top 5% of orange weights. The area to the right of x is 5%=0.05. So, the area to the left of x is 1−0.05=0.95. Use Excel to find x.
-1. Open Excel. Click on an empty cell. Type =NORM.INV(0.95,12.4,3) and press ENTER.
-The answer, rounded to one decimal place, is x≈17.3. Thus, the minimum value that would be included in the top 5% of orange weights is 17.3 pounds
4. Two thousand students took an exam. The scores on the exam have an approximate normal distribution with a mean of μ=81 points and a standard deviation of σ=4 points. The middle 50% of the exam scores are between what two values?
The probability to the left of x1 is 0.25. Use Excel to find x1.
1. Open Excel. Click on an empty cell. Type =NORM.INV(0.25,81,4) and press ENTER.
Rounding to the nearest integer, x1≈78. The probability to the left of x2 is 0.25+0.50=0.75. Use Excel to find x2.
1. Open Excel. Click on an empty cell. Type =NORM.INV(0.75,81,4) and press ENTER.
Rounding to the nearest integer, x2≈84. Thus, the middle 50% of the exam scores are between 78 and 84.
5. The number of walnuts in a mass-produced bag is modeled by a normal distribution with a mean of 44 and a standard deviation of 5. Find the number of walnuts in a bag that has more walnuts than 80% of the other bags.
Here, the mean, μ, is 44 and the standard deviation, σ, is 5. Let x be the number of walnuts in the bag. The area to the left of x is 80%=0.80. Use Excel to find x.
1. Open Excel. Click on an empty cell. Type =NORM.INV(0.80,44,5) and press ENTER.
The answer, rounded to the nearest integer, is x≈48. Thus, there are 48 walnuts in a bag that has more walnuts than 80% of the other bags.
6. A firm’s marketing manager believes that total sales for next year will follow the normal distribution, with a mean of $3.2 million and a standard deviation of $250,000. Determine the sales level that has only a 3% chance of being exceeded next year.
Here, the mean, μ, is 3.2 million =3,200,000 and the standard deviation, σ, is 250,000. Let x be sales for next year. To determine the sales level that has only a 3% chance of being exceeded next year, the area to the right of x is 0.03. So the area to the left of x is 1−0.03=0.97. Use Excel to find x.
1. Open Excel. Click on an empty cell. Type =NORM.INV(0.97,3200000,250000) and press ENTER.
The answer, rounded to the nearest dollar, is x≈3,670,198. Thus, the sales level that has only a 3% chance of being exceeded next year is $3,670,198.
7. Suppose that the weight of navel oranges is normally distributed with a mean of μ=6 ounces and a standard deviation of σ=0.8 ounces. Find the weight below that one can find the lightest 90% of all navel oranges.
Here, the mean, μ, is 6 and the standard deviation, σ, is 0.8. The area to the left of x is 90%=0.90. Use Excel to find x.
1. Open Excel. Click on an empty cell. Type =NORM.INV(0.90,6,0.8) and press ENTER.
The answer, rounded to two decimal places, is x≈7.03. Thus, navel oranges that weigh less than 7.03 ounces compose the lightest 90% of all navel oranges.
8. A tire company finds the lifespan for one brand of its tires is normally distributed with a mean of 47,500 miles and a standard deviation of 3,000 miles. What mileage would correspond to the the highest 3% of the tires?
Here, the mean, μ, is 47,500 and the standard deviation, σ, is 3,000. Let x be the minimum number of miles for a tire to be in the top 3%. The area to the right of x is 3%=0.03. So, the area to the left of x is 1−0.03=0.97. Use Excel to find x.
1. Open Excel. Click on an empty cell. Type =NORM.INV(0.97,47500,3000) and press ENTER.
The answer, rounded to the nearest integer, is x≈53,142. Thus, the approximate number of miles for the highest 3% of the tires is 53,142 miles.
-
-
-
-
-
-
-
-
-
-
-
-
-
-
-
-
-
-
-
-
-
-
-
-
-
-
-
-
-
-
-
-
-
27. Nick has collected data to find that the body weights of the forty students in a class has a normal distribution. What is the probability that a randomly selected student has a body weight of greater than 169 pounds if the mean is 142 pounds and the standard deviation is 9 pounds? Use the empirical rule.
Notice that 169 pounds is three standard deviations greater than the mean. Based on the Empirical Rule, 99.7% of the body weights are within three standard deviations of the mean. Since the normal distribution is symmetric, this implies that 0.15% of the body weights are greater than three standard deviation more than the mean.
The pink section represents the 68% of the data that lies within one standard deviation of the mean. This section is split in half, with 34% to the left of the mean and 34% to the right of the mean.
The smaller red sections (marked with 13.5%), along with the inner pink sections, represent the 95% of the data that lies within two standard deviations of the mean. (If we add the four sections together, we will get 95%: 13.5%+34%+34%+13.5%=95%.)
The small blue sections (marked with 2.35%), along with the four inner sections, represent the 99.7% of the data that lies within three standard deviations of the mean. (If we add the sections together, we will get 99.7%: 2.35%+13.5%+34%+34%+13.5%+2.35%=99.7%.)
*Remember: 50% of the data lie above the mean, and 50% of the data lie below the mean in normal distributions. So, if we have a normally distributed data set, with a mean of 10.5, then we can say that 50% of the data is less than 10.5 and 50% of the data is greater than 10.5.
28. The times to complete an obstacle course is normally distributed with mean 73 seconds and standard deviation 9 seconds. What is the probability using the Empirical Rule that a randomly selected finishing time is less than 100 seconds?
29. After collecting the data, Douglas finds that the finishing times for cyclists in a race is normally distributed with mean 149 minutes and standard deviation 16 minutes. What is the probability that a randomly selected race participant had a finishing time of less than 165 minutes? Use the empirical rule
30. Charles has collected data to find that the total snowfall per year in Reamstown has a normal distribution. Using the Empirical Rule, what is the probability that in a randomly selected year, the snowfall was less than 87 inches if the mean is 72 inches and the standard deviation is 15 inches?
31. Christopher has collected data to find that the total snowfall per year in Laytonville has a normal distribution. What is the probability that in a randomly selected year, the snowfall was greater than 53 inches if the mean is 92 inches and the standard deviation is 13 inches? Use the empirical rule
Notice that 53 inches is three standard deviations less than the mean. Based on the Empirical Rule, 99.7% of the yearly snowfalls are within three standard deviations of the mean. Since the normal distribution is symmetric, this implies that 0.15% of the yearly snowfalls are less than three standard deviations below the mean. Alternatively, 99.85% of the yearly snowfalls are greater than three standard deviations below the mean.
32. The times to complete an obstacle course is normally distributed with mean 87 seconds and standard deviation 7 seconds. What is the probability that a randomly selected finishing time is greater than 80 seconds? Use the empirical rule
33.
[Show More]


, 2e by Stephen Lovett.png)




 – Chamberlain College of Nursing.png)
 – Chamberlain College of Nursing.png)