Chapter 1: Functions, Graphs, and Limits
Larson, Calculus: An Applied Approach (+Brief), 9e Page 1
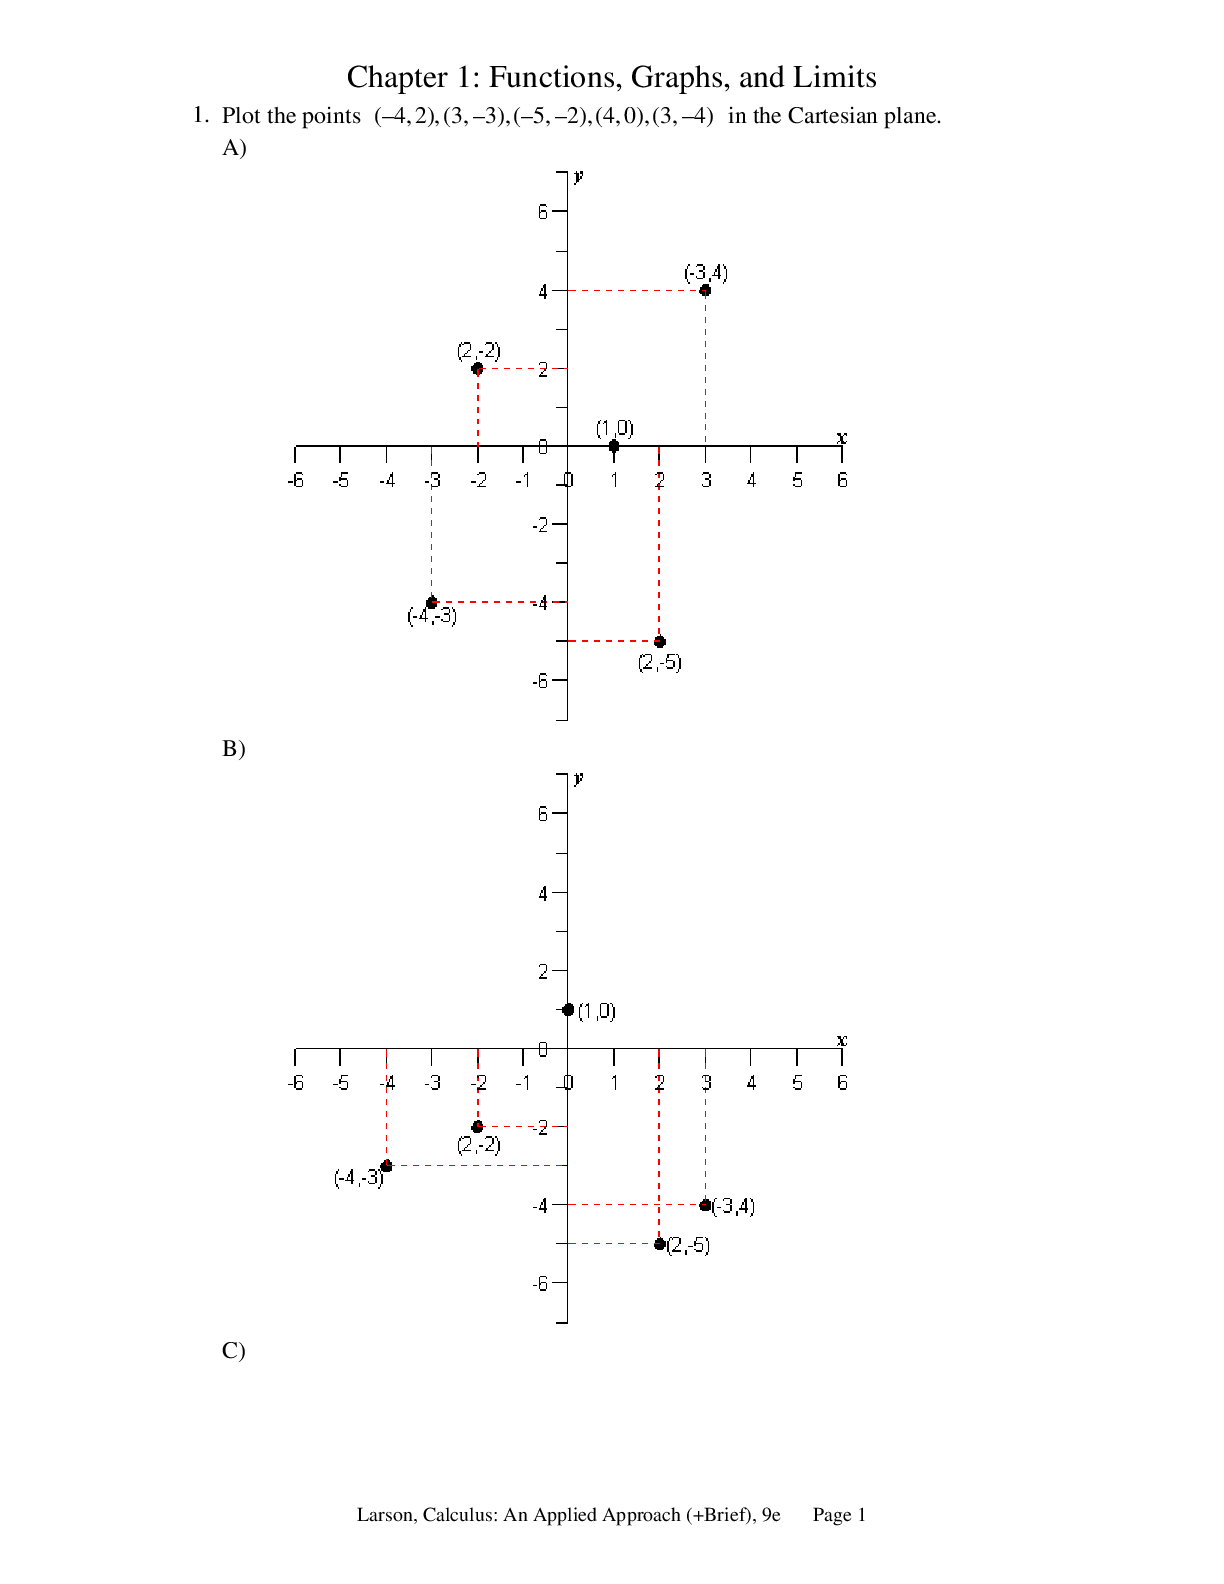
1. Plot the points (–4, 2),(3, –3),(–5, –2),(4,0),(3, –4) in the Cartesian plane.
A)
B)
C)
Larson, Calculus: An App
...
Chapter 1: Functions, Graphs, and Limits
Larson, Calculus: An Applied Approach (+Brief), 9e Page 1
1. Plot the points (–4, 2),(3, –3),(–5, –2),(4,0),(3, –4) in the Cartesian plane.
A)
B)
C)
Larson, Calculus: An Applied Approach, 9e Page 2
D)
E)
Larson, Calculus: An Applied Approach, 9e Page 3
Ans: C
2. Find the distance between the points (3, 4) and (7,7) . Round your answer to the
nearest hundredth.
A) 25.00
B) 2.65
C) 5.00
D) 14.87
E) 4.58
Ans: C
3. Find the midpoint of the line segment joining the points (5,1) and (7,7) . Round your
answer to the nearest hundredth.
A) (12, 28)
B) (6, 4)
C) (–1, –3)
D) (3,7)
E) none of these choices
Ans: B
Larson, Calculus: An Applied Approach, 9e Page 4
4. Find the length of each side of the right triangle from the following figure.
A) a =15, b = 8, c =17
B) a =8, b =15, c =17
C) a = 17, b =–8, c =15
D) a =15, b =8, c =–17
E) a =15, b =15, c =17
Ans: A
5. Find x such that the distance between the points (5, 2) and ( ,8) x is 10.
A) x = 13 or x = –13
B) x = –3 or x = 3
C) x = 13 or x = –3
D) x = –11 or x = 11
E) x = 15 or x = –15
Ans: C
Larson, Calculus: An Applied Approach, 9e Page 5
6. Assume that the number (in millions) of basic cable television subscribers in the United
States from 1996 through 2005 is given in the following table. Use a graphing utility to
graph a scatter plot of the given data. Describe any trends that appear within the last
four years.
Year 1996 1997 1998 1999 2000 2001 2002 2003 2004 2
Subscribers 62.3 63.6 64.7 65.5 66.3 66.7 66.5 66.0 65.7 6
A)
The number of subscribers appears to be increasing.
B)
The number of subscribers appears to be decreasing.
C)
Larson, Calculus: An Applied Approach, 9e Page 6
The number of subscribers appears to be linearly
decreasing.
D)
The number of subscribers appears to be decreasing.
E)
Larson, Calculus: An Applied Approach, 9e Page 7
The number of subscribers appears to be linearly
increasing.
Ans: B
Larson, Calculus: An Applied Approach, 9e Page 8
7. Assume that the number (in millions) of cellular telephone subscribers in the United
States from 1996 through 2005 is given in the following table. Use a graphing utility to
graph a line plot of the given data. Describe any trends that appear within the last four
years.
Year 1996 1997 1998 1999 2000 2001 2002 2003 2004 2005
Subscribers 200.5 195.1 192.9 185.3 146.6 125.6 102.5 76.7 65.9 57.3
A)
The number of subscribers appears to be decreasing.
B)
The number of subscribers appears to be increasing.
C)
Larson, Calculus: An Applied Approach, 9e Page 9
The number of subscribers appears to be constant.
D)
The number of subscribers appears to be decreasing.
E)
Larson, Calculus: An Applied Approach, 9e Page 10
The number of subscribers appears to be increasing linearly.
Ans: A
Larson, Calculus: An Applied Approach, 9e Page 11
8. Assume that the median sales prices of existing one family homes sold (in thousands of
dollars) in the United States from 1990 through 2005 are as given in the following
figure. Use the following figure to estimate the percent increase in the value of existing
one-family homes from 1997 to 1998.
A) 0.021%
B) 0.058%
C) 2.06%
D) 55.5%
E) 5.8%
Ans: E
9. Use the Midpoint Formula repeatedly to find the three points that divide the segment
joining ( x y 1, 1 ) and ( x y 2, 2 )into four equal parts.
A) 1 2 1 2 1 21 2 1 21 2 3 3 3 3 , ,, , , 2 2 44 4 4
xx y y xxy y x xy y + + ++ + +
B) 1 2 1 2 1 21 2 1 21 2 3 3 3 3 , ,, , , 4 4 22 4 4
xx y y xxy y x xy y + + ++ + +
C) 1 21 2 1 21 2 1 21 2 3 33 33 ,, , , , 22 4 4 4 4
xxy y x xy y x xy y ++ + + + +
1 21 2 1 21 2 1 21 2 3 3 3 ,, , ,, 2 2 4 4 44
xxy y x xy y xxy y ++ + + ++
D) 1 21 2 1 21 2 1 21 2 3 4 44 44 , ,, ,, 22 44 44
xxy y x xy y x xy y ++ + + + +
E) 1 21 2 1 21 2 1 21 2 , ,, ,, 42 42 24
xxy y xxy y xxy y ++ ++ ++
Ans: B
Larson, Calculus: An Applied Approach, 9e Page 12
10. The red figure is translated to a new position in the plane to form the blue figure. Find
the vertices of the transformed figure from the following graph. (In case your exam is
printed in black and white - the red figure has one vertex at (0,0)).
A) (–2,0),(–3, 2),(1,0)
B) (–2,0),(–3, 2),(0,1)
C) (–2,0),(–3,1),(0,1)
D) (–2, –3),(–3, 2),(0,0)
E) (–2,0),(–3,0),(0,1)
Ans: B
Larson, Calculus: An Applied Approach, 9e Page 13
[Show More]