Mathematics > QUESTIONS & ANSWERS > MATH 225N Week 8 Discussion|MATH225N Week 8 Discussion: Correlation and Regression, (Answered) (All)
MATH 225N Week 8 Discussion|MATH225N Week 8 Discussion: Correlation and Regression, (Answered)
Document Content and Description Below
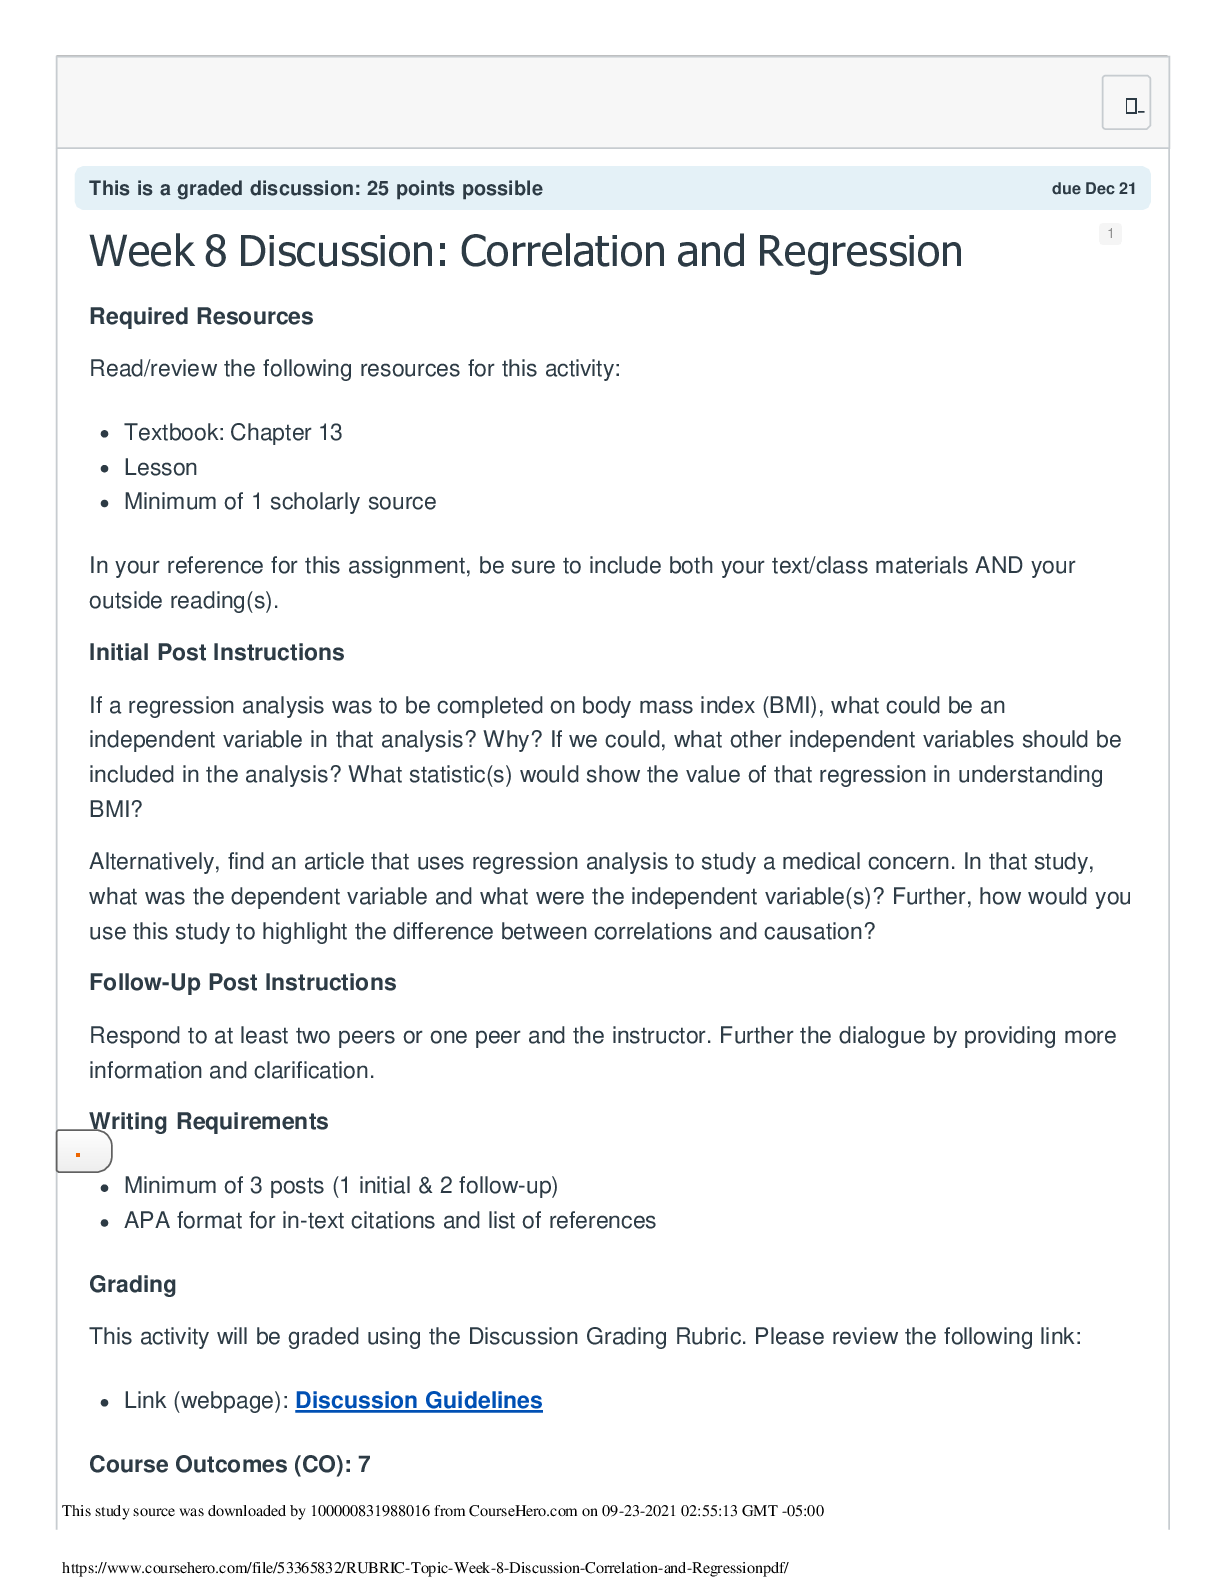
If a regression analysis was to be completed on body mass index (BMI), what could be an independent variable in that analysis? Why? If we could, what other independent variables should be included i... n the analysis? What statistic(s) would show the value of that regression in understanding BMI? Alternatively, find an article that uses regression analysis to study a medical concern. In that study, what was the dependent variable and what were the independent variable(s)? Further, how would you use this study to highlight the difference between correlations and causation? Answer & Explanation Solved by verified expert Attached answer Step-by-step explanation the body mass index (BMI) of women which is the measure of weight relative to height is recoreded to know the people with overweight and obese. The formula is BMI = kg/m2 where kg is a person's weight in kilograms and m2 is their height in metres squared. People with high BMI are considered to be overweight and obese. Dependent variable: Body mass index (BMI) Independent variable: Duration of physical activity (in minutes), Consumption of particular kind of foods. The correlation coefficient between dependent and independent variable shows the relationship between these two variable(In regression analysis r2 value is obtained where r is the correlation coefficient). The correlation coefficient tells the association between variables while the causation explains these association. The causation can be identified by the experiment when one independent variable changes while holding other variable constant. (Multiple regression analysis of airway responsiveness in adult asthmatic patients K Tomita et al. J Asthma. 1998.) multiple regression analysis could be used to find out if there is an actual association between smokers in the household and air pollution and how often patients have an asthma attack. dependent variable- number of inhalers purchased in a time period independent variables - air pollution and presence of a smoker in the house collect data from asthmatic patients about the number of inhalers purchased and find out if any member of their household smokes. We would also collect data about the air quality in the neighborhood where each patient lives. A statistical program, such as SPSS or R would be used to plot a relationship among these three variables. [Show More]
Last updated: 2 years ago
Preview 1 out of 2 pages

Buy this document to get the full access instantly
Instant Download Access after purchase
Buy NowInstant download
We Accept:

Reviews( 0 )
$8.00
Can't find what you want? Try our AI powered Search
Document information
Connected school, study & course
About the document
Uploaded On
Sep 24, 2021
Number of pages
2
Written in

Additional information
This document has been written for:
Uploaded
Sep 24, 2021
Downloads
0
Views
127
.png)