On a recent news report, Taylor heard that, on average, most Americans get six hours of
sleep each night. The report continued by stating that in Taylor's state, Minnesota, residents were actually getting an average of
...
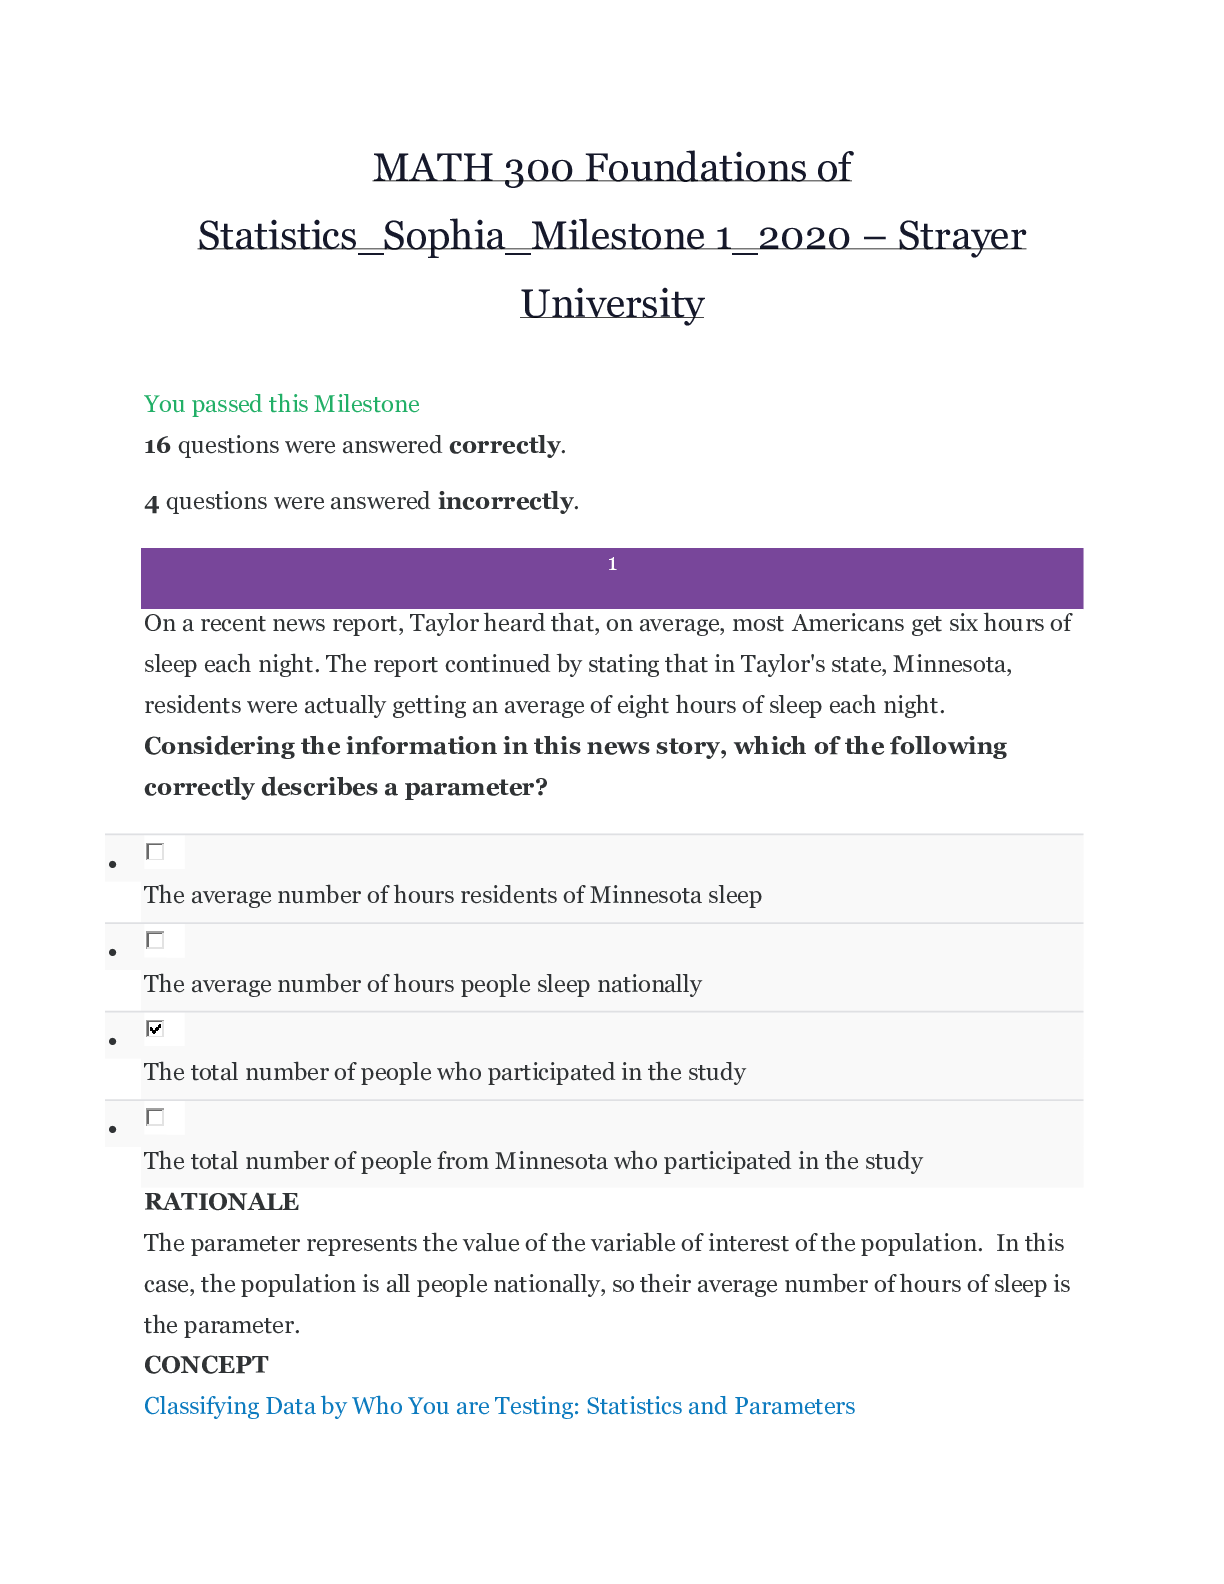
On a recent news report, Taylor heard that, on average, most Americans get six hours of
sleep each night. The report continued by stating that in Taylor's state, Minnesota, residents were actually getting an average of eight hours of sleep each night.
Considering the information in this news story, which of the following correctly describes a parameter?
•
The average number of hours residents of Minnesota sleep
•
The average number of hours people sleep nationally
•
The total number of people who participated in the study
•
The total number of people from Minnesota who participated in the study
A new shop owner has a store 0.5 miles from where it is advertised. She read that it
takes the average adult 8 minutes to walk a half mile. She decides to test this and wants to obtain a random sample of 200 adults.
Which of the following would be her hypothesis?
•
The time to walk a half mile is 8 minutes.
•
Most adults will not walk the half mile to her store.
•
The time to walk a half mile is greater than 8 minutes.
•
The time to walk a half mile is less than 8 minutes.
You want to figure out if the amount of sleep you get at night helps increase the grade
you get on an exam the following day. You decide to record how many hours of sleep you and your friends got before an exam along with the grade you received on that exam. You then plot the results on a scatterplot and find that as the number of hours of sleep goes up, so do the exam grades. You then conclude that increased sleep causes higher exam scores.
Is your conclusion necessarily true?
No, because the apparent correlation between sleep and exam scores might be caused by
another variable.
•
Yes, because sleep and exam scores are highly correlated.
•
Yes, because as the number of hours of sleep increases, so do exam scores.
•
No, because the number of hours of sleep and exam scores are not necessarily
correlated.
As project manager for an online-course design company, Rachel had data that applied
to several different course-development methods. When the company began preparing the next course set, Rachel was interested in how development time varied with each method.
Determine which graph would have the largest standard deviation.
Derek recently started a new diet and exercise program. He was curious to know what
exercise would help him burn the greatest amount of calories. He asked his friend Mike, who is a personal trainer, for help. During each exercise, Mike recorded the time Derek spent doing an exercise while Derek kept his intensity relatively constant, and they tracked how many calories each exercise burned.
Derek and Mike are in effect performing an experiment that contains explanatory and response variables. Which statement best describes the explanatory and response variables involved in this experiment?
•
Calories burnt is the explanatory variable and exercise is the response variable, because
the calories burnt manipulates the type of exercise.
•
Exercise type is the explanatory variable and calories burnt is the response variable,
since each exercise causes Derek to burn calories differently.
•
Exercise type is the response variable and calories burnt is the explanatory variable,
since different exercises will cause more calories to be burnt.
•
Calories burnt is the response variable and exercise type is the explanatory variable,
because Mike measures exercises as he records calories burnt.
In a normal distribution, which statement best describes the relationship
between mean, median, and mode?
•
The mean will always be the smallest value, while the mode and median will be the
same.
•
The mean and median will fall in the center of the distribution and the mode will be
larger than both.
•
The mean, median, and mode always are equal to one another and lie in the center of
the distribution.
•
The mode will be in the center of the distribution and the mean and median may be
higher or lower.
The data on this graph represents the number of sales for several types of vehicles in
2015.
Which vehicle represents the mode?
•
458 Spider
•
Enzo
•
F12berlinetta
•
Ferrari FF
The following data set shows the blood sugar levels (in mg/dL) in a group of 9 patients
about to undergo a study of a new drug.
What is the interquartile range for this data?
•
19
•
22
•
11
•
14
Mike was the director of admissions at a university. He wanted to learn more about the
gender of applicants, what majors were most popular, and the age groups of learners applying to the university.
Mike wants to create either a bar graph or a histogram for his data. For what data would the histogram be the best way to represent Mike's information?
•
All of the data is best graphed using a histogram
Given the following graph of a skewed distribution, which answer choice best represents how the mean, median, and mode are related?
•
The median is the largest, followed by the mode, and then the mean.
•
The mode is the largest, followed by the mean, and then the median.
•
The mean is the smallest, followed by the median, and then the mode.
•
The median is the smallest, followed by the mode, and then the mean.
If the sum of squares for a sample containing 51 items equals 200, what is
the standard deviation?
•
1.98
•
3.92
•
4.00
•
2.00
Kelly designed a new course in statistics and was getting ready to determine how well the course would be received by potential learners. Kelly hoped to gain data on how difficult or easy the course was, as well as how much learners enjoyed the course experience. To get this information, Kelly gathered a few groups of different learners and began her initial tests.
Which of the following is an example of participation bias?
All participants in the initial test had to give responses to survey questions before their
data was evaluated.
•
The learners in the initial test have the ability to respond or not respond on surveys
related to the course.
Which statement best describes the strength, direction, and correlation
coefficient of the scatter plot shown here?
•
The strength is strong, the direction is negative, and the correlation coefficient is close to
1.
•
The strength is weak, the direction is positive, and the correlation coefficient is close to
0.
•
The strength is strong, the direction is negative, and the correlation coefficient is close to
0.
•
The strength is strong, the direction is positive, and the correlation coefficient is close to
1
The data set below represents the heights (in inches) of students in a particular high
school class:
What is the range of the data set?
•
18 inches
•
74 inches
•
19 inches
•
21 inches
Michael checked several car dealerships around town for the make and model he wanted
to purchase. He received eight different quotes:
What is the mode of the data set?
•
$25,716
•
$26,105
•
$26,780
•
$24,500
Which statement explains what the slope tells you about the variables in this graph?
The graph shows that for each year of drug abuse life expectancy went up.
•
The graph shows that there is a positive relationship between life expectancy and years
of drug abuse.
Because her current cable provider wasn't providing the service she desired, Gwen
decided to change companies.
Gwen made a hypothesis as to the outcome of using a new cable provider. Which of the following is the null hypothesis?
•
There is no difference between the level of service provided by either company.
•
The new company will be better than the old company.
•
The new company will be worse than the old company.
•
The new company may be better or worse than the old company.
Distributions may be normal or they may be skewed to the left or the right.
Which of the following graphs is an example of a left-skewed distribution?
This graph shows the frequency of common mechanical issues with 1969 Camaros.
What type of data does this graph represent?
•
Ordinal
•
Interval
•
Ratio
•
Nominal
Two drains in Bill's house were clogged. After considering the selection of drain cleaners at the hardware store, Bill chose a brand that claimed to be effective with just one use.
Back at home, Bill eventually had to use the cleaner three times before the drains cleared, but he was still satisfied with the product.
Which of the following correctly describes the sample?
•
The products Bill chose
•
The number of times it takes for Bill's drains to unclog
•
The number of drains the product's manufacturer tested
•
All of the different types of drain cleaning products
[Show More]


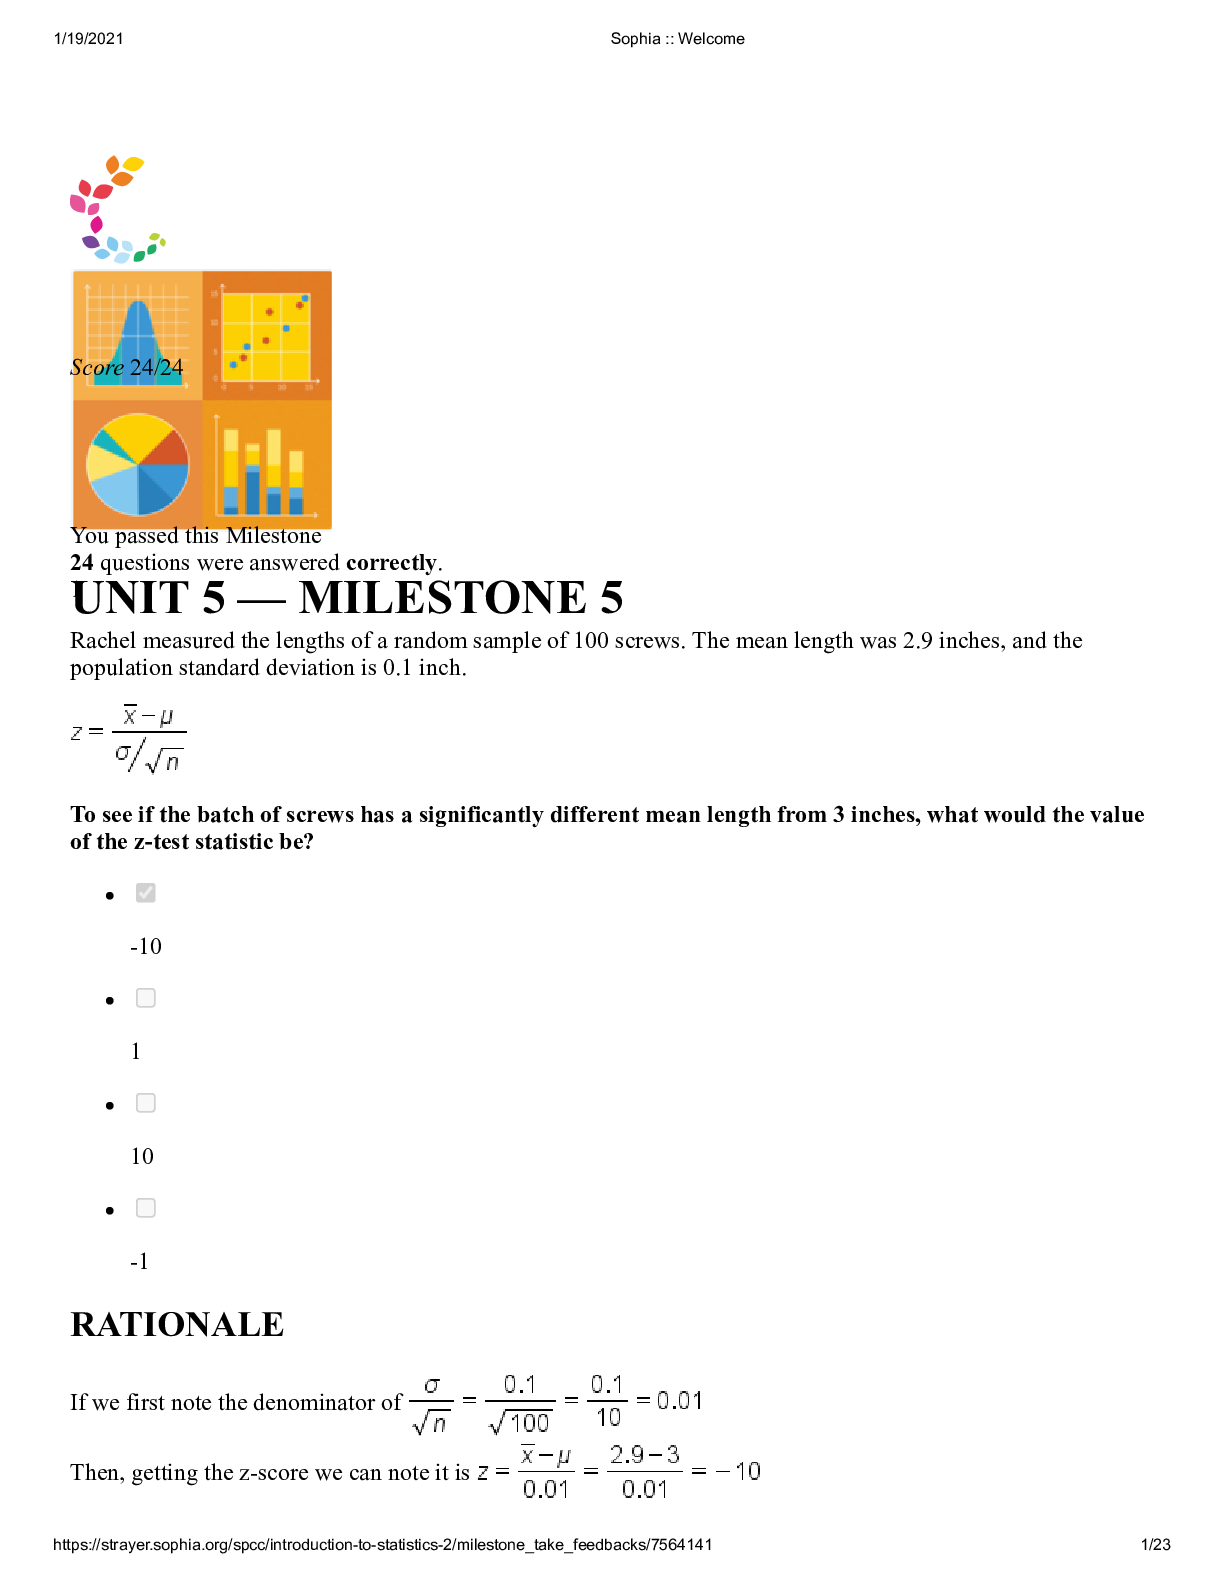


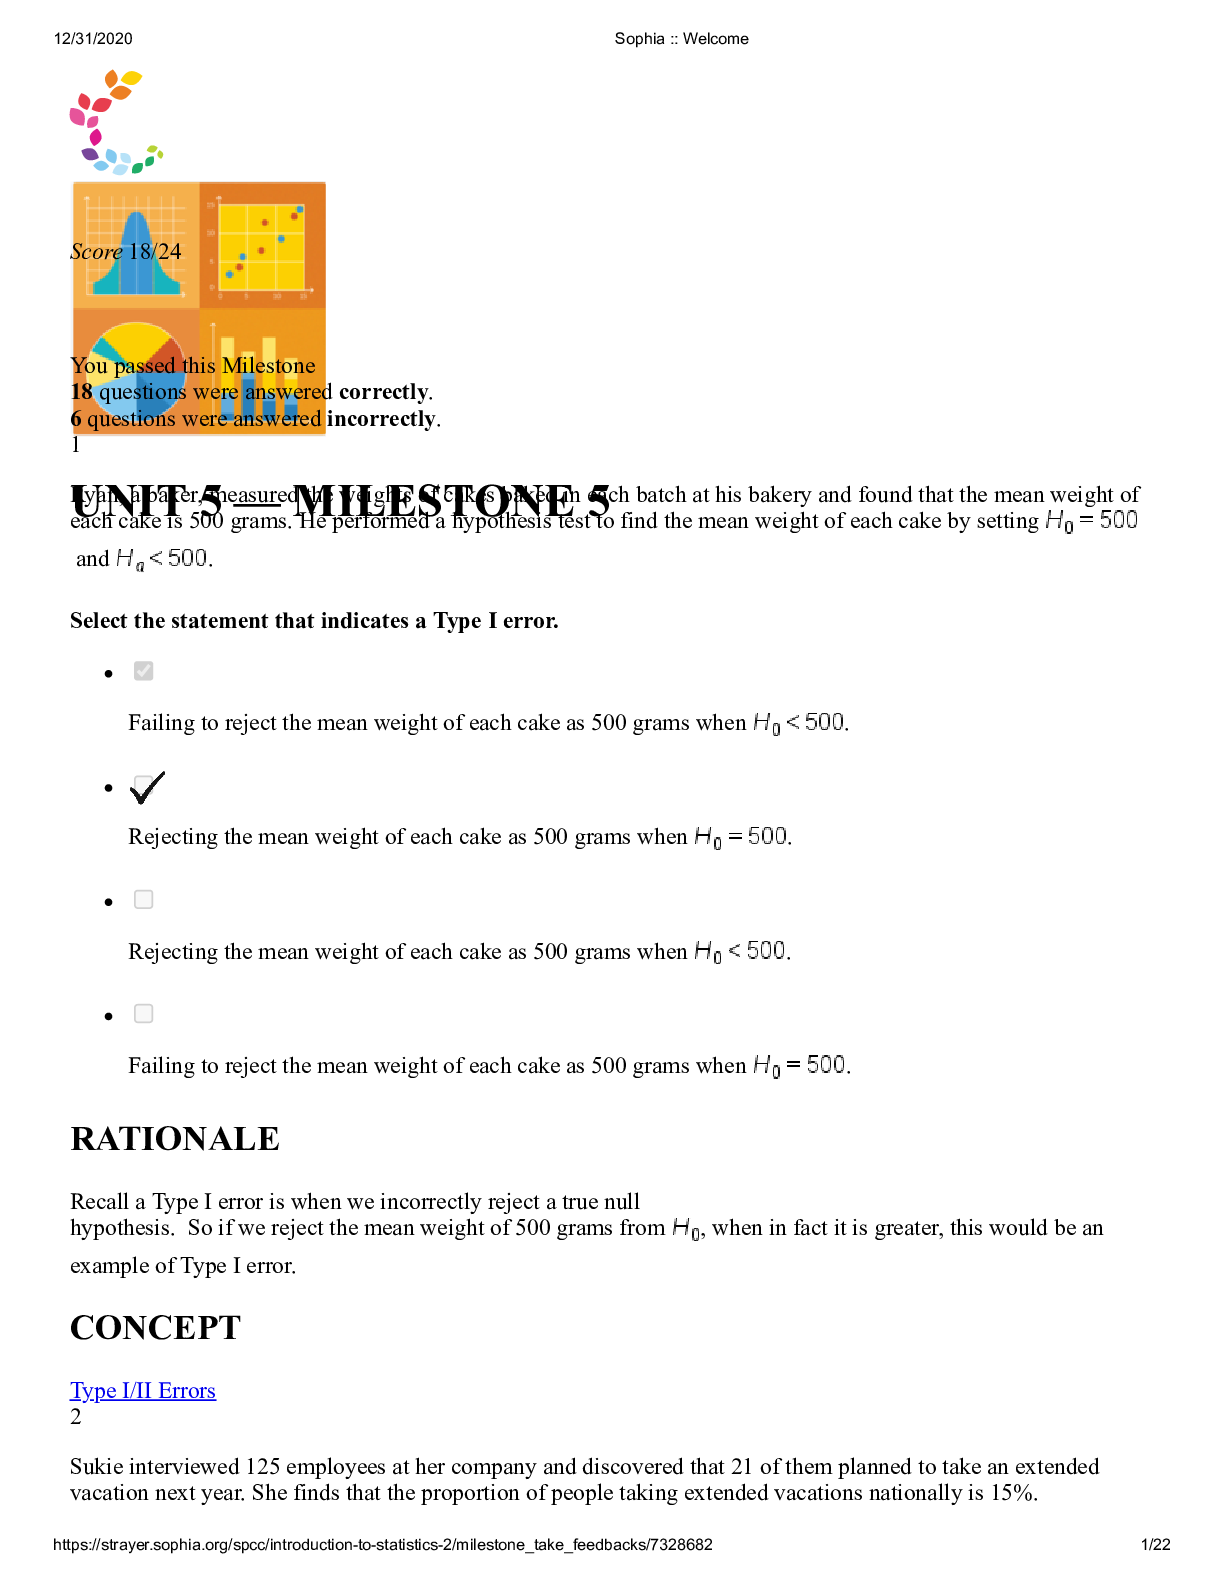
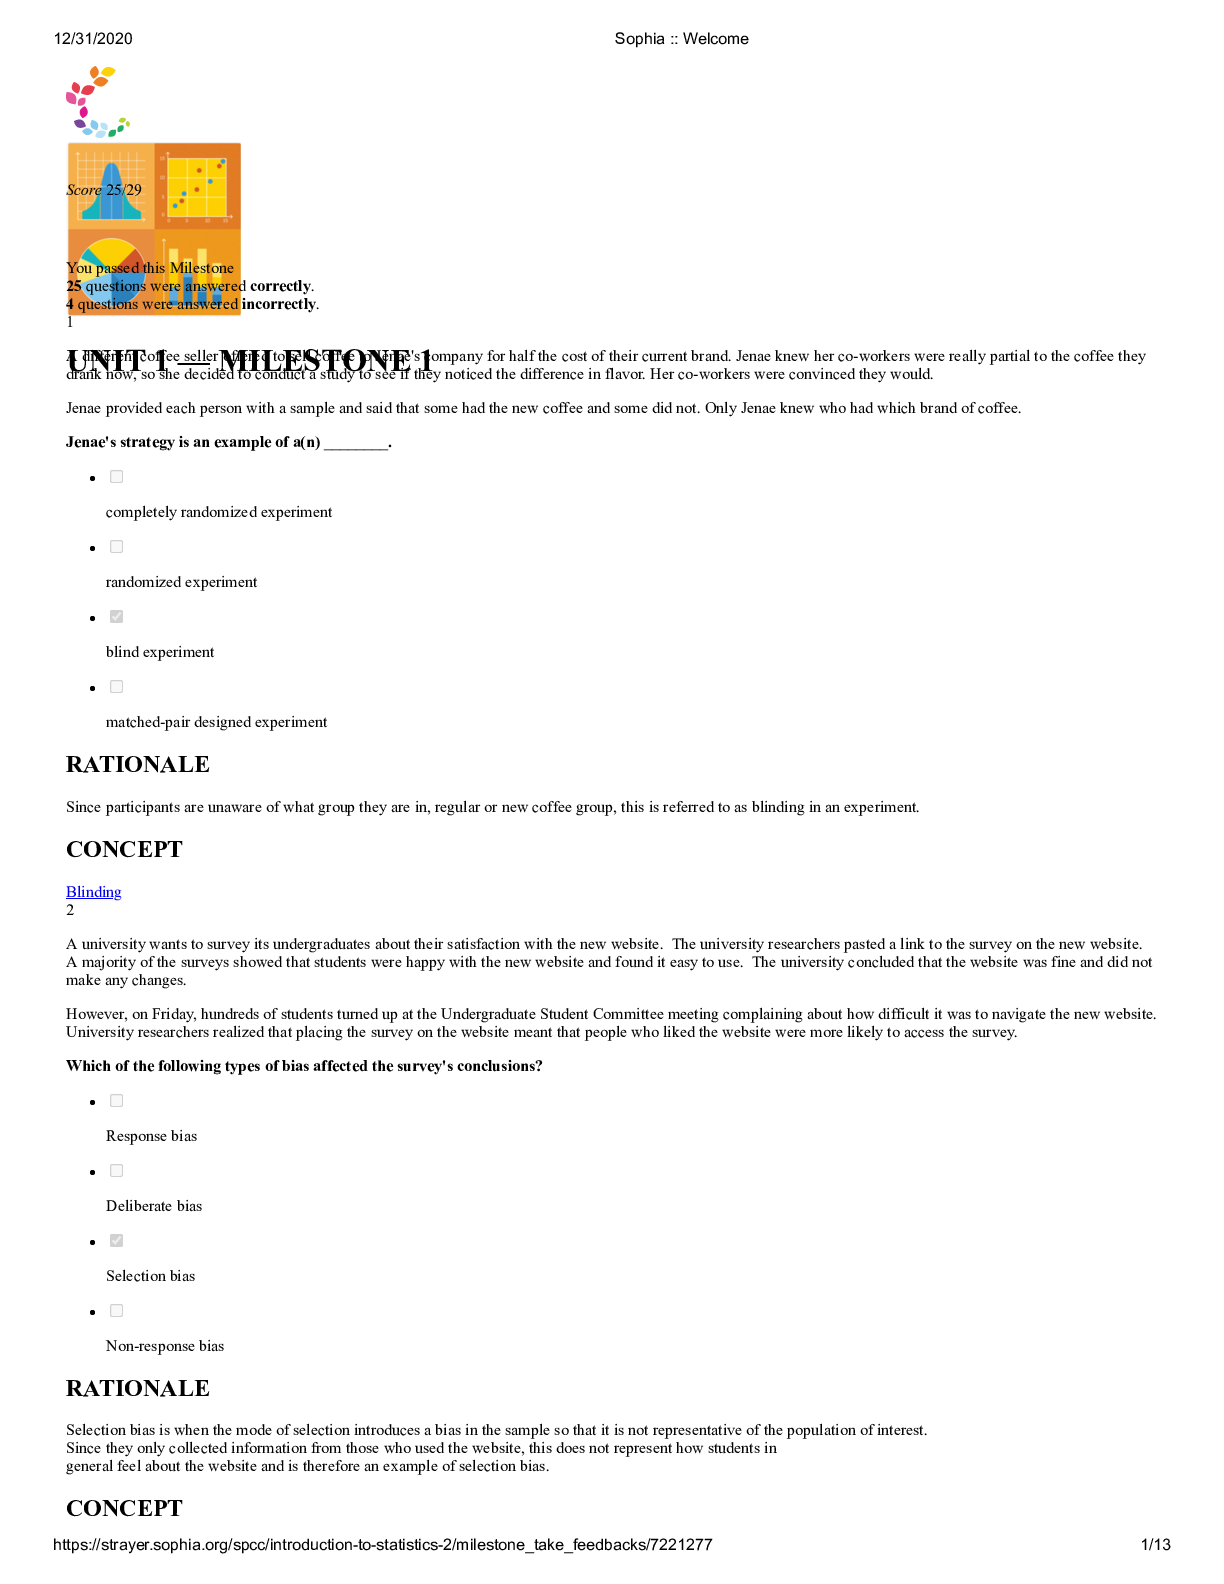
![Preview of Mathematics for Elementary School Teachers 7th Edition By Tom Bassarear eBook [PDF]](https://scholarfriends.com/storage/XDAvz7U32025-01-07-10-18677d7dff7b246.png)


![Preview of eBook [PDF] A Geometrical Approach to Physics 1st Edition By David A. Burton, Adam Noble](https://browseimages.nyc3.digitaloceanspaces.com/paper-images/2024/Aug/31/cXokIxHU2024-08-31-02-2466d2fd53aa26d.png)