Statistics > QUESTIONS & ANSWERS > MATH 225N WEEK 4 QUIZ. Chamberlain College of Nursing (All)
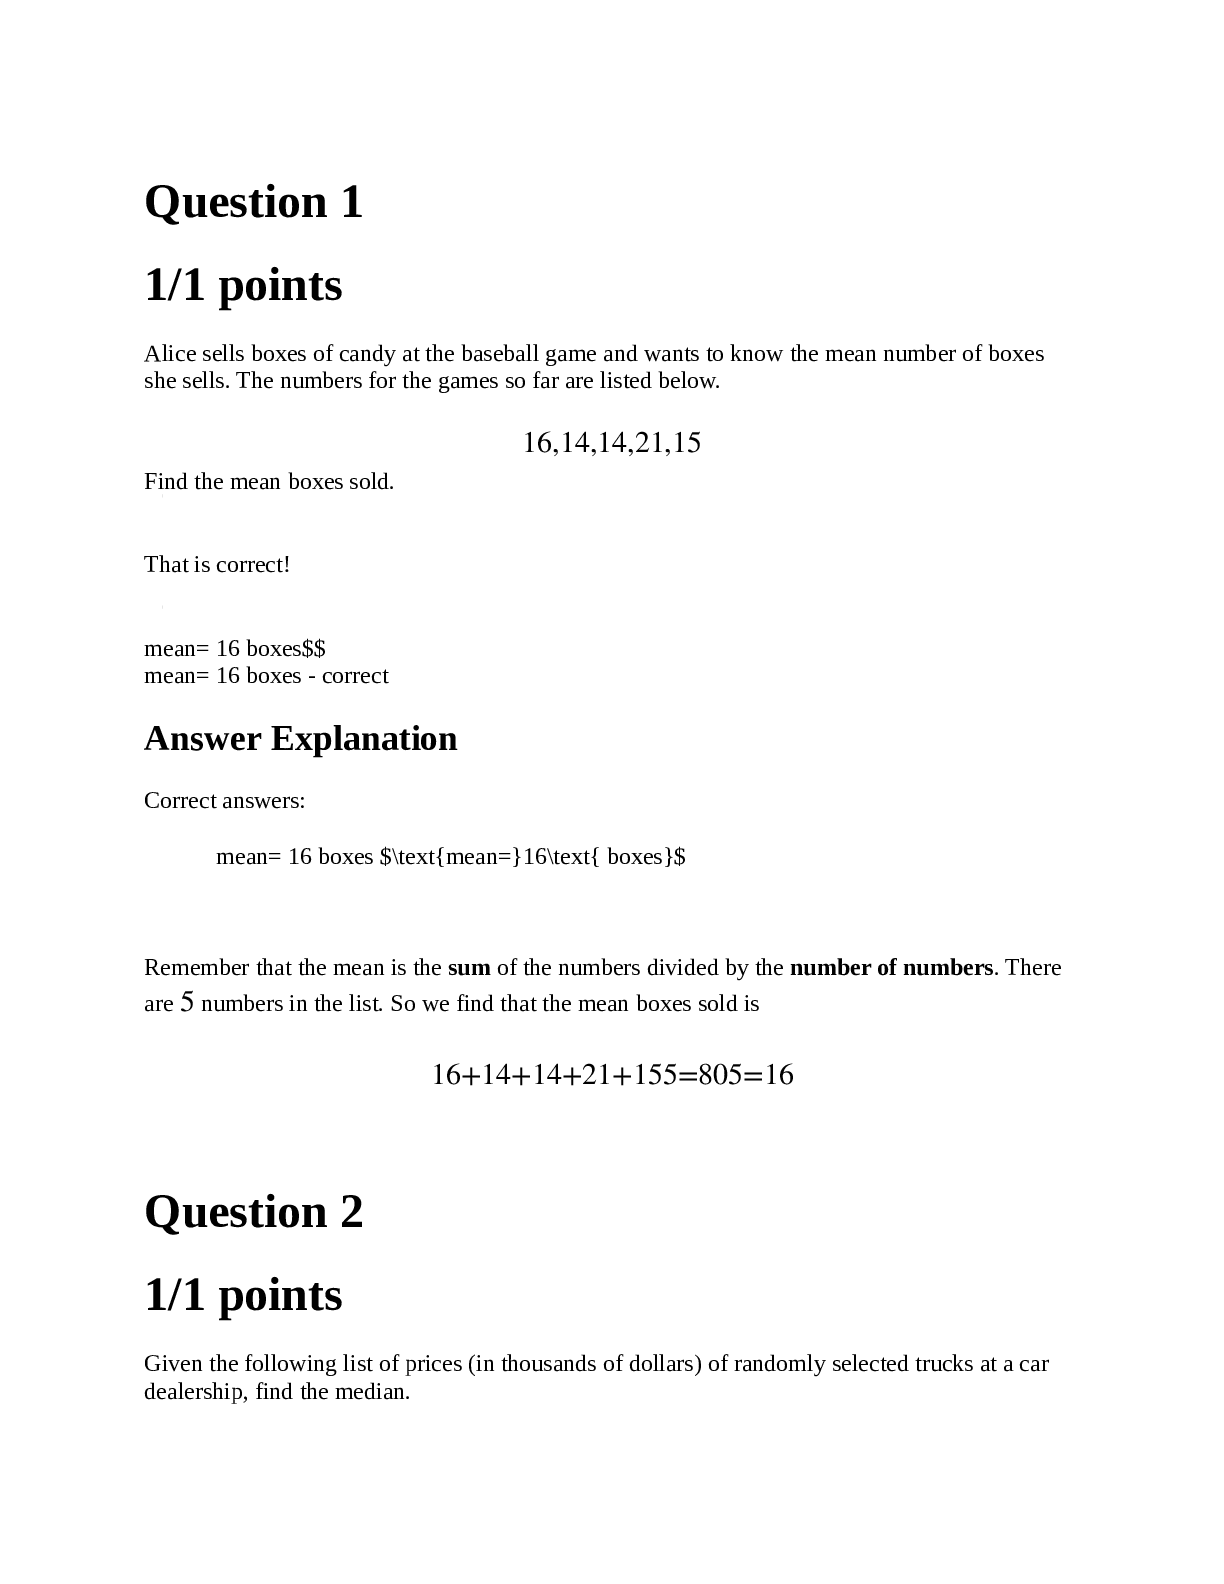
MATH 225N WEEK 4 QUIZ. Chamberlain College of Nursing
Document Content and Description Below
Last updated: 2 years ago
Preview 1 out of 22 pages
Instant download
Buy this Document to get the Full Access Instantly
Provided by Students Who Aced it
We Verify Document Content to Gurantee Accuracy
Reviews( 0 )
Document information
Connected school, study & course
About the document
Uploaded On
Oct 15, 2020
Number of pages
22
Written in
All

Additional information
This document has been written for:
Uploaded
Oct 15, 2020
Downloads
1
Views
482
Topic Tags
Recommended For You
Get more on QUESTIONS & ANSWERS »
Math 225N Week 4 Statistics Quiz Already Passed | Chamberlain...

Chamberlain College of Nursing Week 5 Math 225N Statistics Qui...
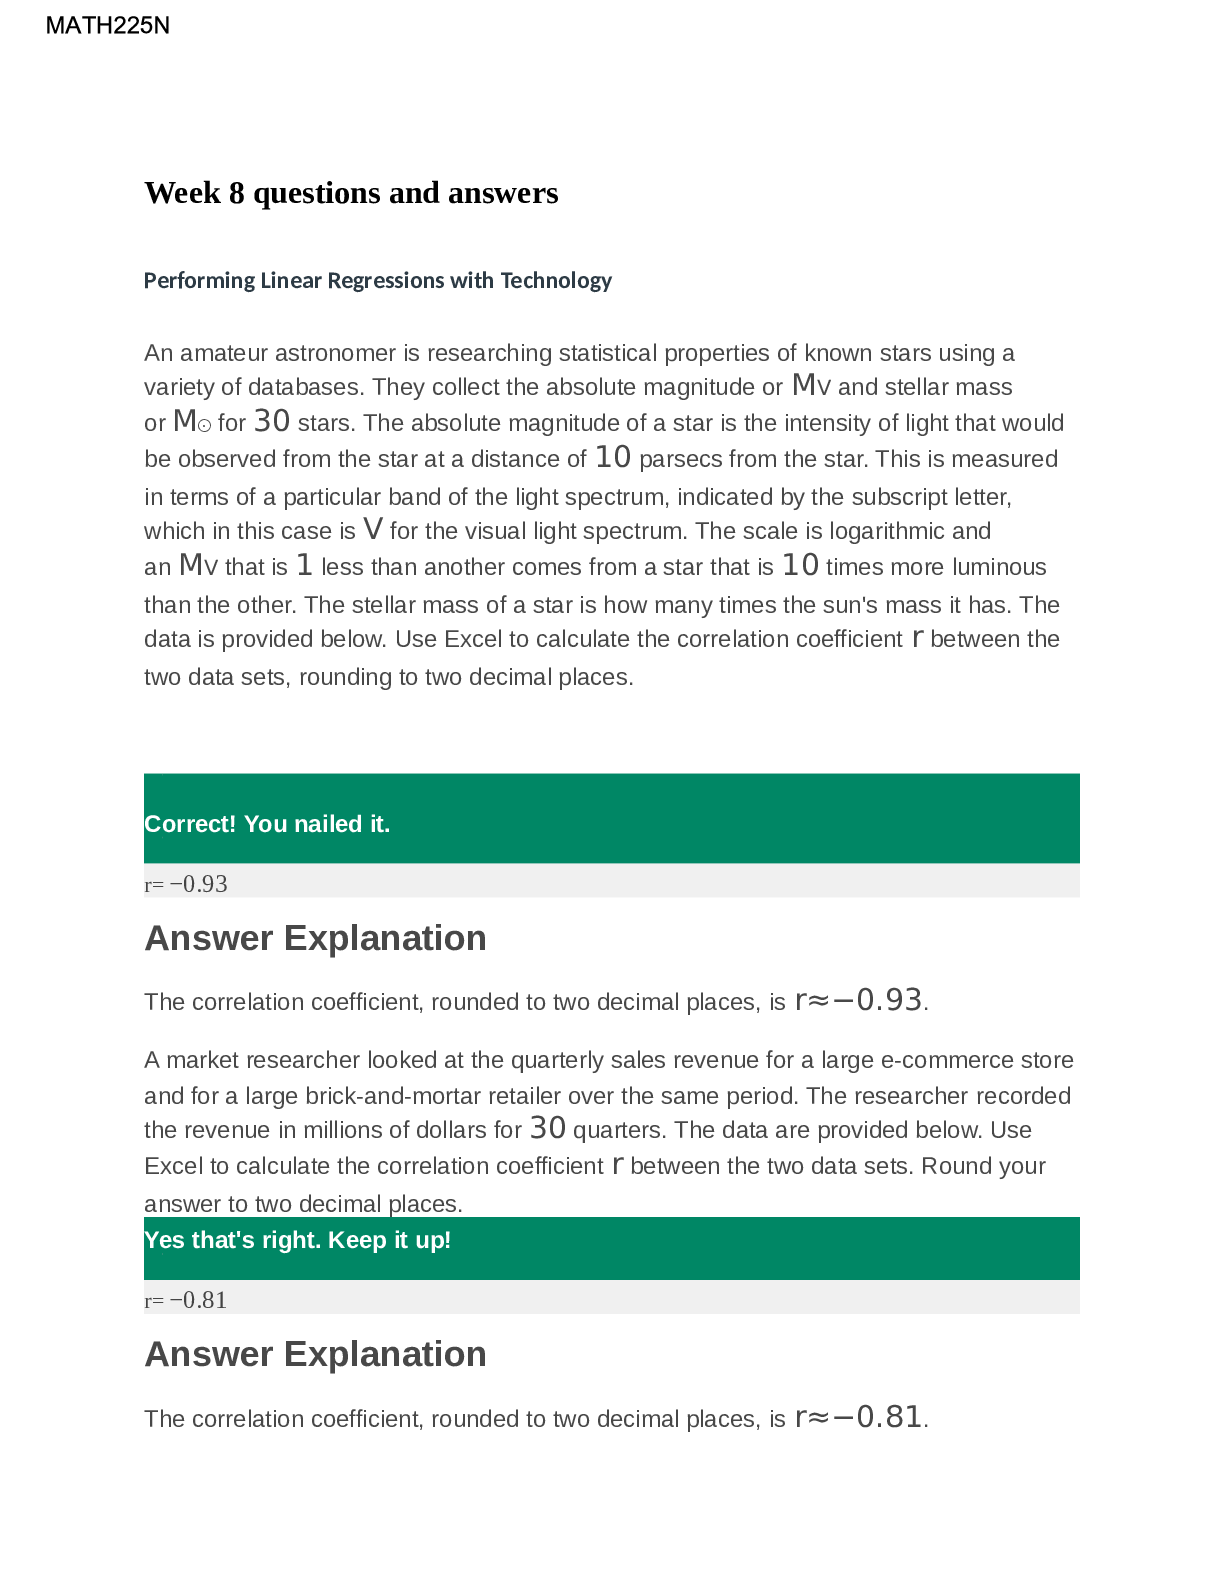
Chamberlain College of Nursing MATH225N Week 8 Questions and A...

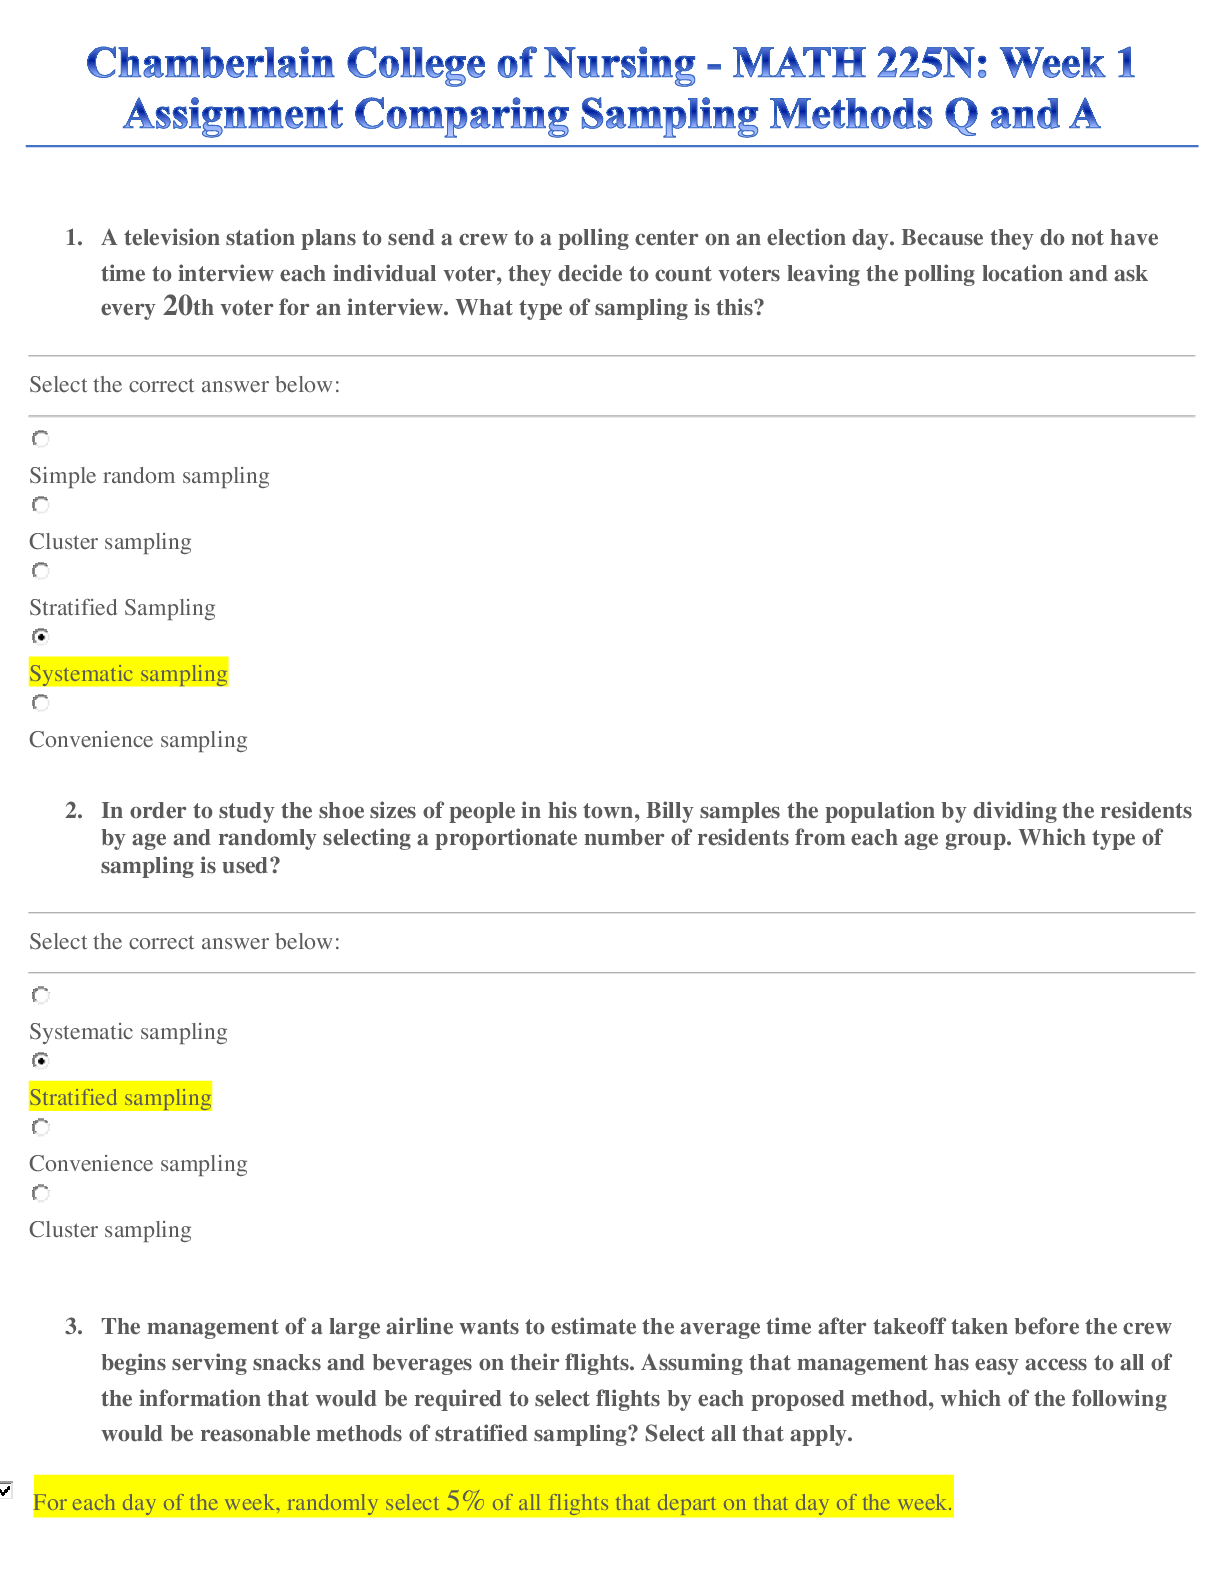
MATH 225N Chamberlain College of Nursing - Week 1 Assignment C...
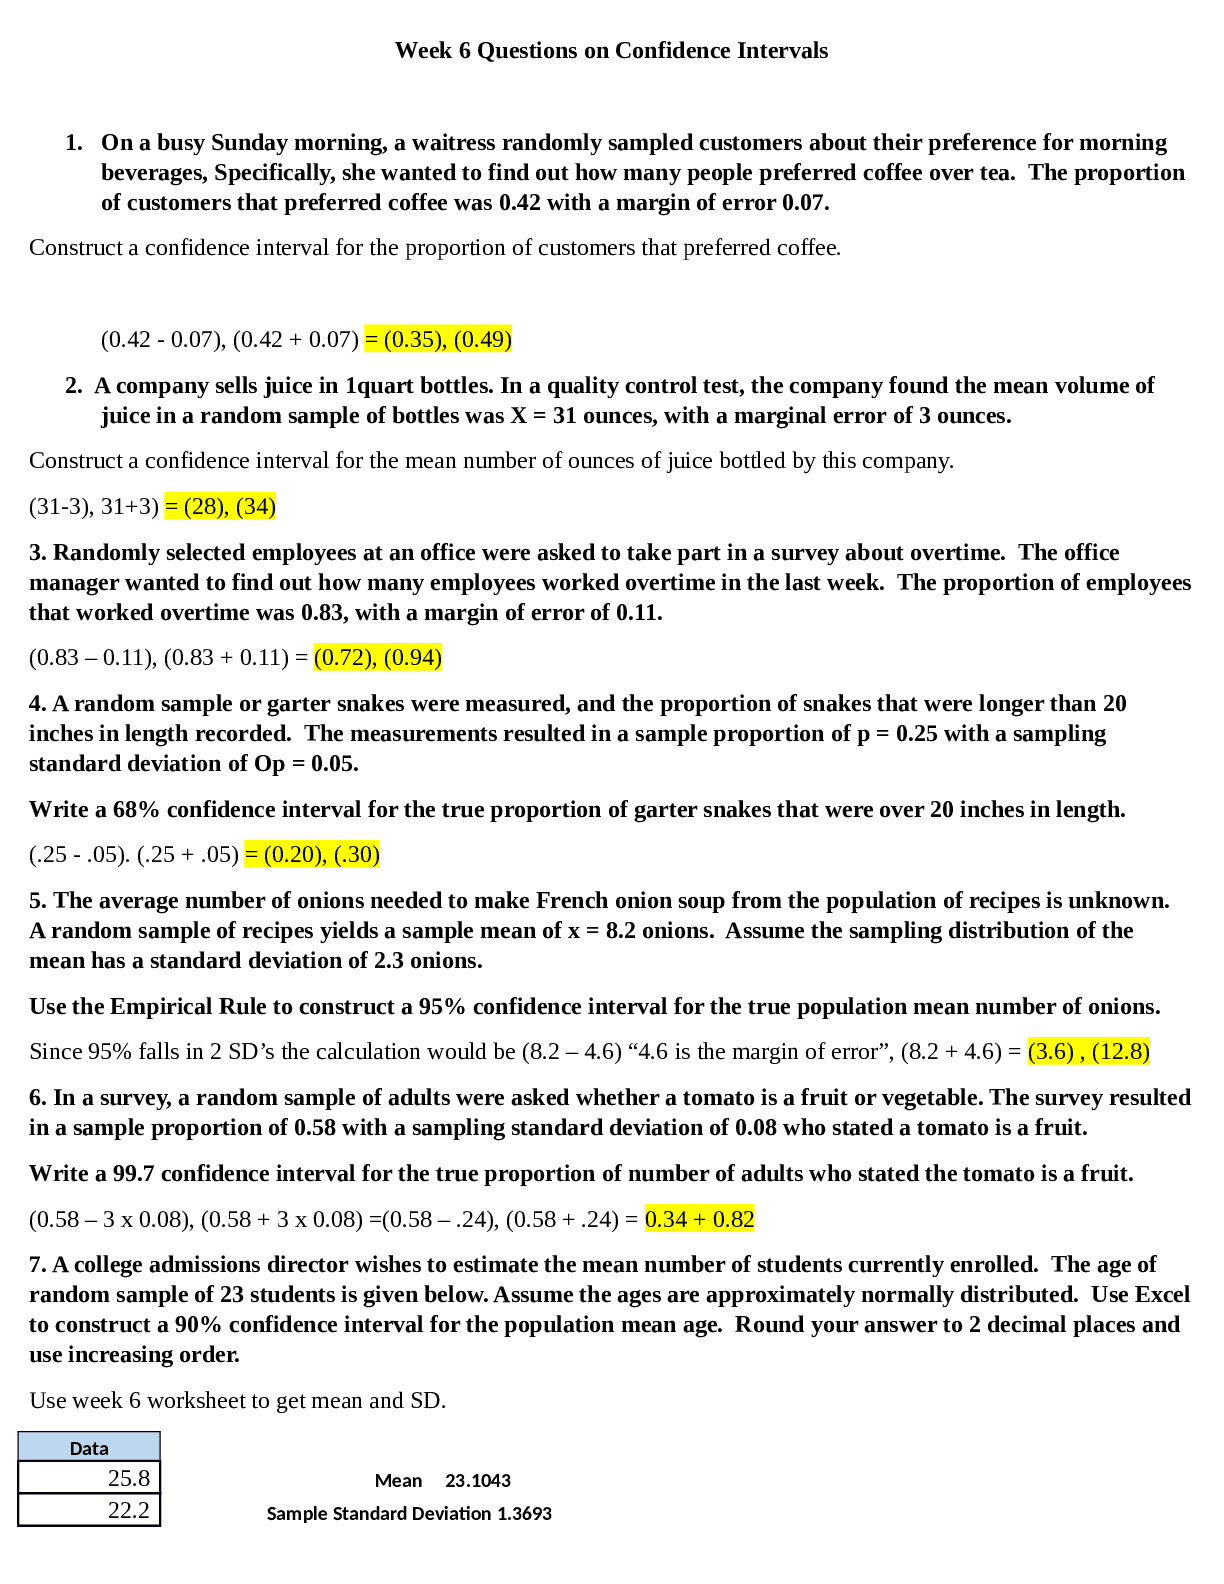
Chamberlain College of NursingMATH 225N MATHWeek 6 Confidence...

Chamberlain College of NursingMATH 225N MATHStatistic Final

Chamberlain College of NursingMATH 225N MATHWeek 7 Assignment...
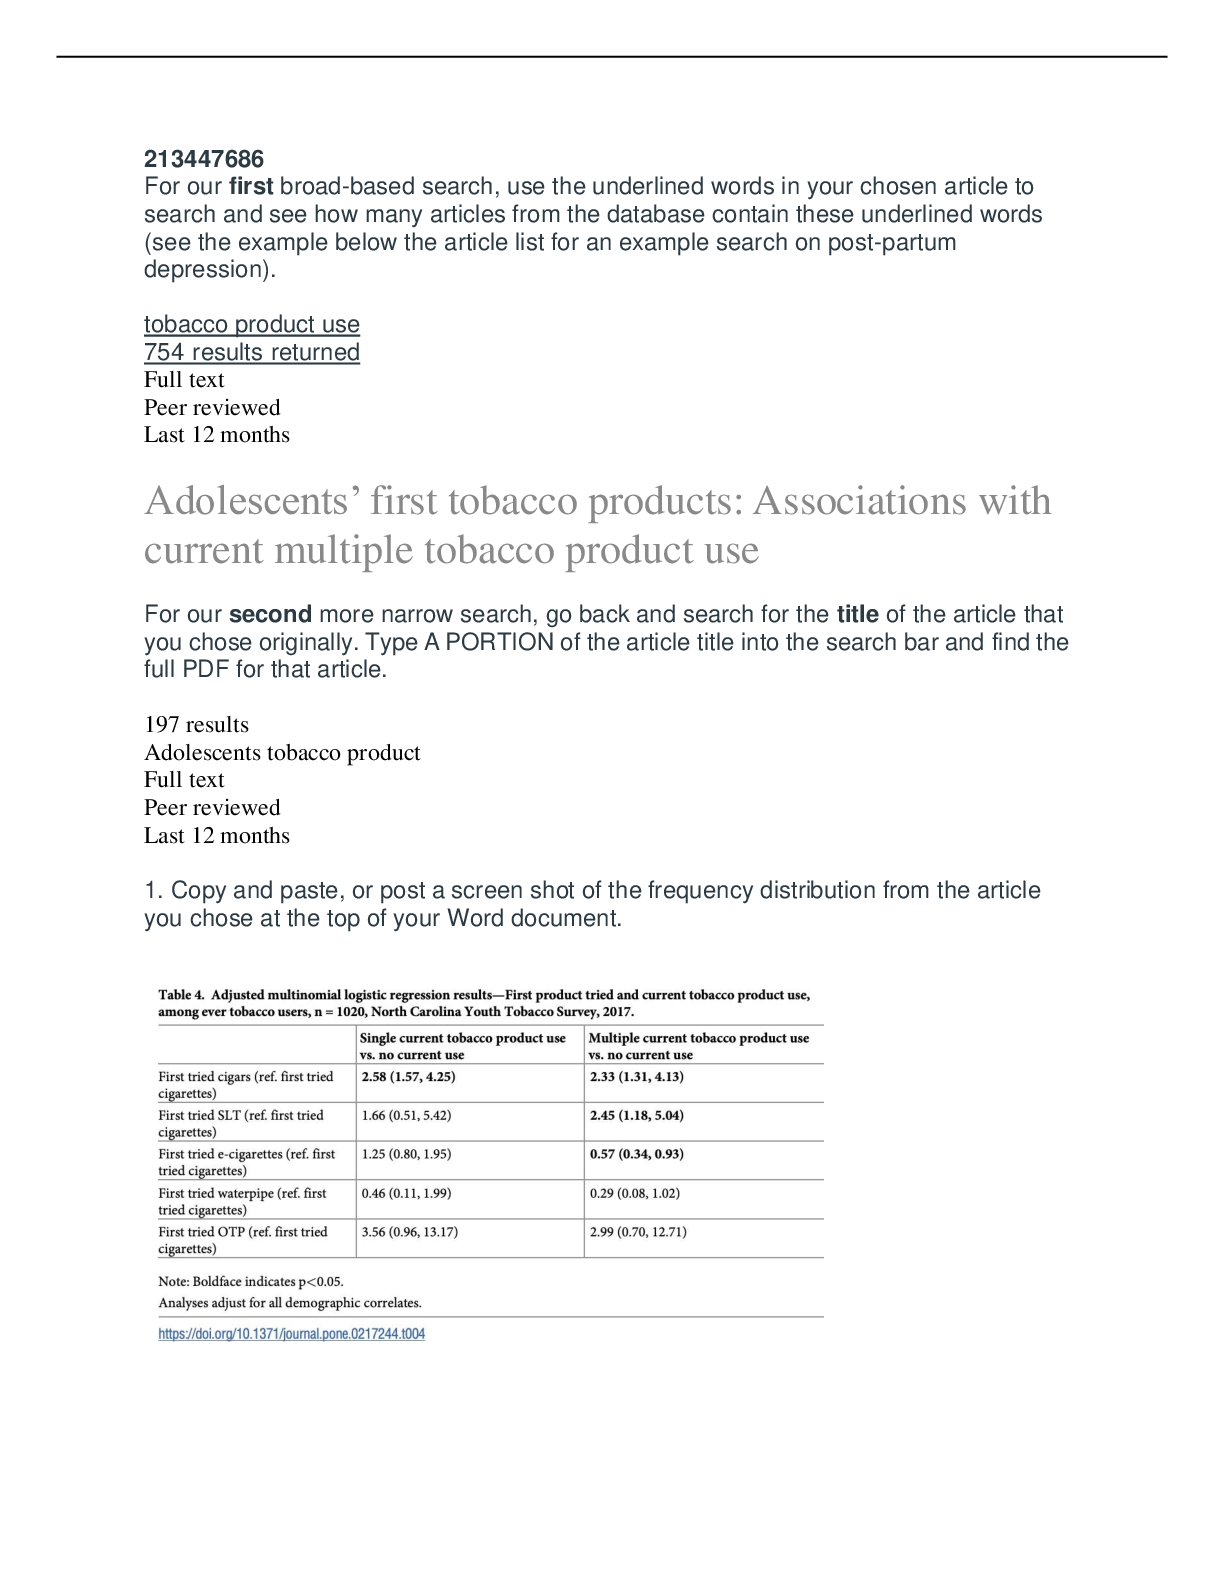
MATH 225N Adolescents First Tobacco Products Week 3 Lab Assig...
MATH 225N STATISTIC FINAL - CHAMBERLAIN COLLEGE OF NURSING

TEST BANK for Strategic Corporate Social Responsibility, Susta...

Test Bank Statistics A Tool for Social Research and Data Analy...
Test Bank Statistics A Tool for Social Research and Data Analy...
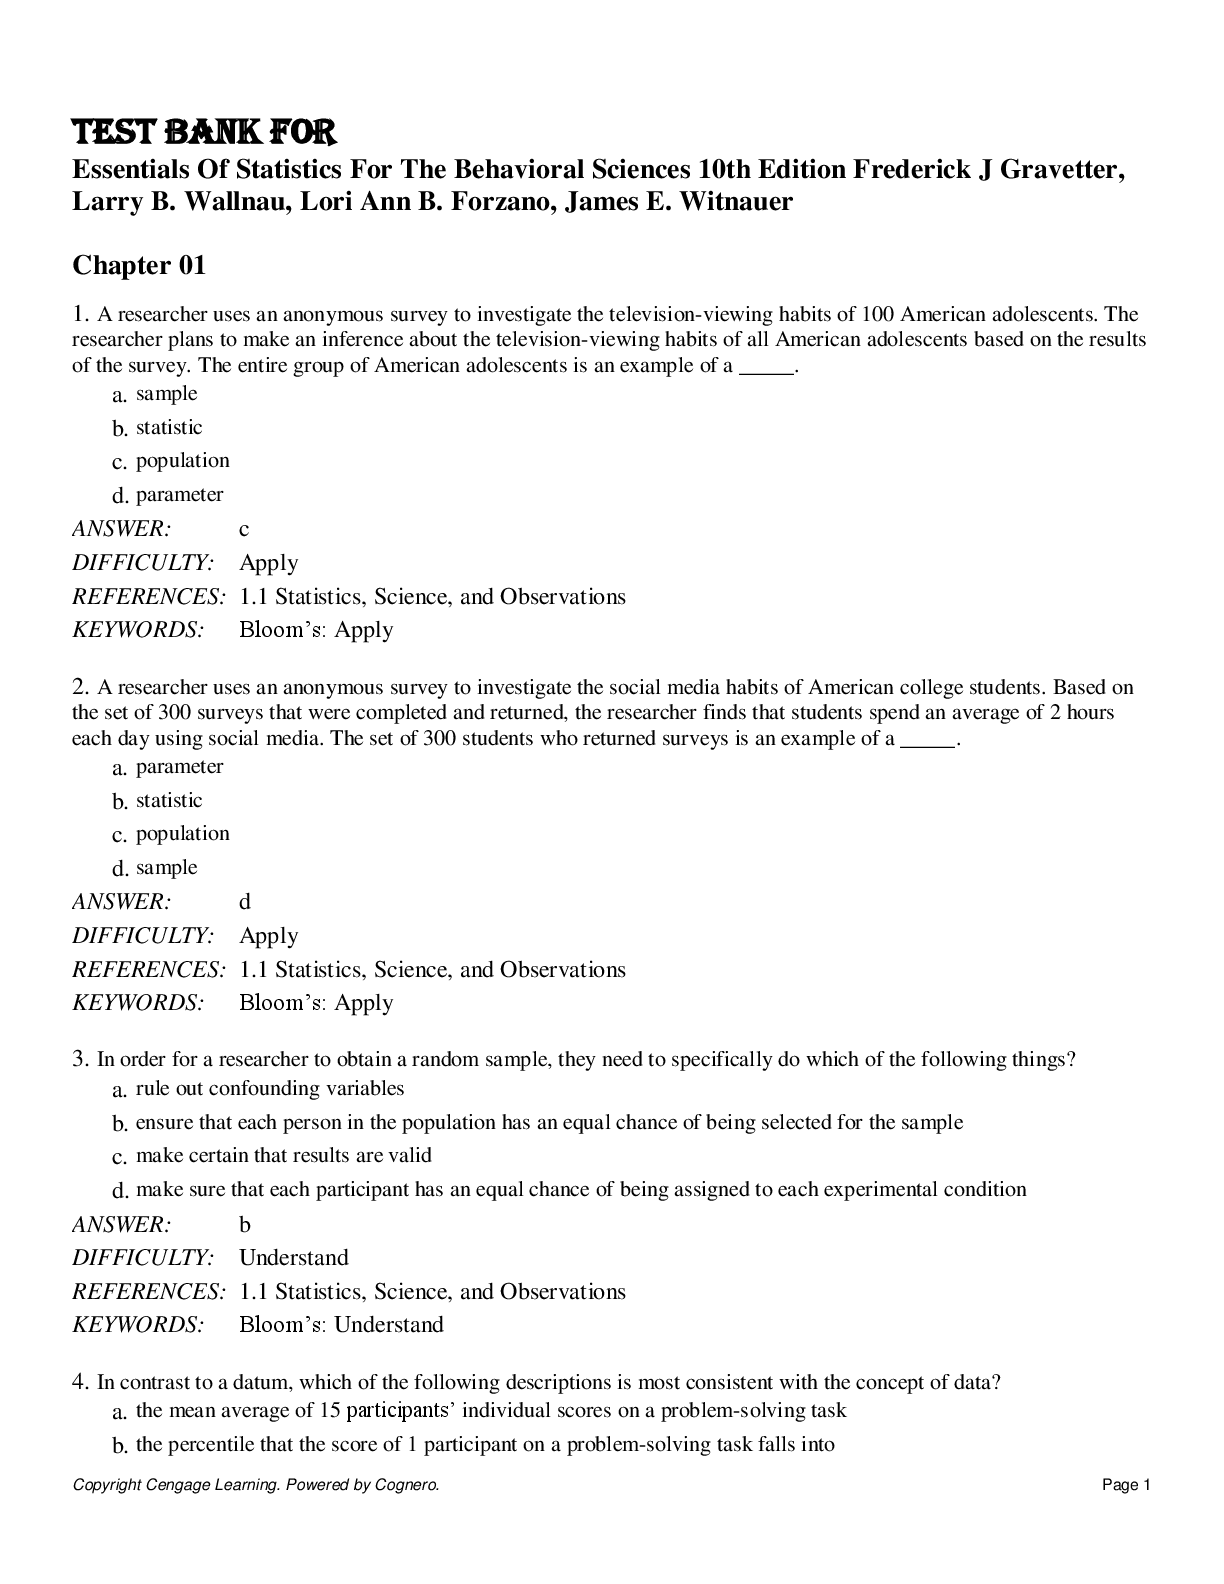
TEST BANK FOR Essentials Of Statistics For The Behavioral Scie...
TEST BANK FOR Essentials Of Statistics For The Behavioral Sci...
Solution Manual For Statistics for Business and Economics 8th...
Solution Manual For Elementary Statistics 13th Edition by Mari...