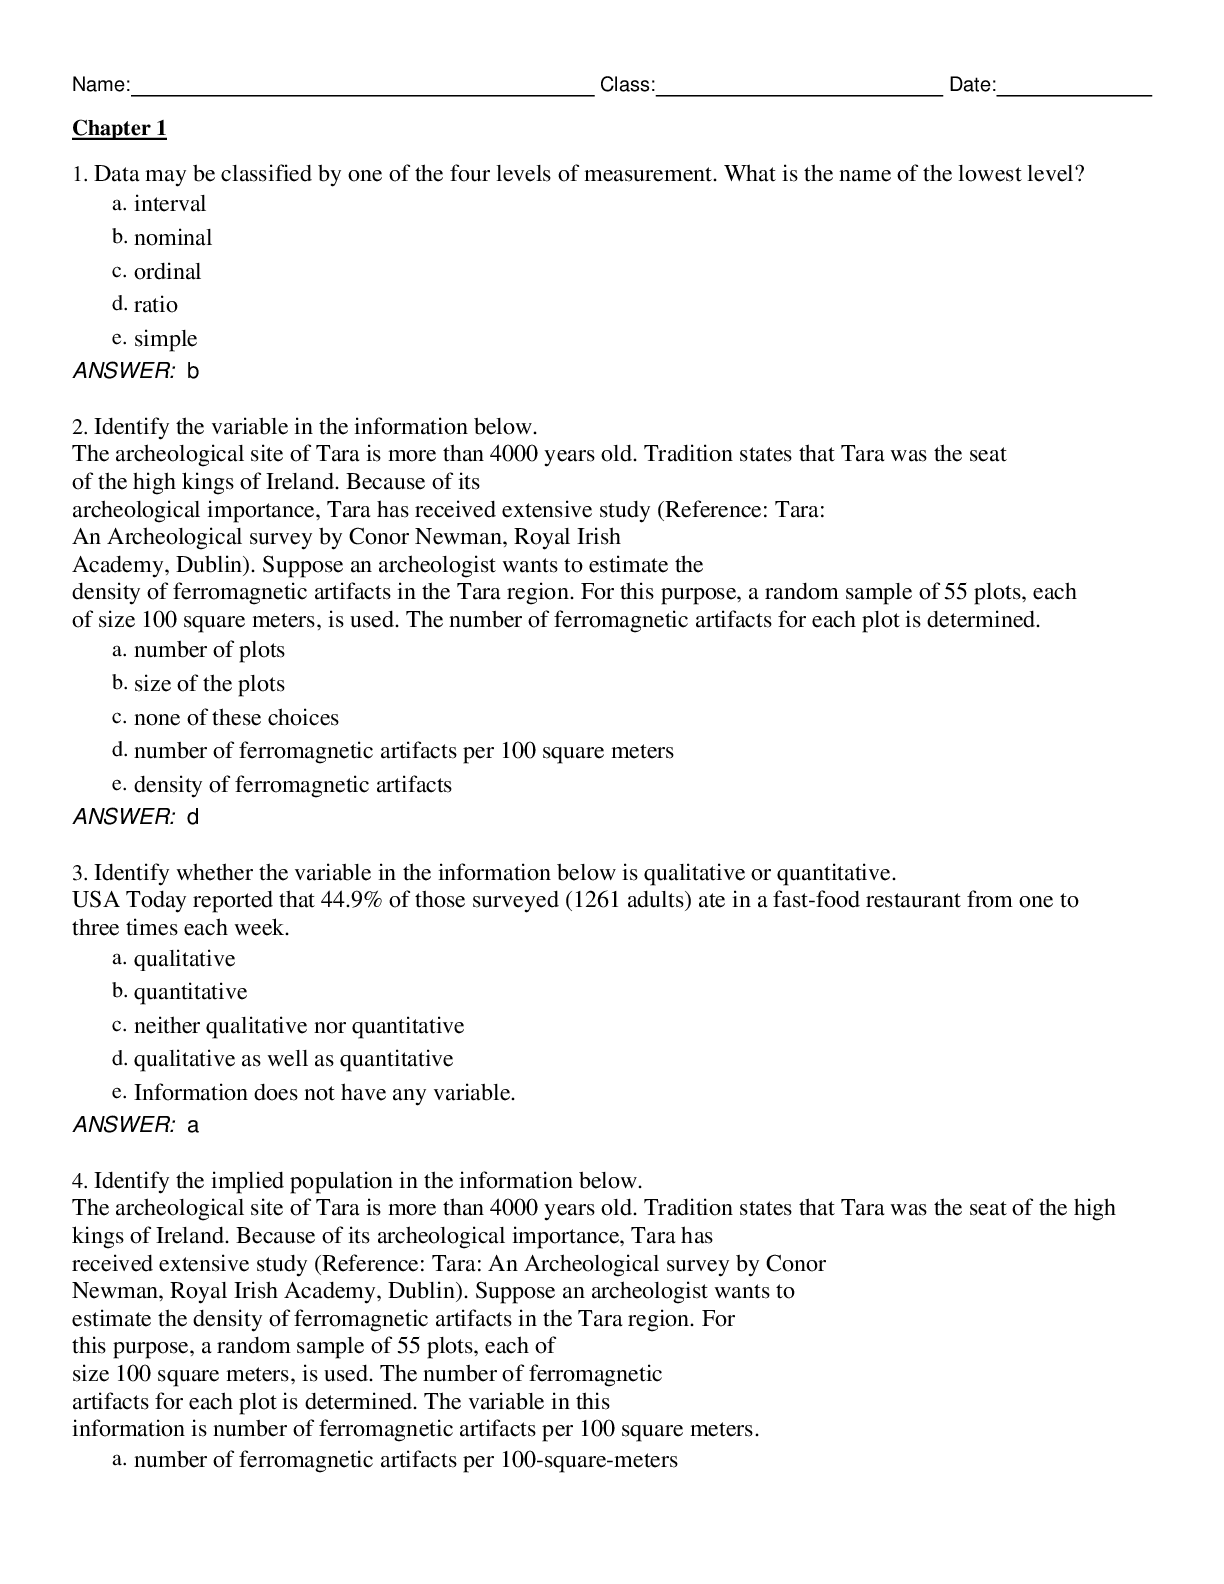
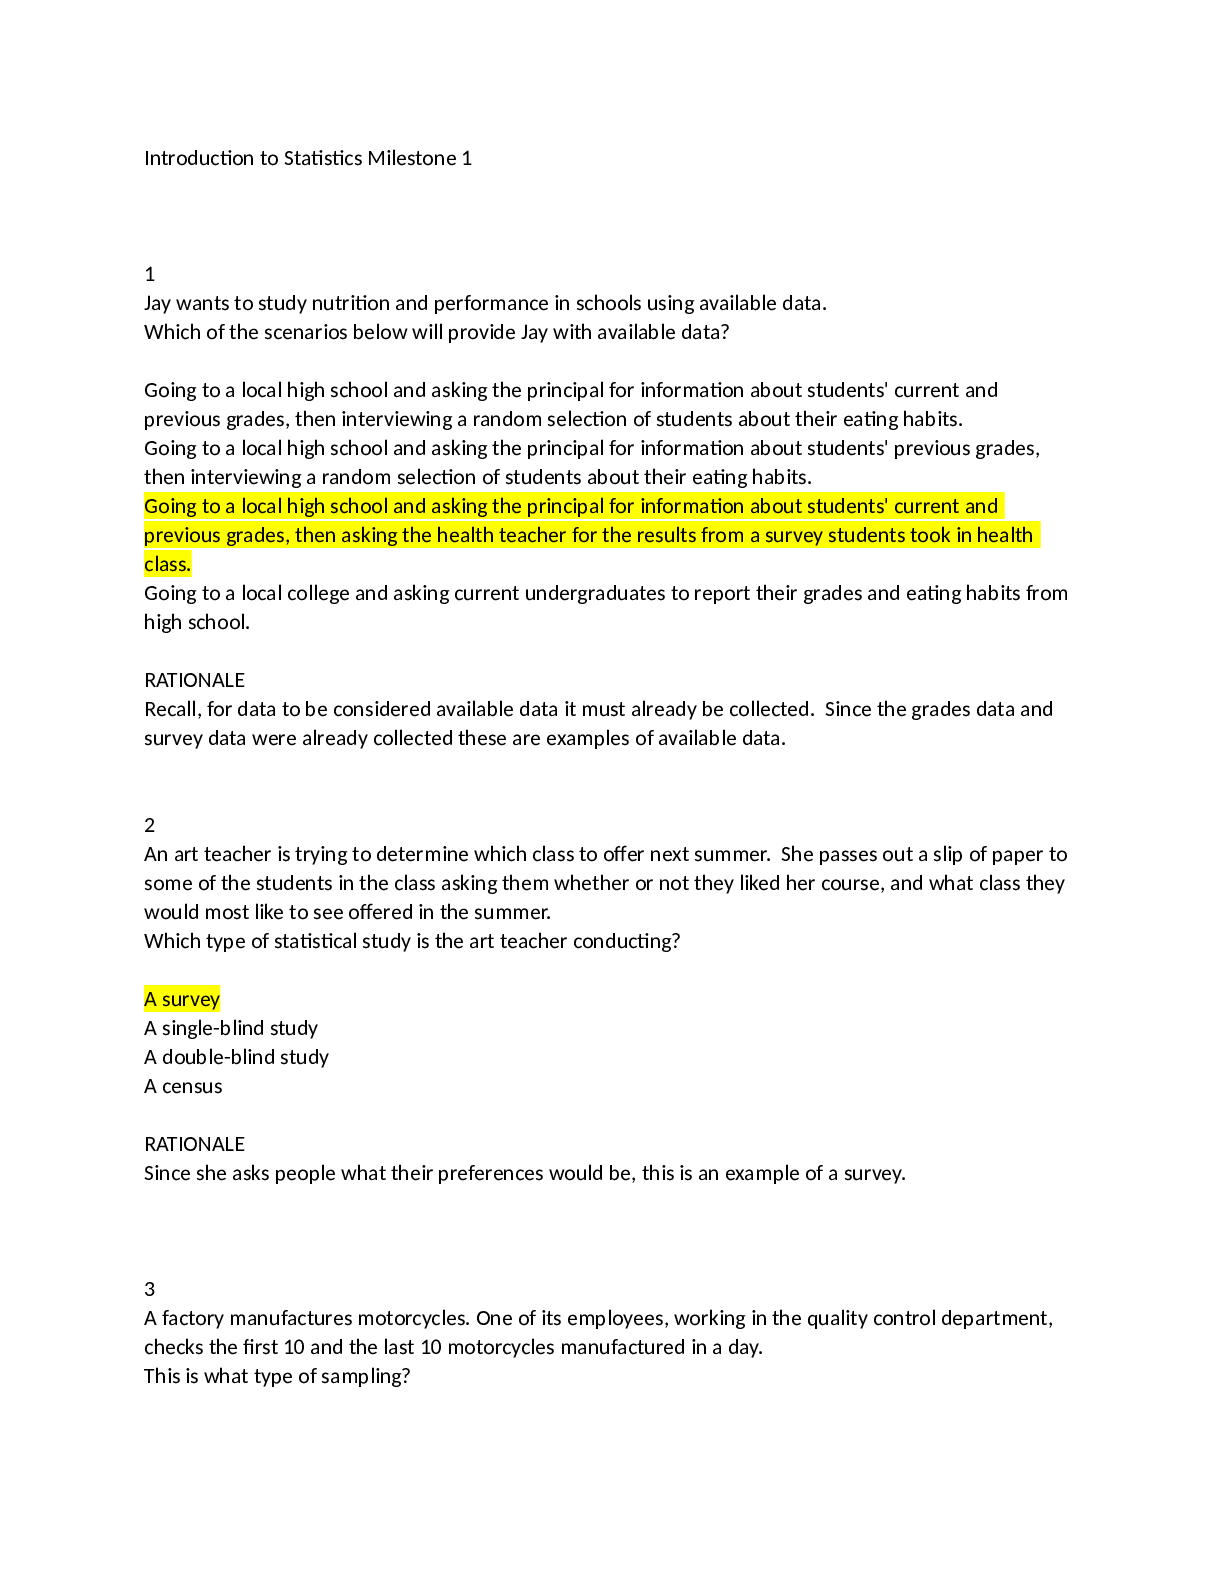
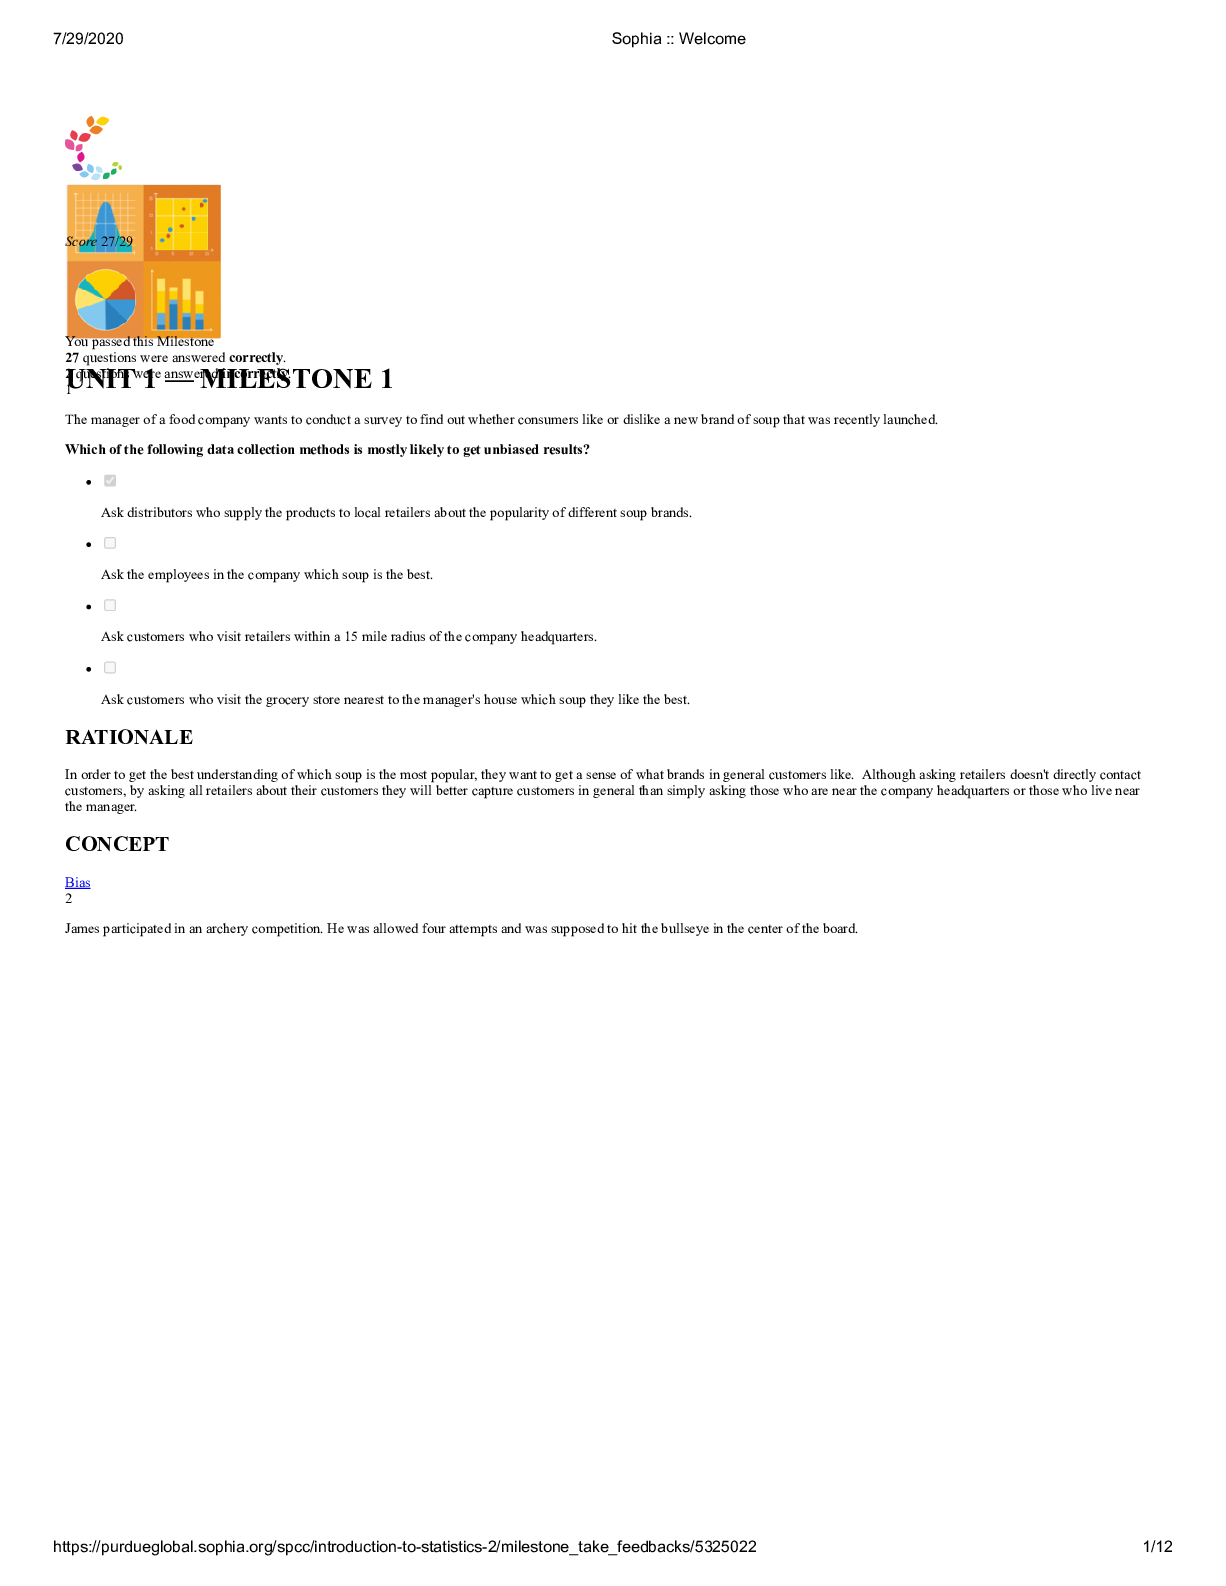
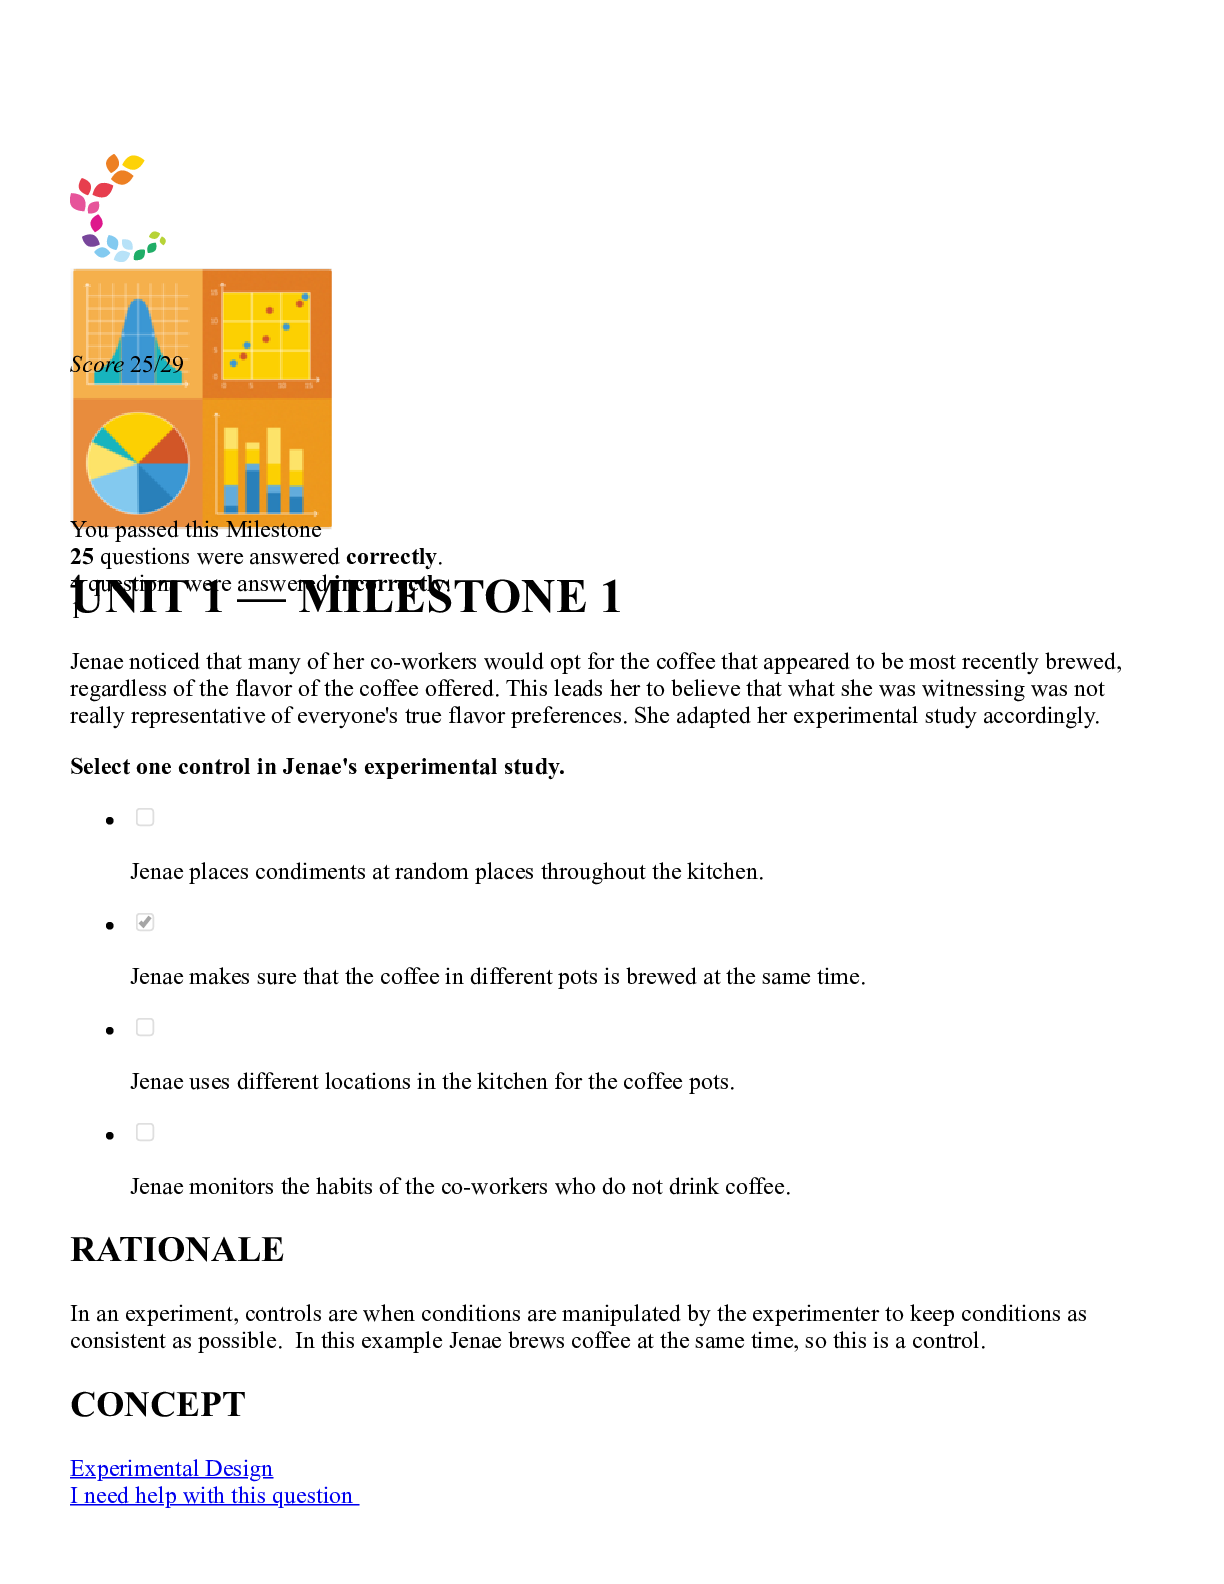
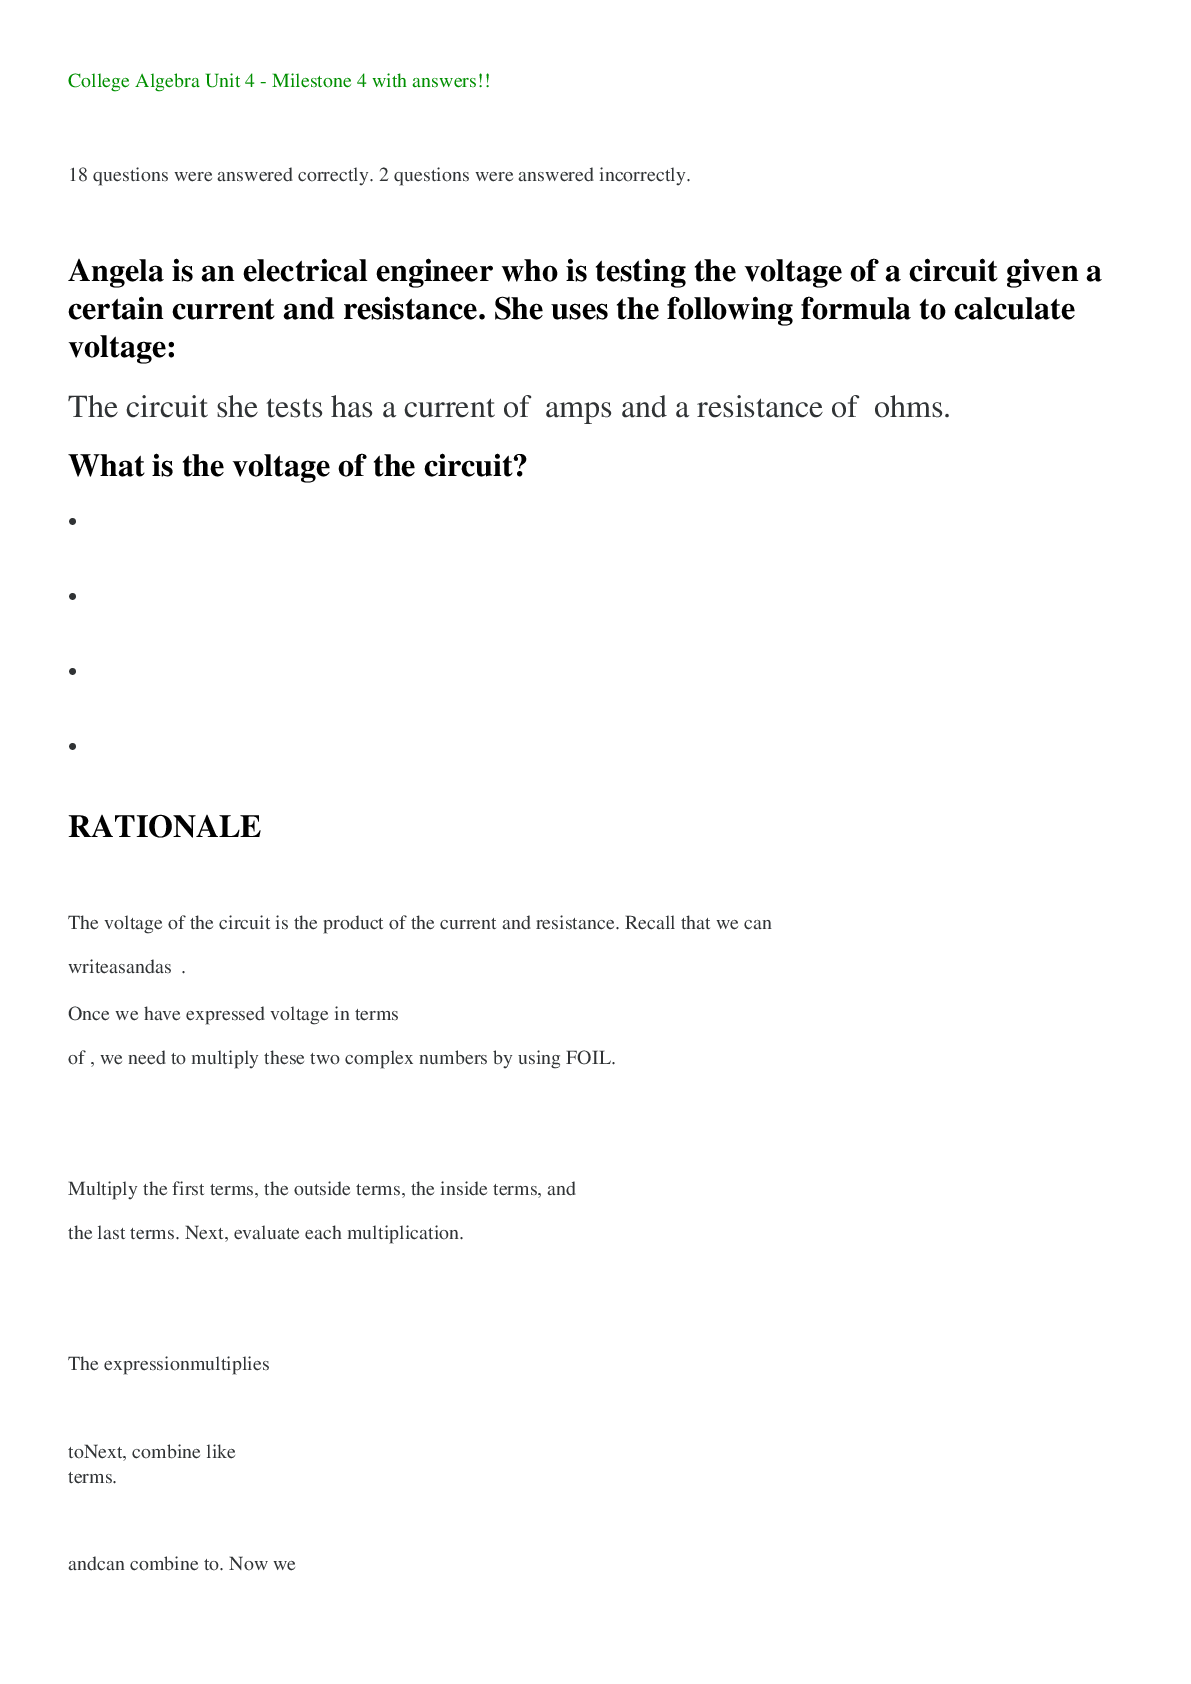
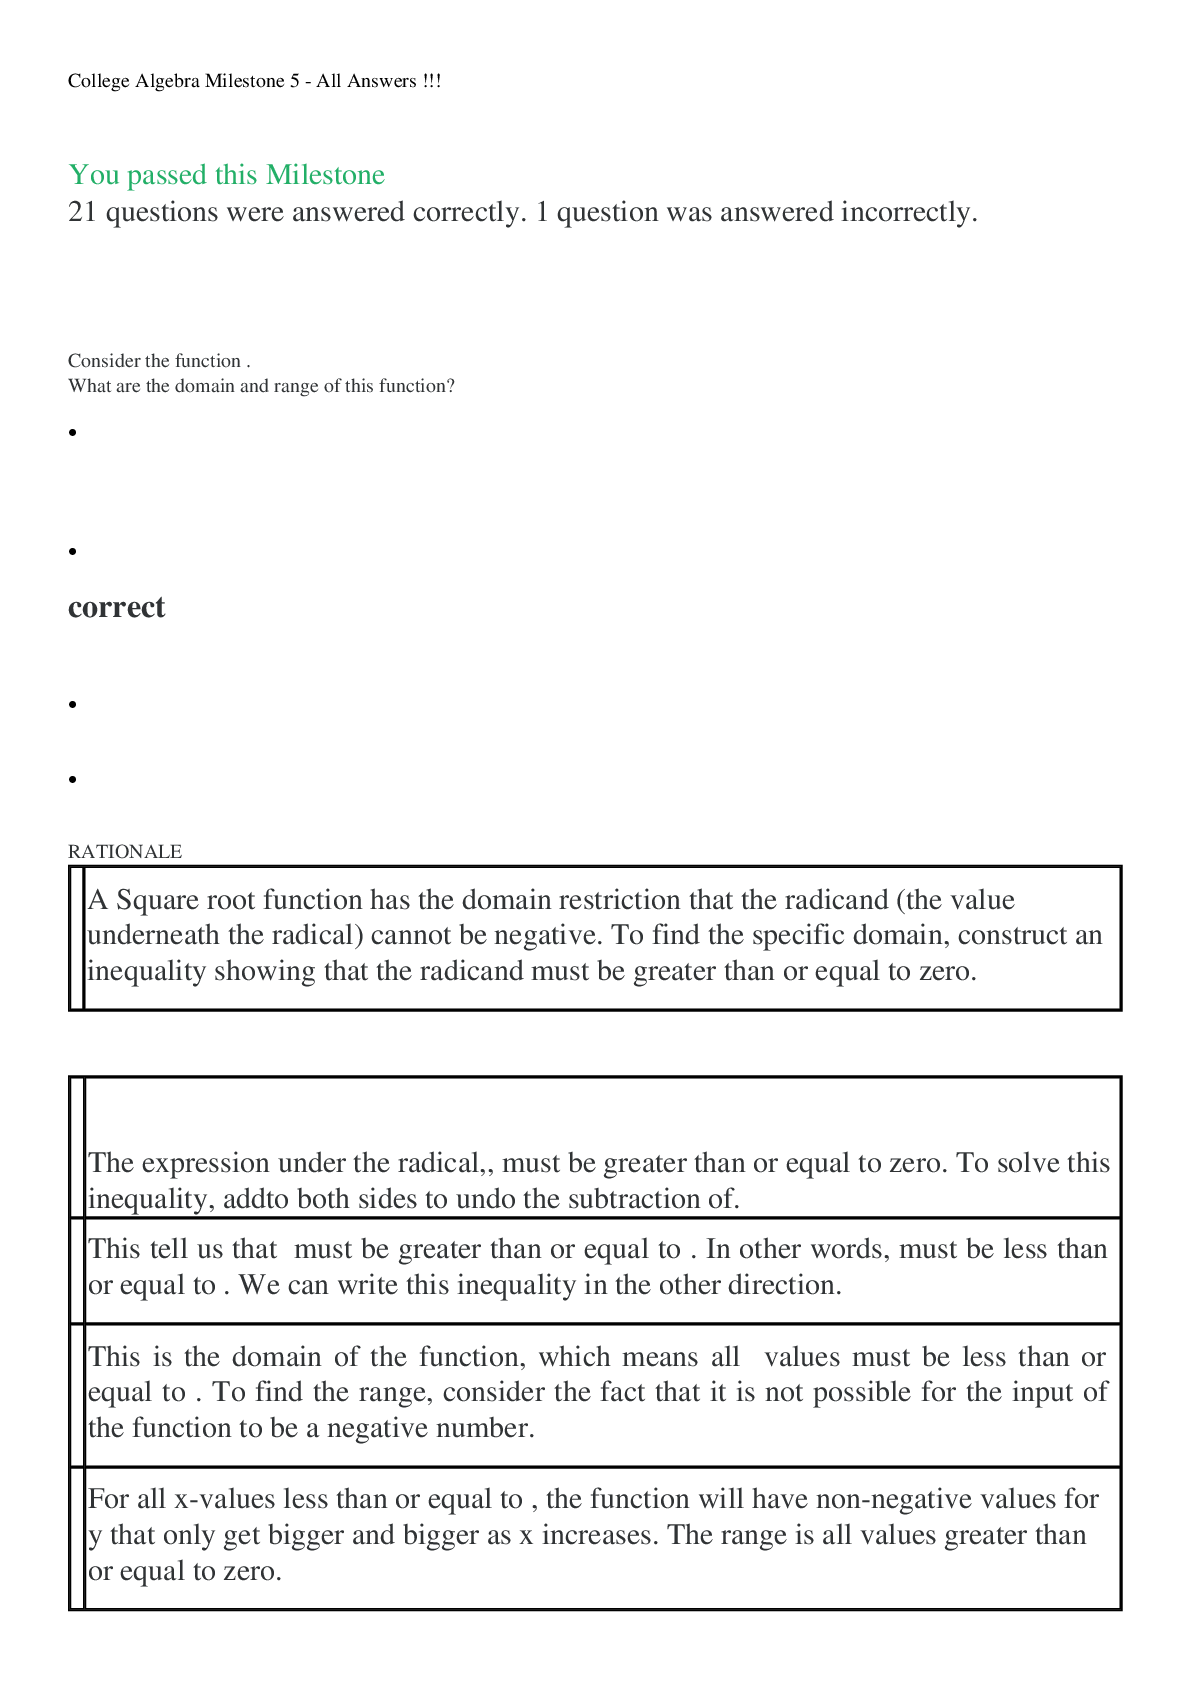
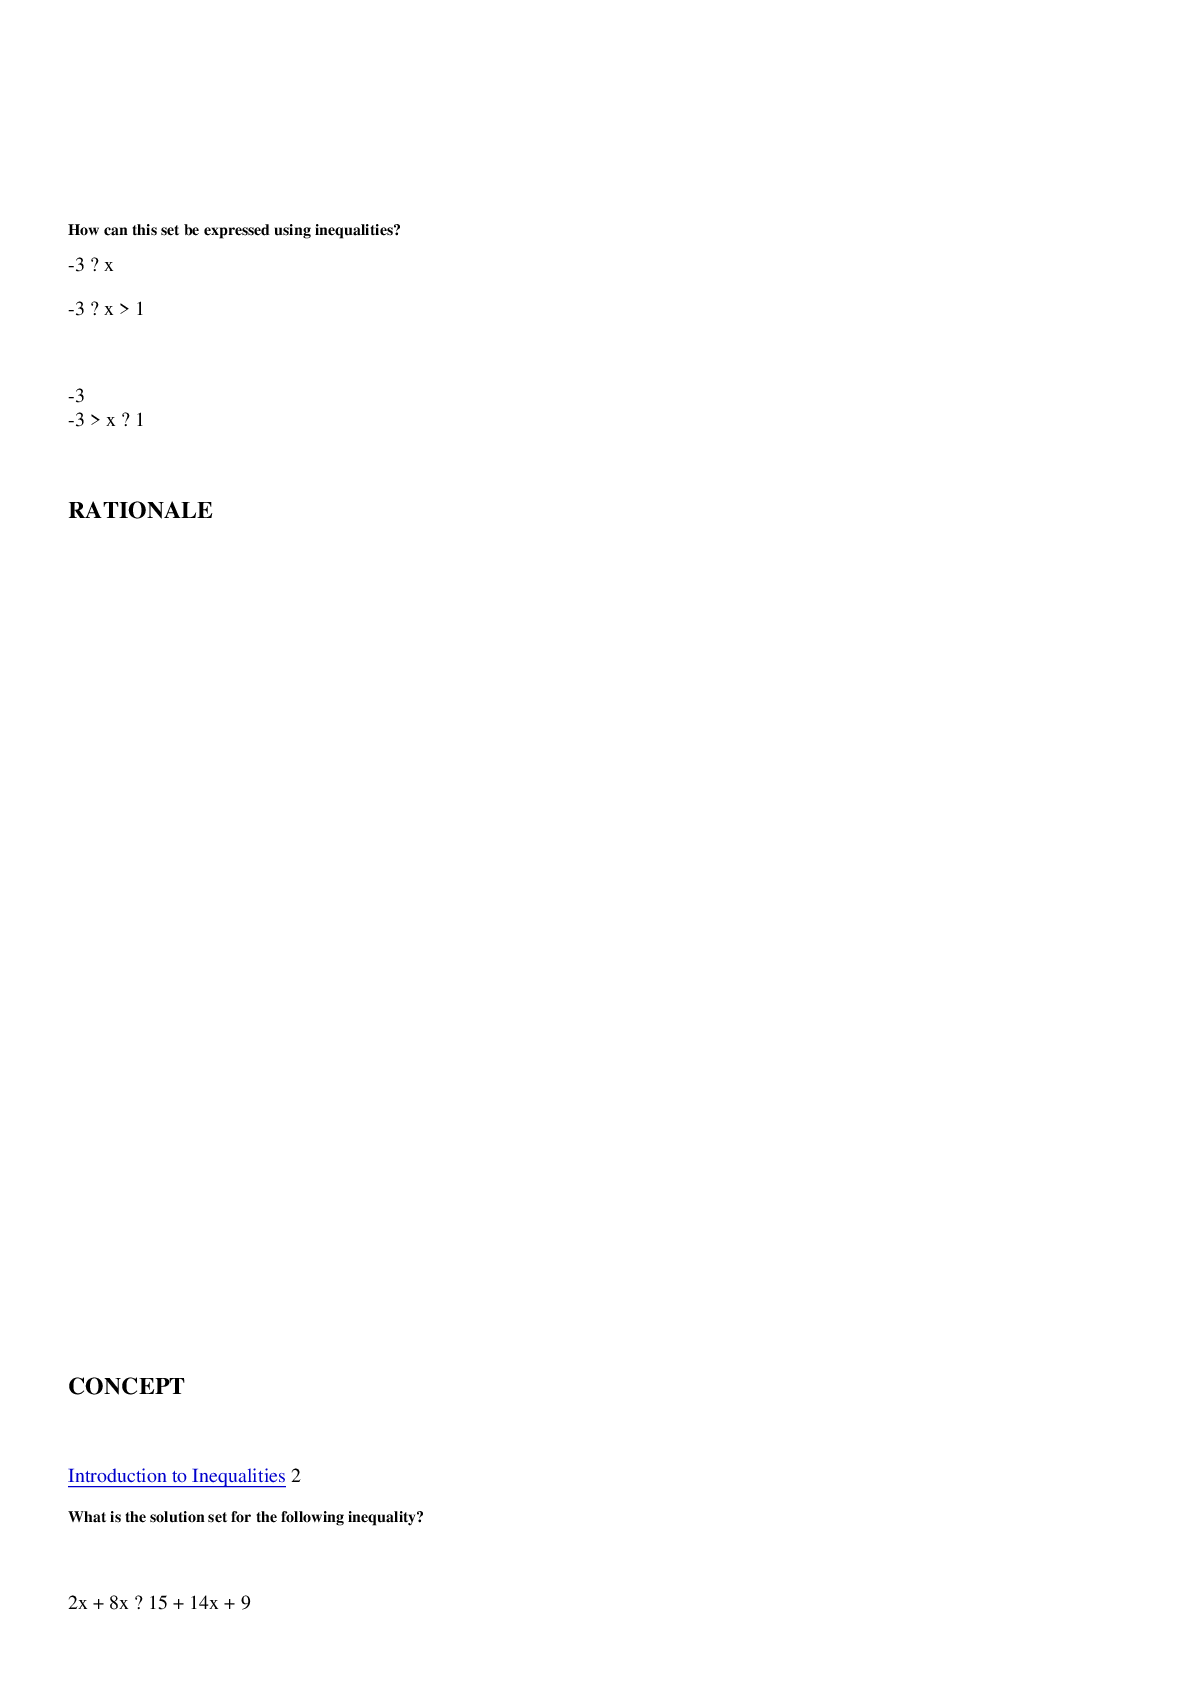
Statistics > SOPHIA Milestone > SOPHIA_INTRO TO STATISTICS_FINAL_MILESTONE.pdf. LATEST MASTERPIECE. RATIONALE ANSWERS PROVIDED. RATE (All)
SOPHIA_INTRO TO STATISTICS_FINAL_MILESTONE.pdf. LATEST MASTERPIECE. RATIONALE ANSWERS PROVIDED. RATED A+
Document Content and Description Below
Last updated: 3 years ago
Preview 1 out of 13 pages
Instant download

Buy this Document to get the Full Access Instantly
Provided by Students Who Aced it
We Verify Document Content to Gurantee Accuracy
Reviews( 0 )
Document information
Connected school, study & course
About the document
Uploaded On
Mar 30, 2022
Number of pages
13
Written in
All

Additional information
This document has been written for:
Uploaded
Mar 30, 2022
Downloads
1
Views
244
Topic Tags
Recommended For You
Get more on SOPHIA Milestone »
SOPHIA Statistics Unit 4 Milestone. Questions/Answers & Ration...

Sophia Statistics Unit 4 Milestone, questions/Answers/Rational...
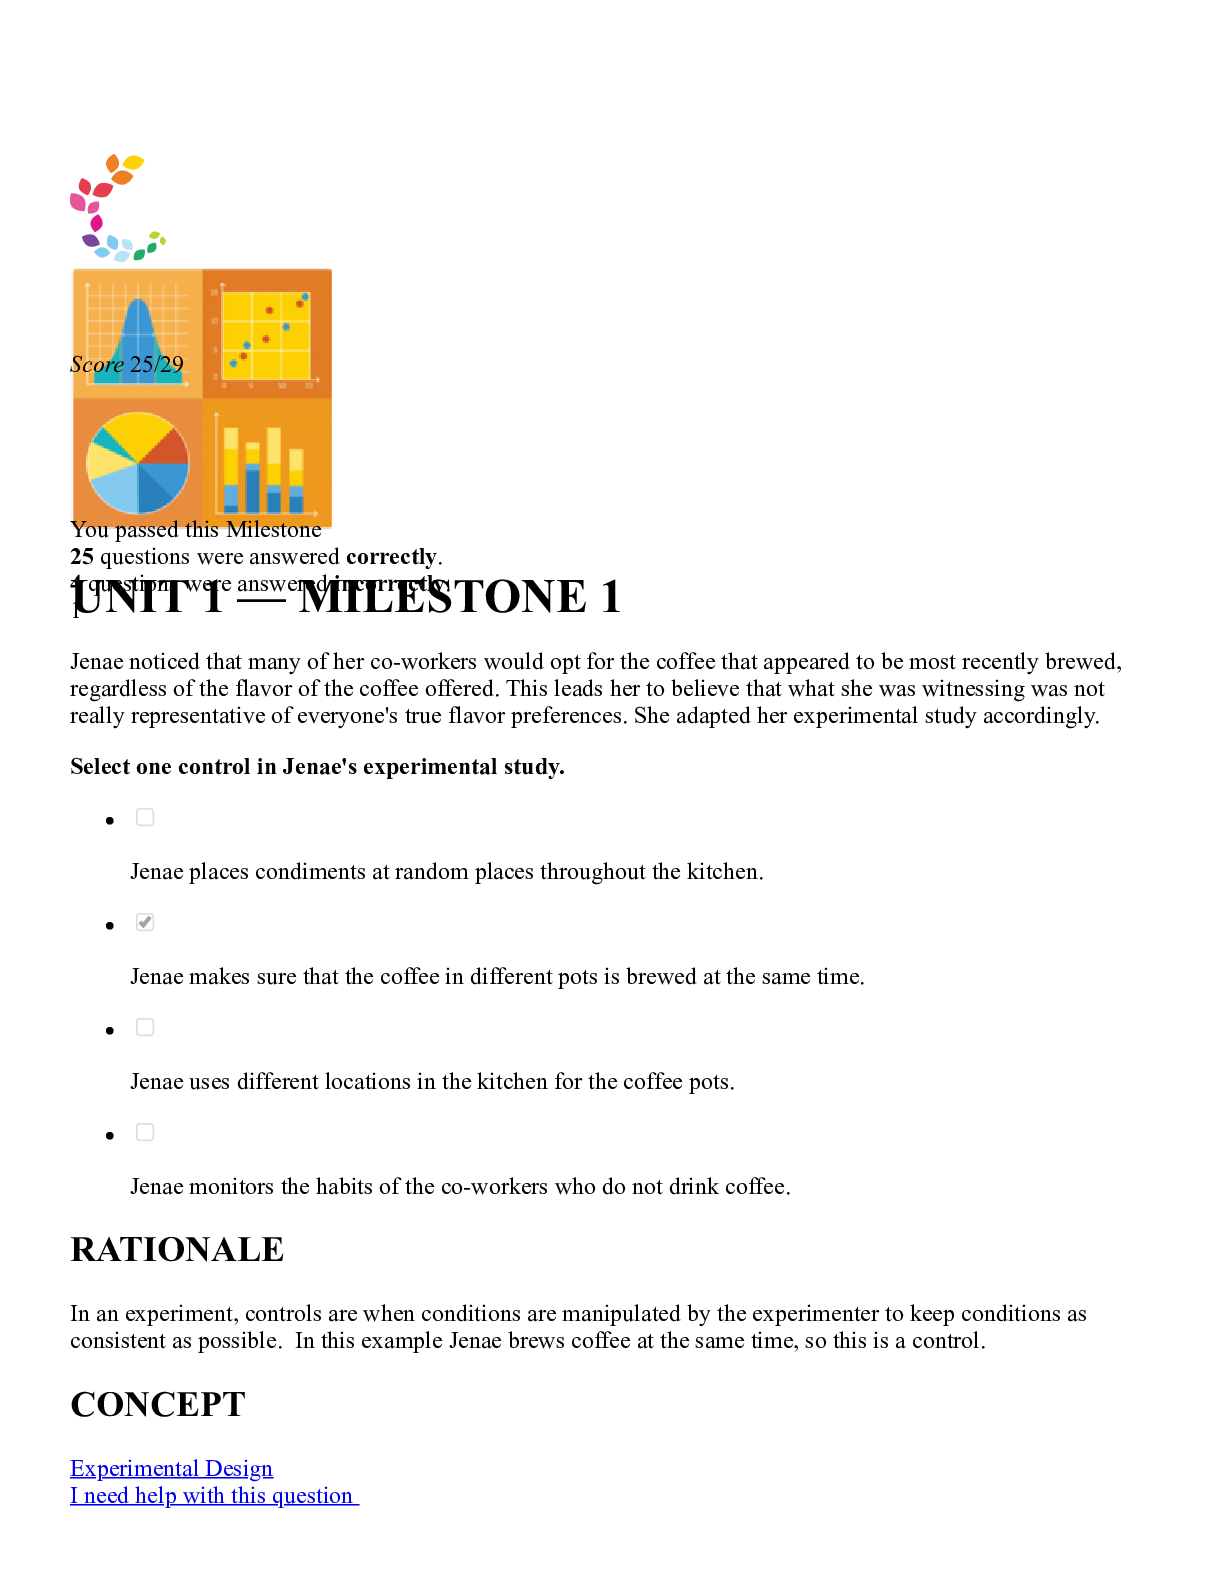
Sophia Statistics Unit 1 Milestone, Revised, answers/ Rational...
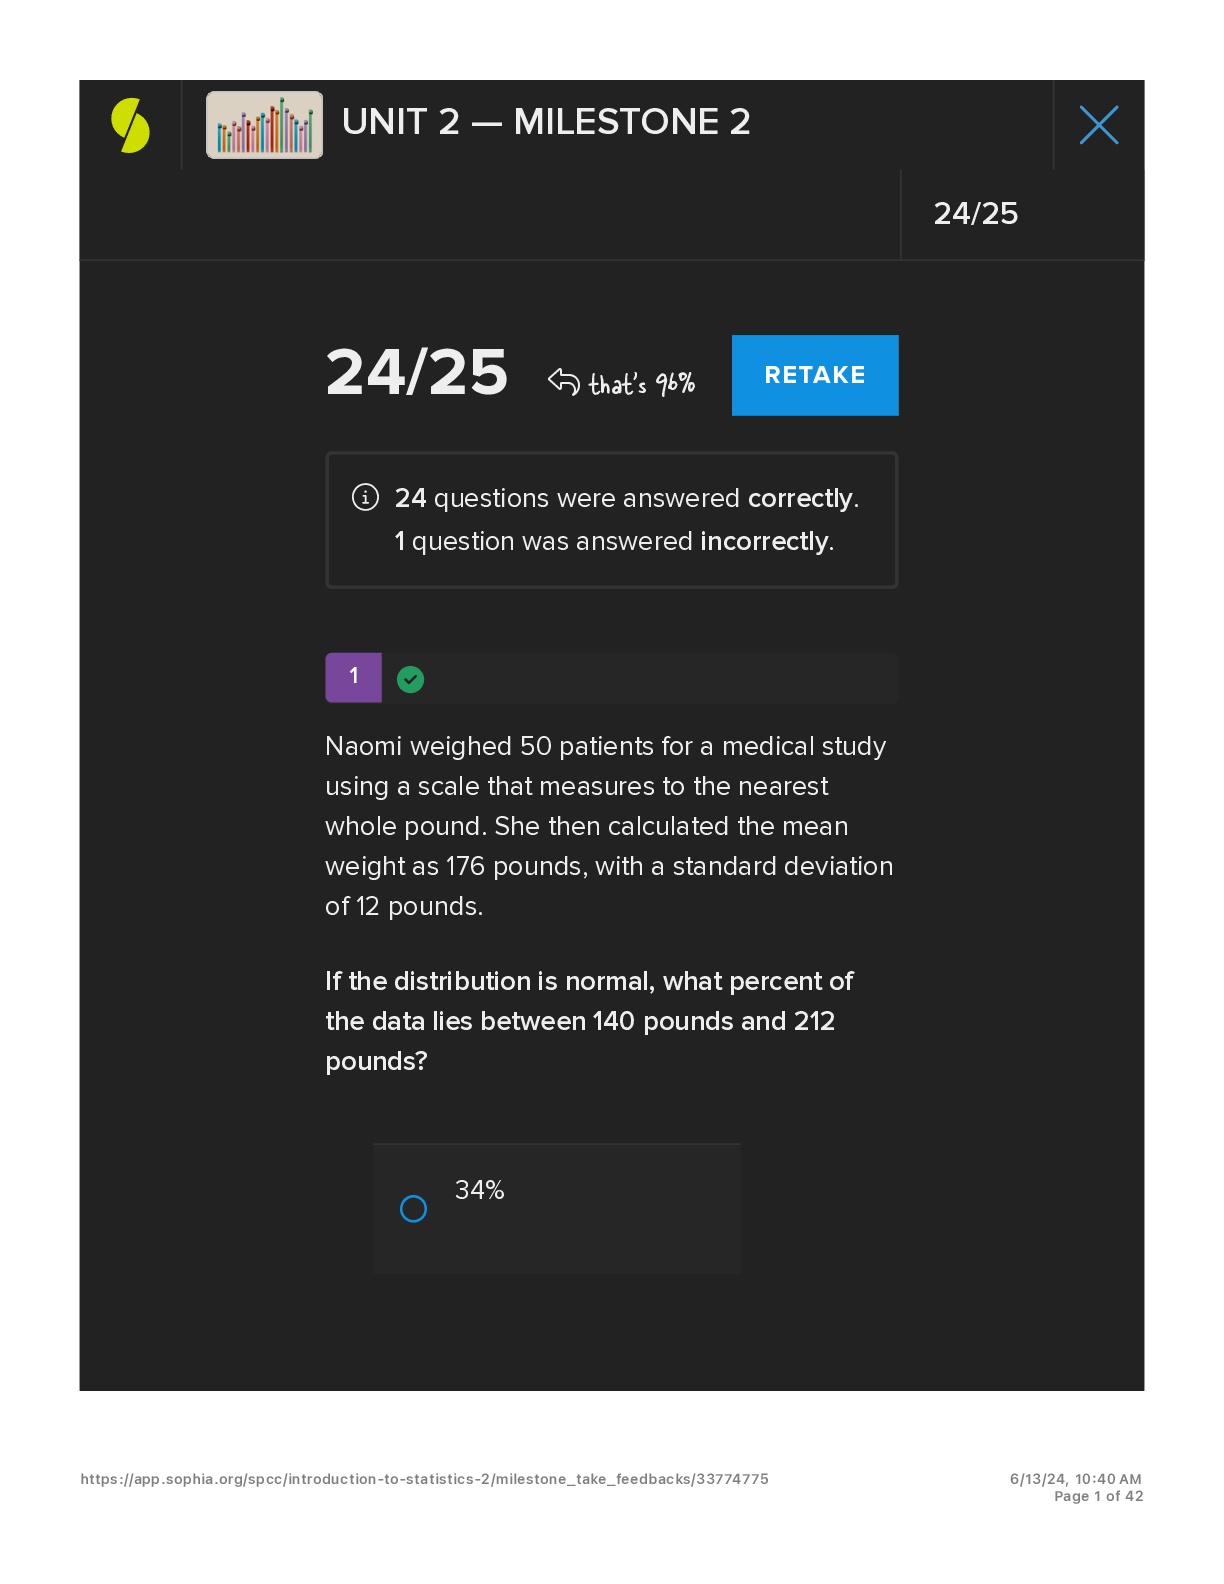
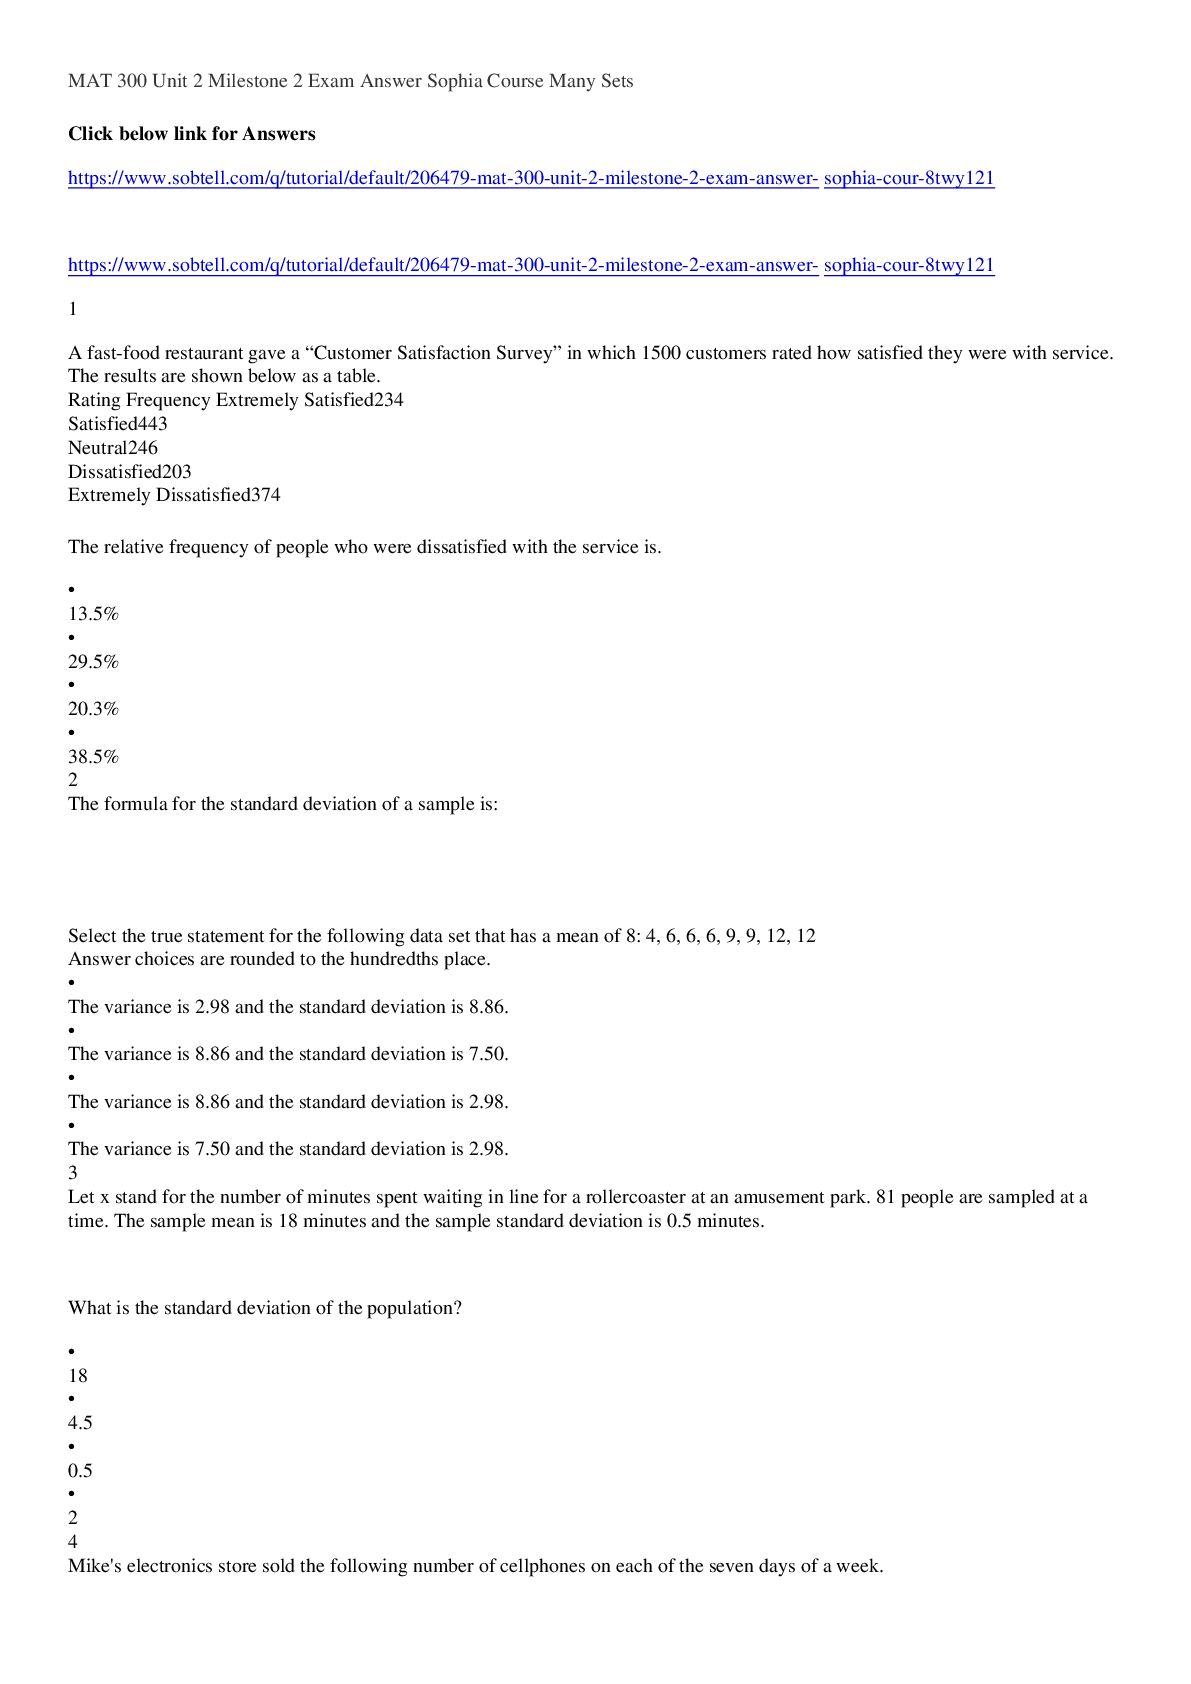
Sophia Learning STAT1001: Introduction to Statistics UNIT 2 —...

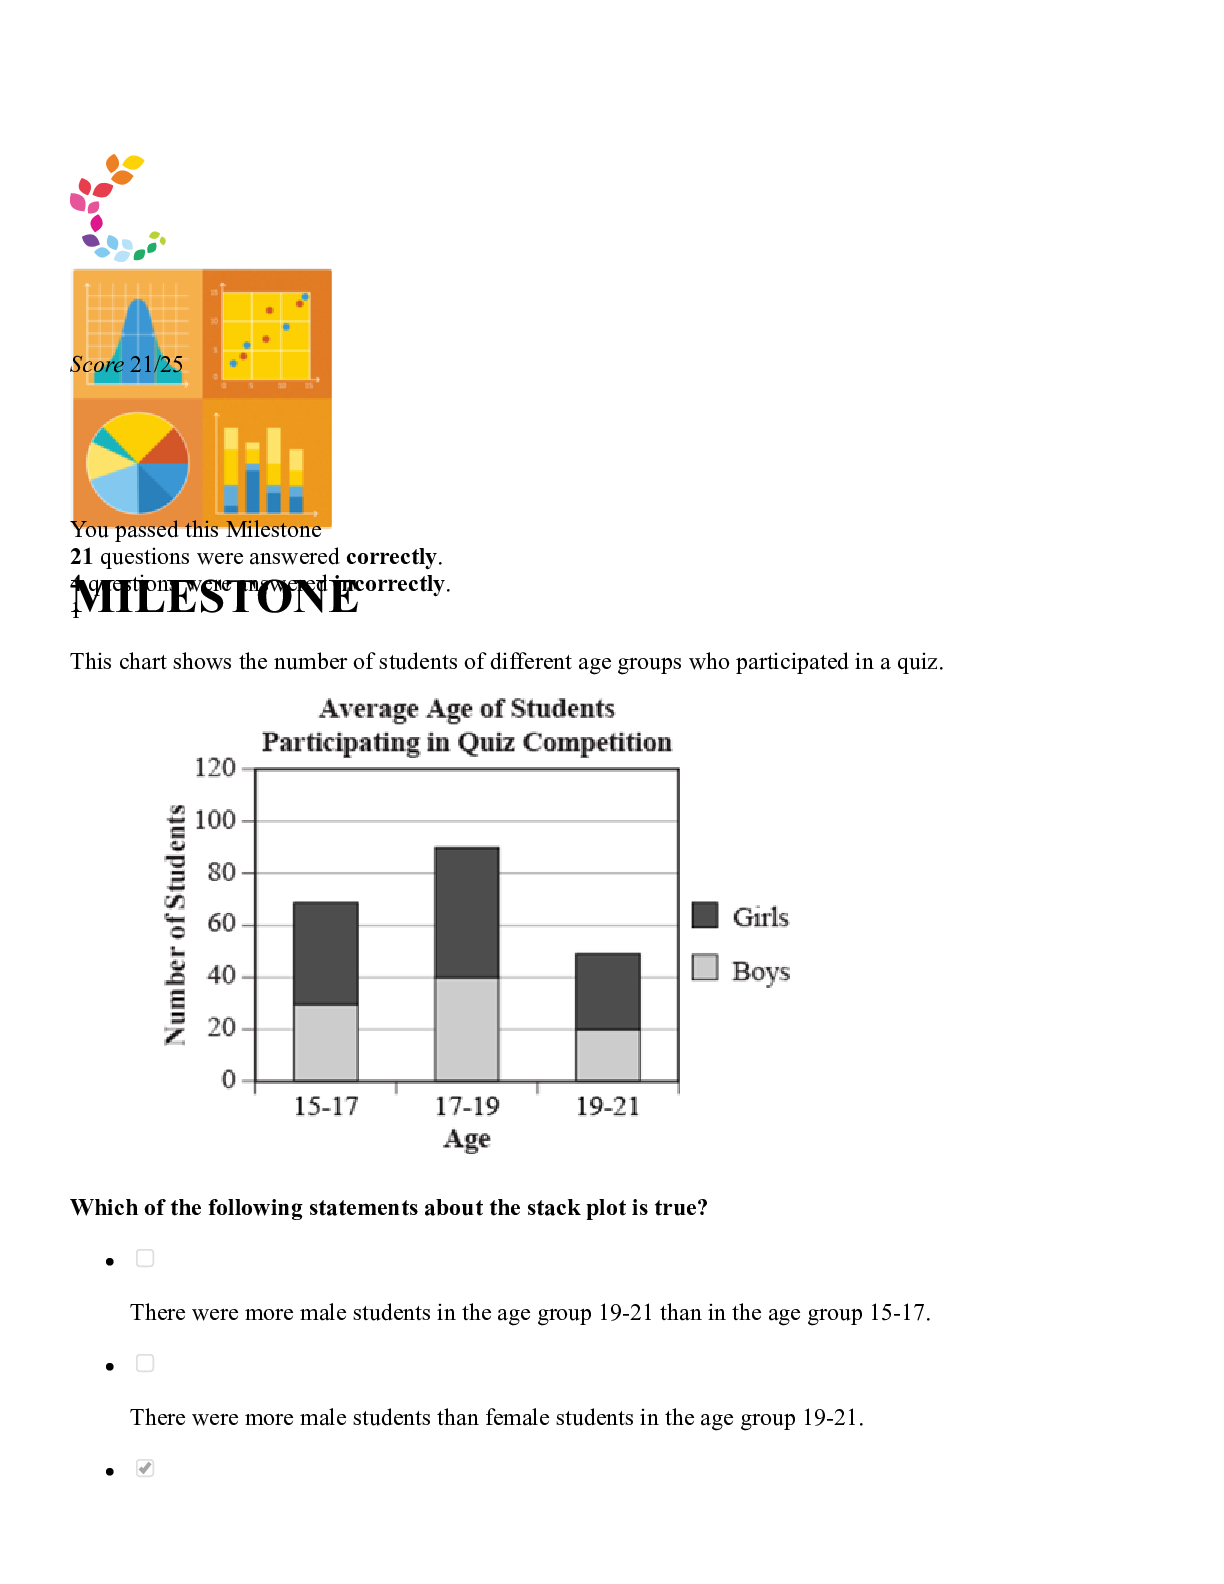
Sophia Statistics FINAL Milestone. With RATIONALE and CONCEPT....
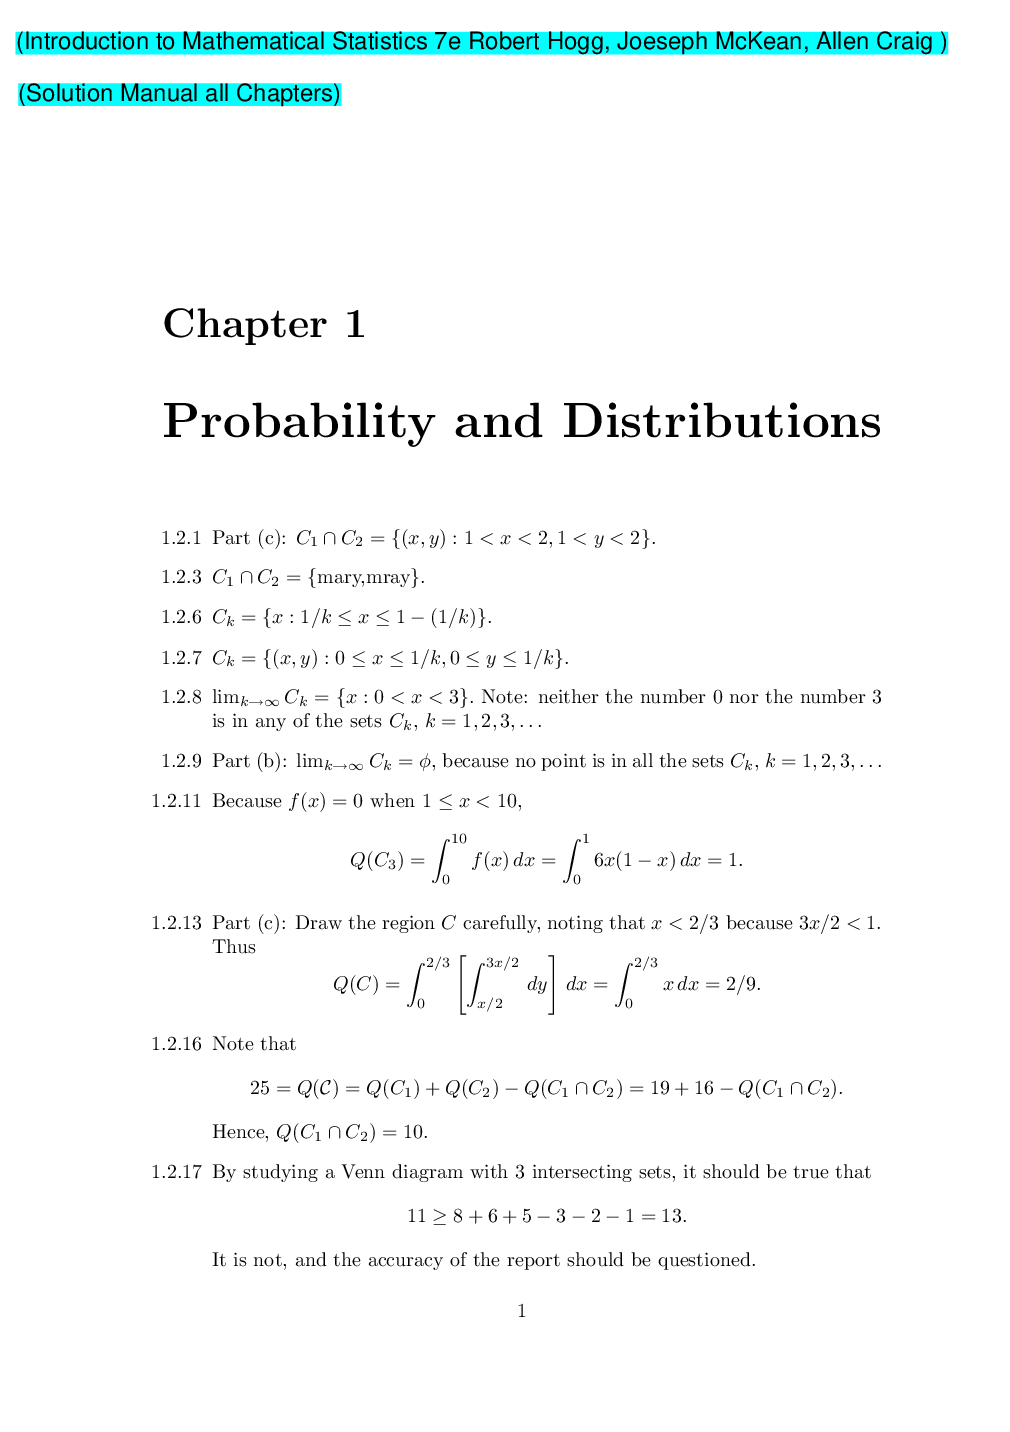
Introduction to Mathematical Statistics 7th Edition By Robert...

Introduction to the Practice of Statistics, 10e David Moore, G...
.png)
TEST BANK for Business Statistics, 4e Norean Sharpe, Richard V...
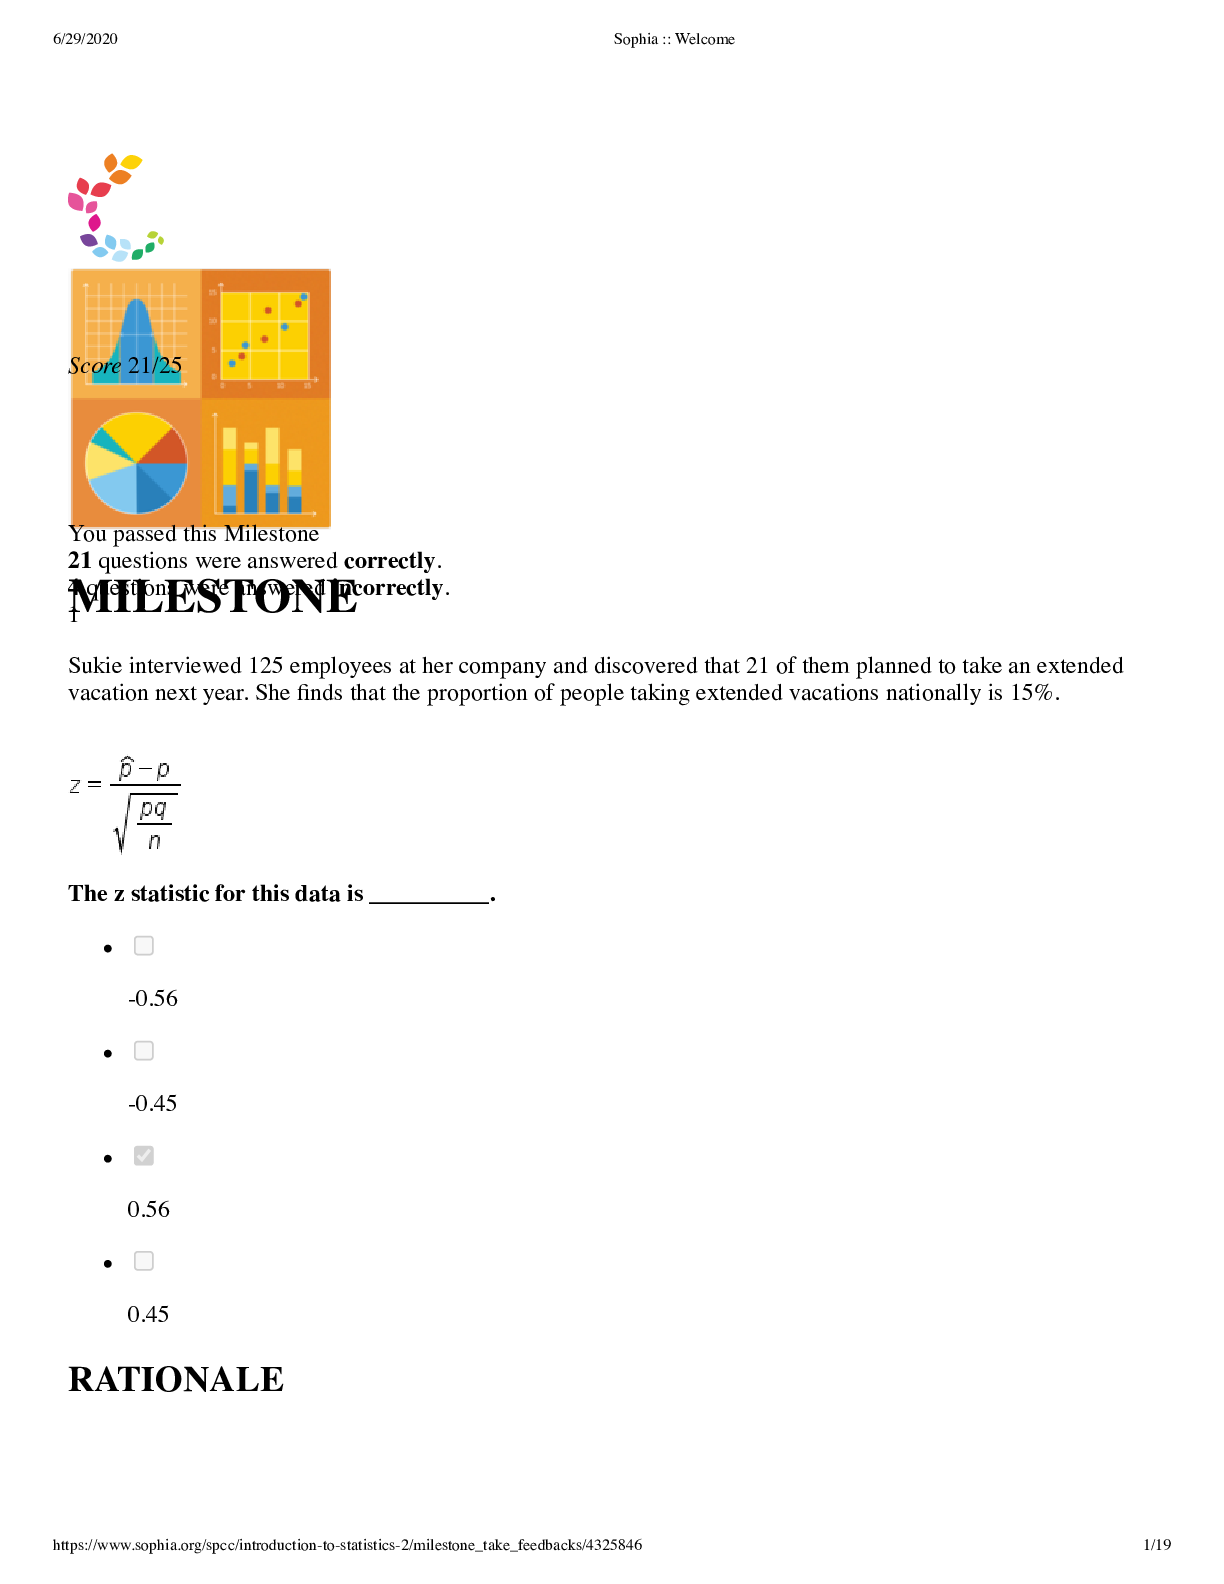
SOPHIA STATISTICS FINAL MILESTONE WITH RATIONALE AND CONCEPT |...
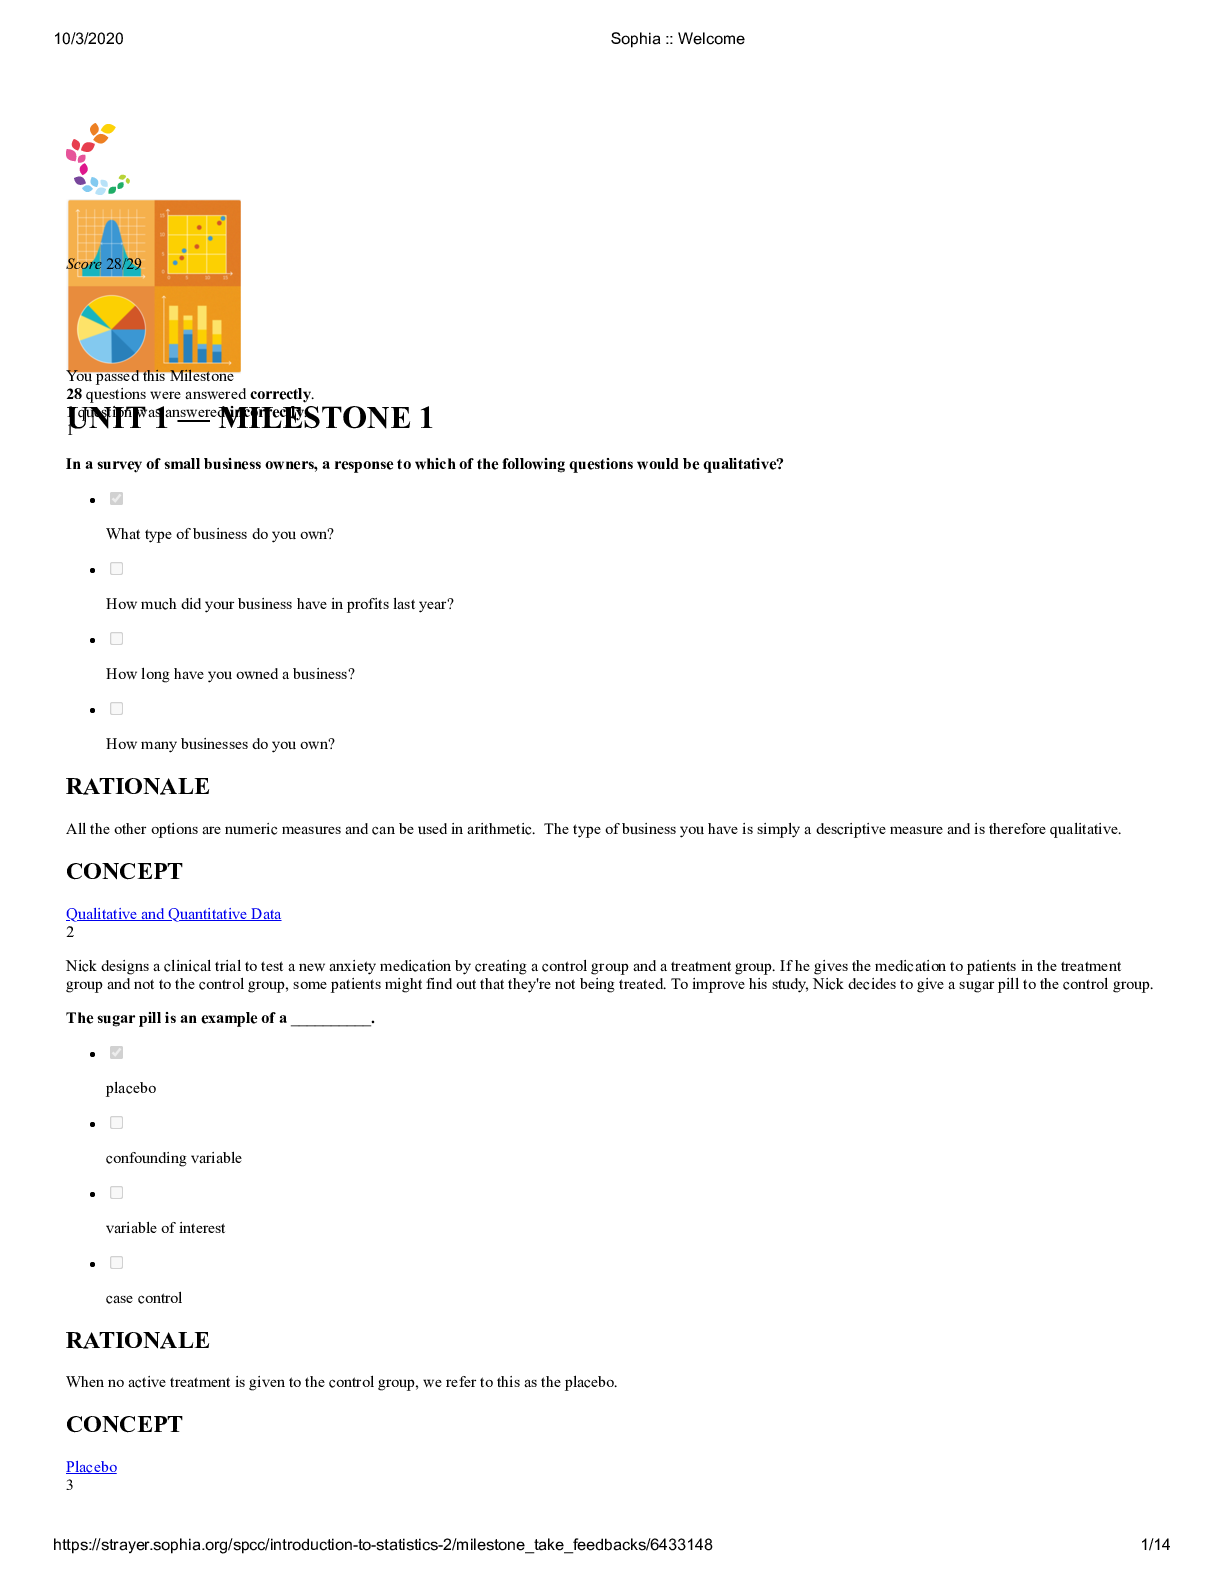
Sophia Milestone Stats UNIT 1 MILESTONE 1 | 28 questions answe...