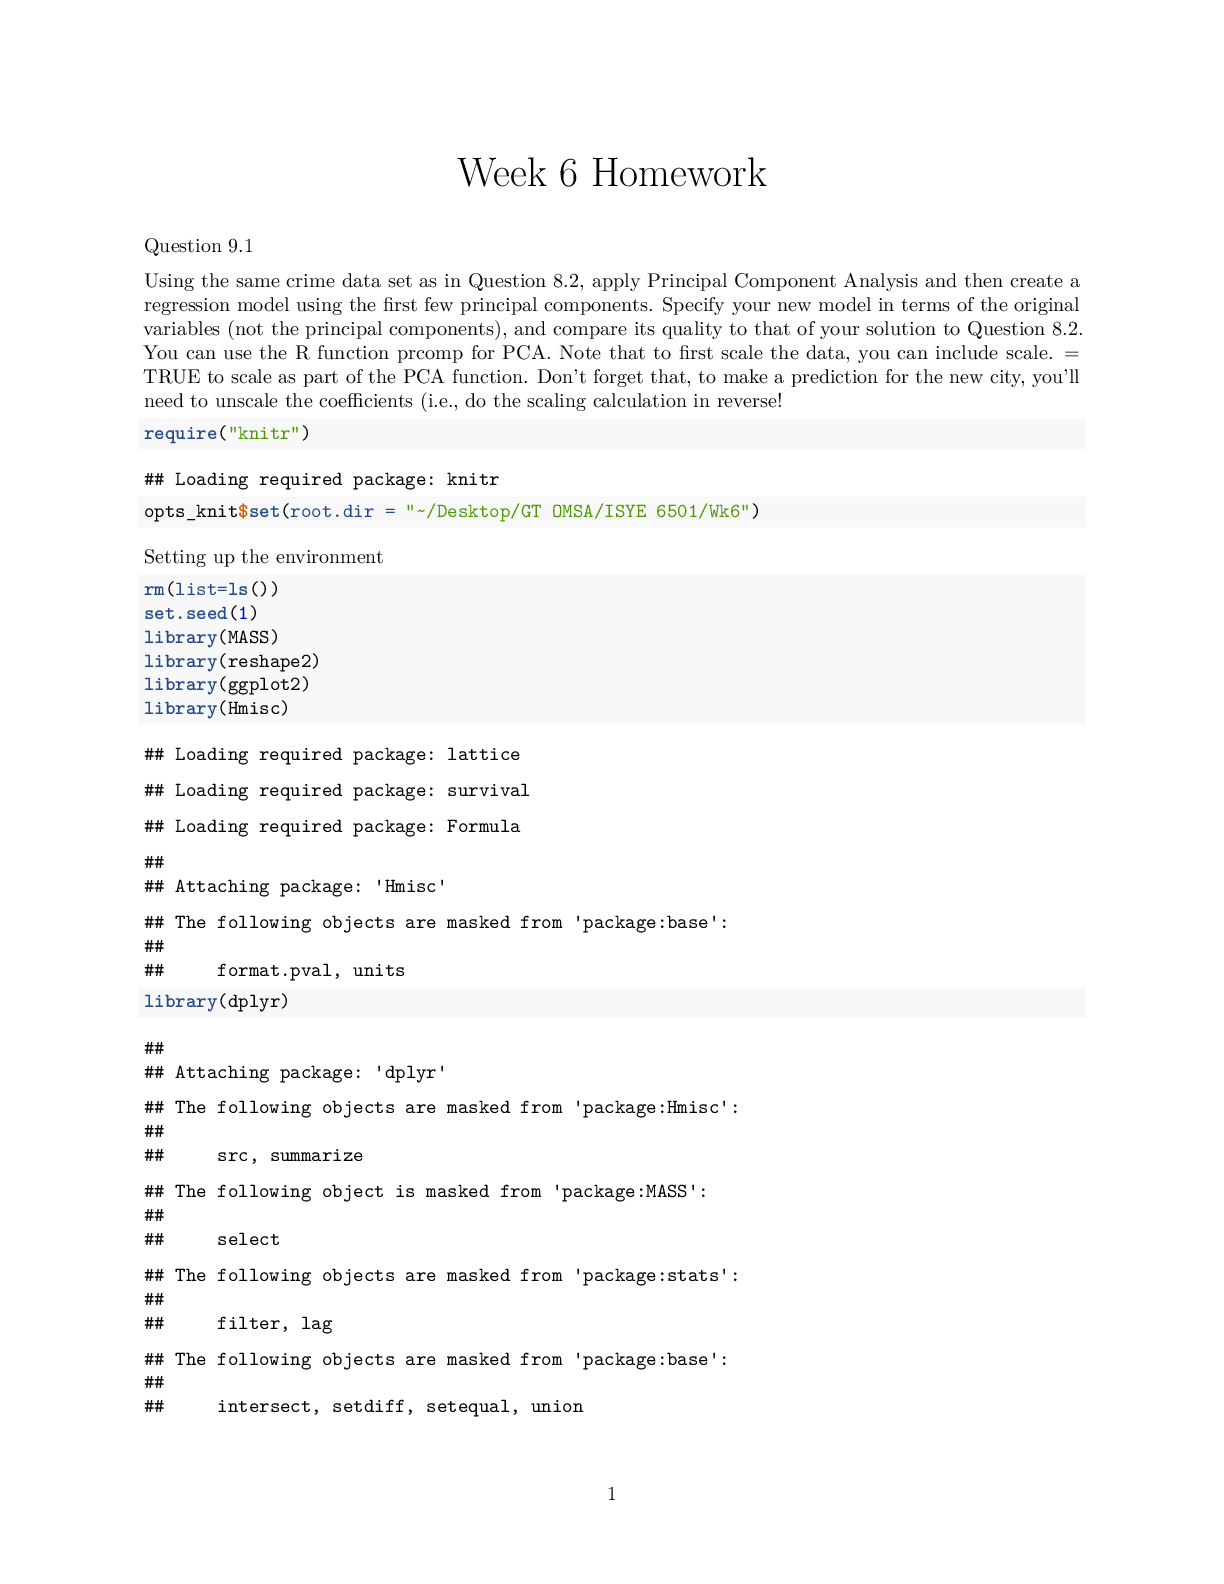
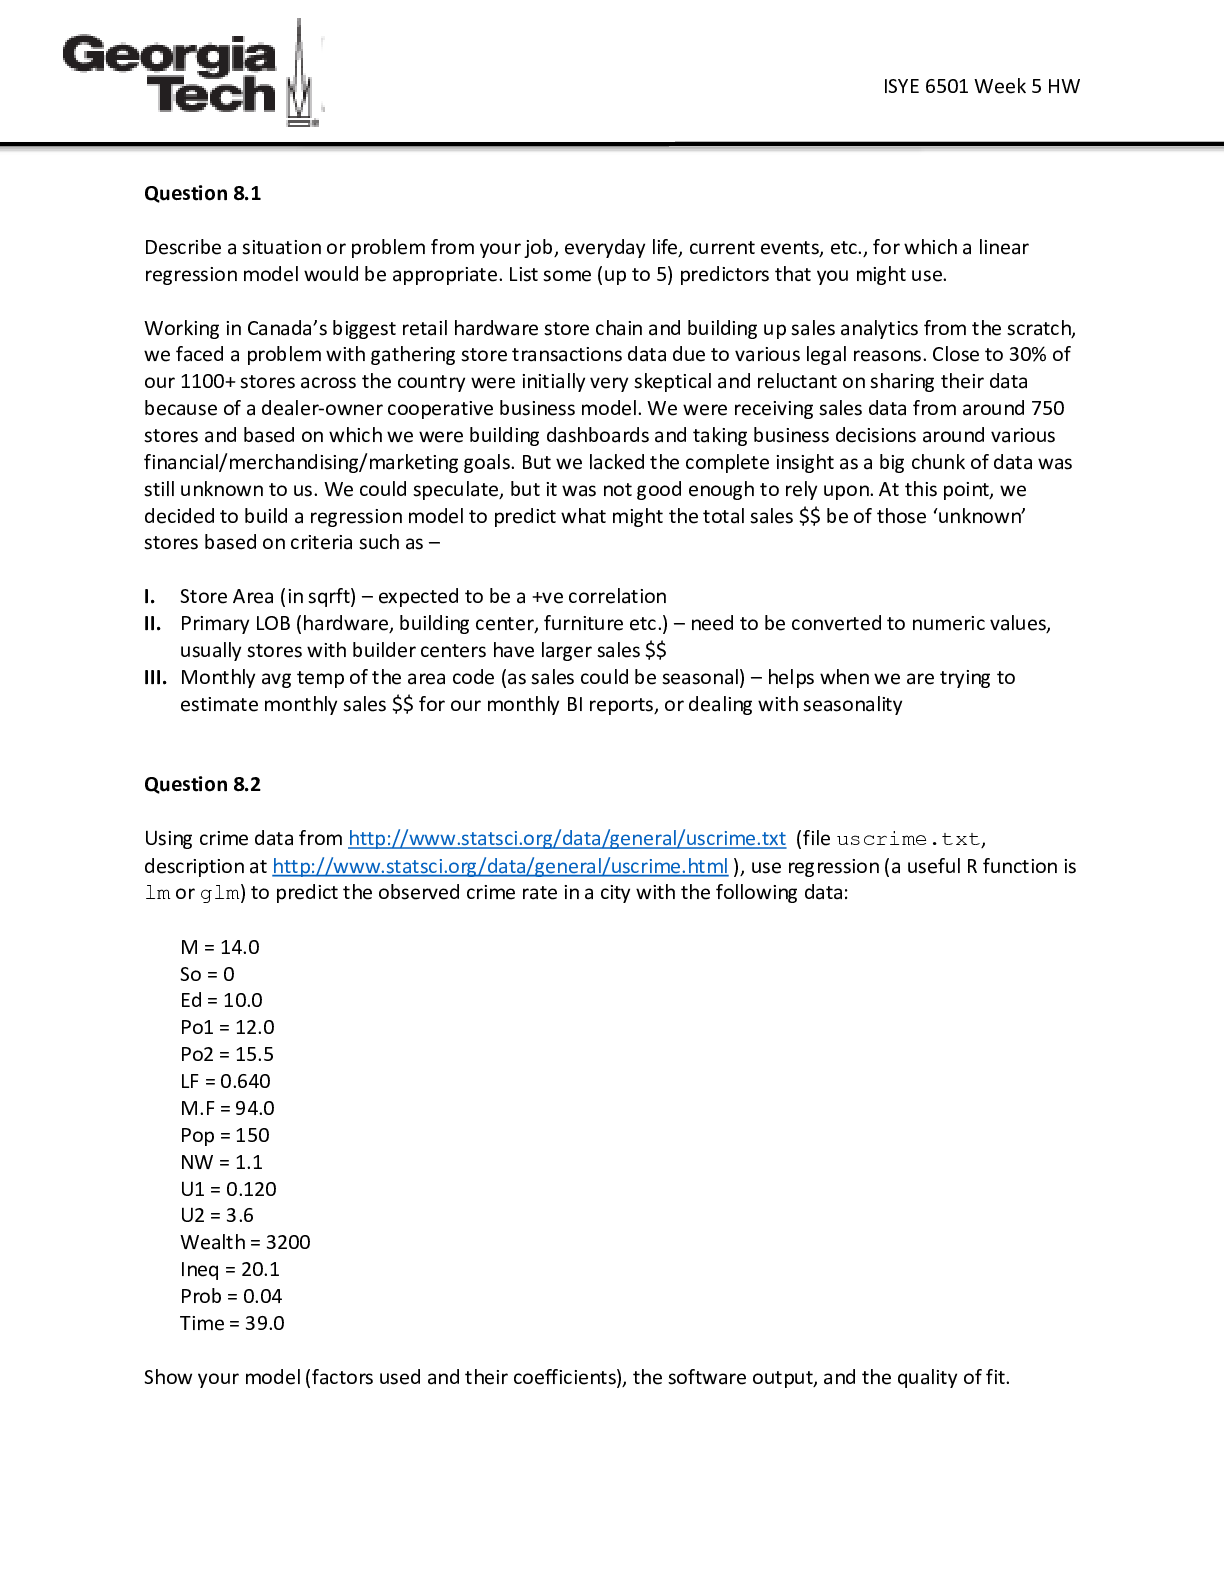
Information Technology > QUESTIONS & ANSWERS > Georgia Institute Of Technology ISYE 6501 Homework 4 Complete Solutions - Introduction To Analytics (All)
Georgia Institute Of Technology ISYE 6501 Homework 4 Complete Solutions - Introduction To Analytics Modeling - GTX ISYE 6501
Document Content and Description Below
Last updated: 3 years ago
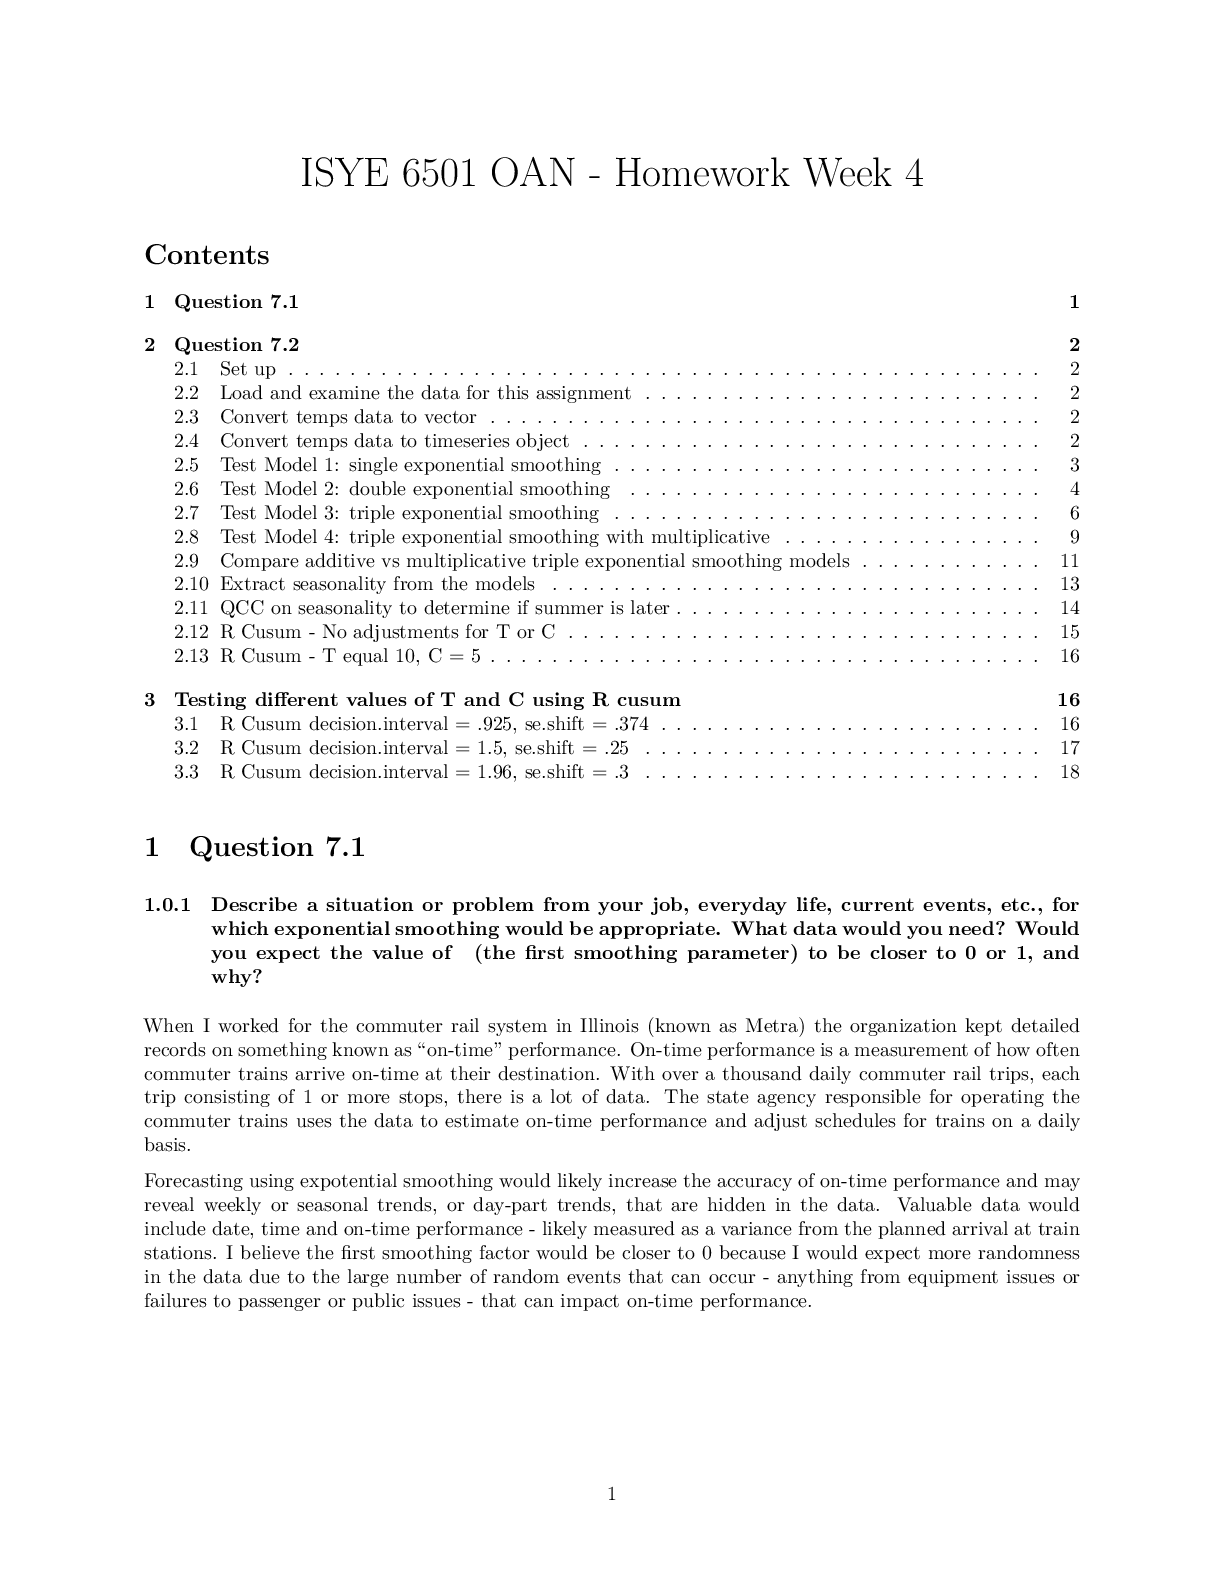
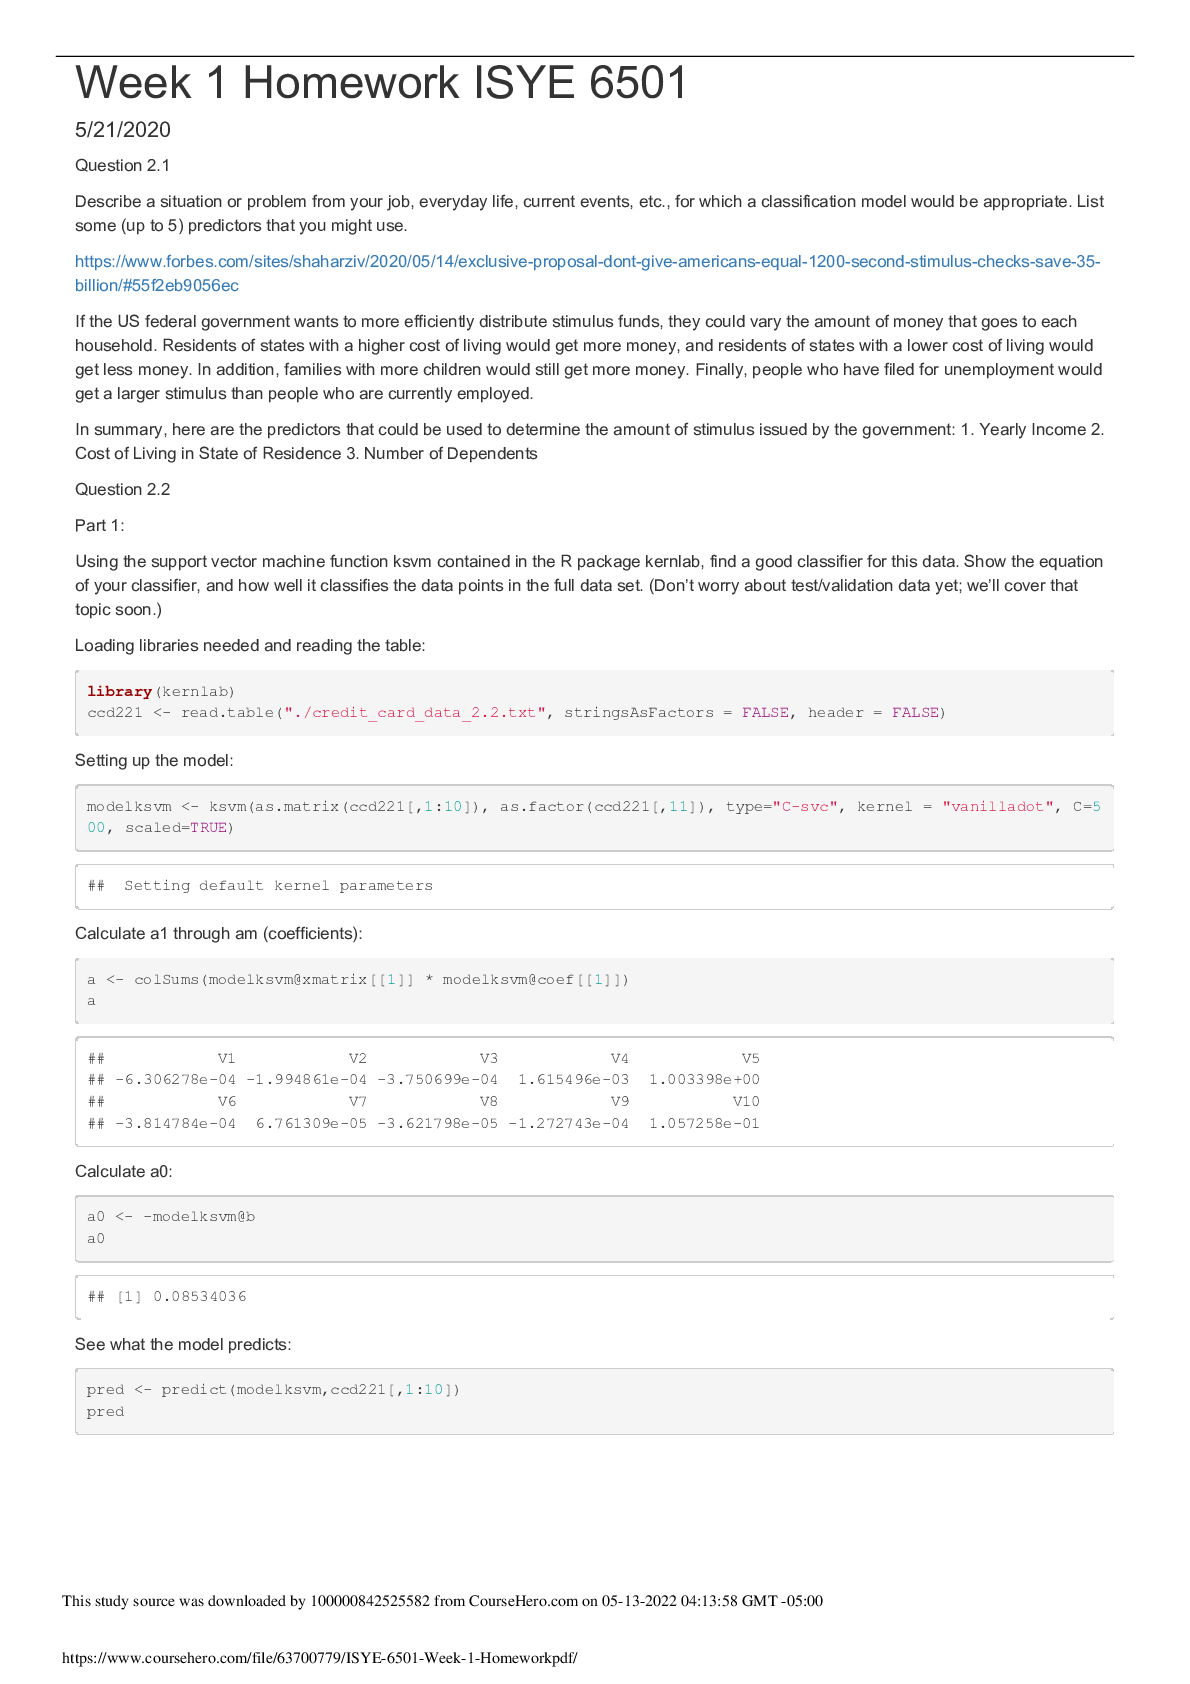
Preview 1 out of 19 pages
Instant download
Buy this Document to get the Full Access Instantly
Provided by Students Who Aced it
We Verify Document Content to Gurantee Accuracy
Also available in bundle (1)
Click Below to Access Bundle(s)
FULL COMPLETE COURSE FOR Georgia Institute Of Technology ISYE 6501 HOMEWORK 1, 2, 3, 4, 5, 6, 7, 8, 9, 10, 11, 12, 13, 14, 15, MIDTERM 1, MIDTERM 2 & FINAL EXAM (MULTIPLE VERSIONS) GT Students and Verified
FULL COMPLETE COURSE FOR Georgia Institute Of Technology ISYE 6501 HOMEWORK 1, 2, 3, 4, 5, 6, 7, 8, 9, 10, 11, 12, 13, 14, 15, MIDTERM 1, MIDTERM 2 & FINAL EXAM (MULTIPLE VERSIONS) GT Students and Ver...
By Tessa 4 years ago
$66
73
Reviews( 0 )
Document information
Connected school, study & course
About the document
Uploaded On
May 13, 2022
Number of pages
19
Written in
All

Additional information
This document has been written for:
Uploaded
May 13, 2022
Downloads
0
Views
160
Topic Tags
Recommended For You
Get more on QUESTIONS & ANSWERS »
Georgia Institute Of TechnologyISYE 6501GT Students _ Final Qu...
Georgia Institute Of Technology - ISYE 6501GT Students _ Final...

Georgia Institute Of TechnologyGeorgia Institute Of Technology...
Georgia Institute Of Technology - ISYE 6501XVerified Learners...

Georgia Institute Of TechnologyGeorgia Institute Of Technology...

Georgia Institute Of TechnologyISYE 6501Midterm Quiz 1 with Co...
Georgia Institute Of TechnologyISYE 6501XVerified Learners _ F...
Georgia Institute Of TechnologyISYE 6501Midterm Quiz 1 with Co...
Georgia Institute Of TechnologyISYE 6501XMidterm Quiz 2 - GT S...
Georgia Institute Of Technology - ISYE 6501XMidterm Quiz 2 - G...
Georgia Institute Of TechnologyISYE 6501Final Quiz - Summer 20...
Georgia Institute Of Technology - ISYE 6501ISyE 6501 Introduct...

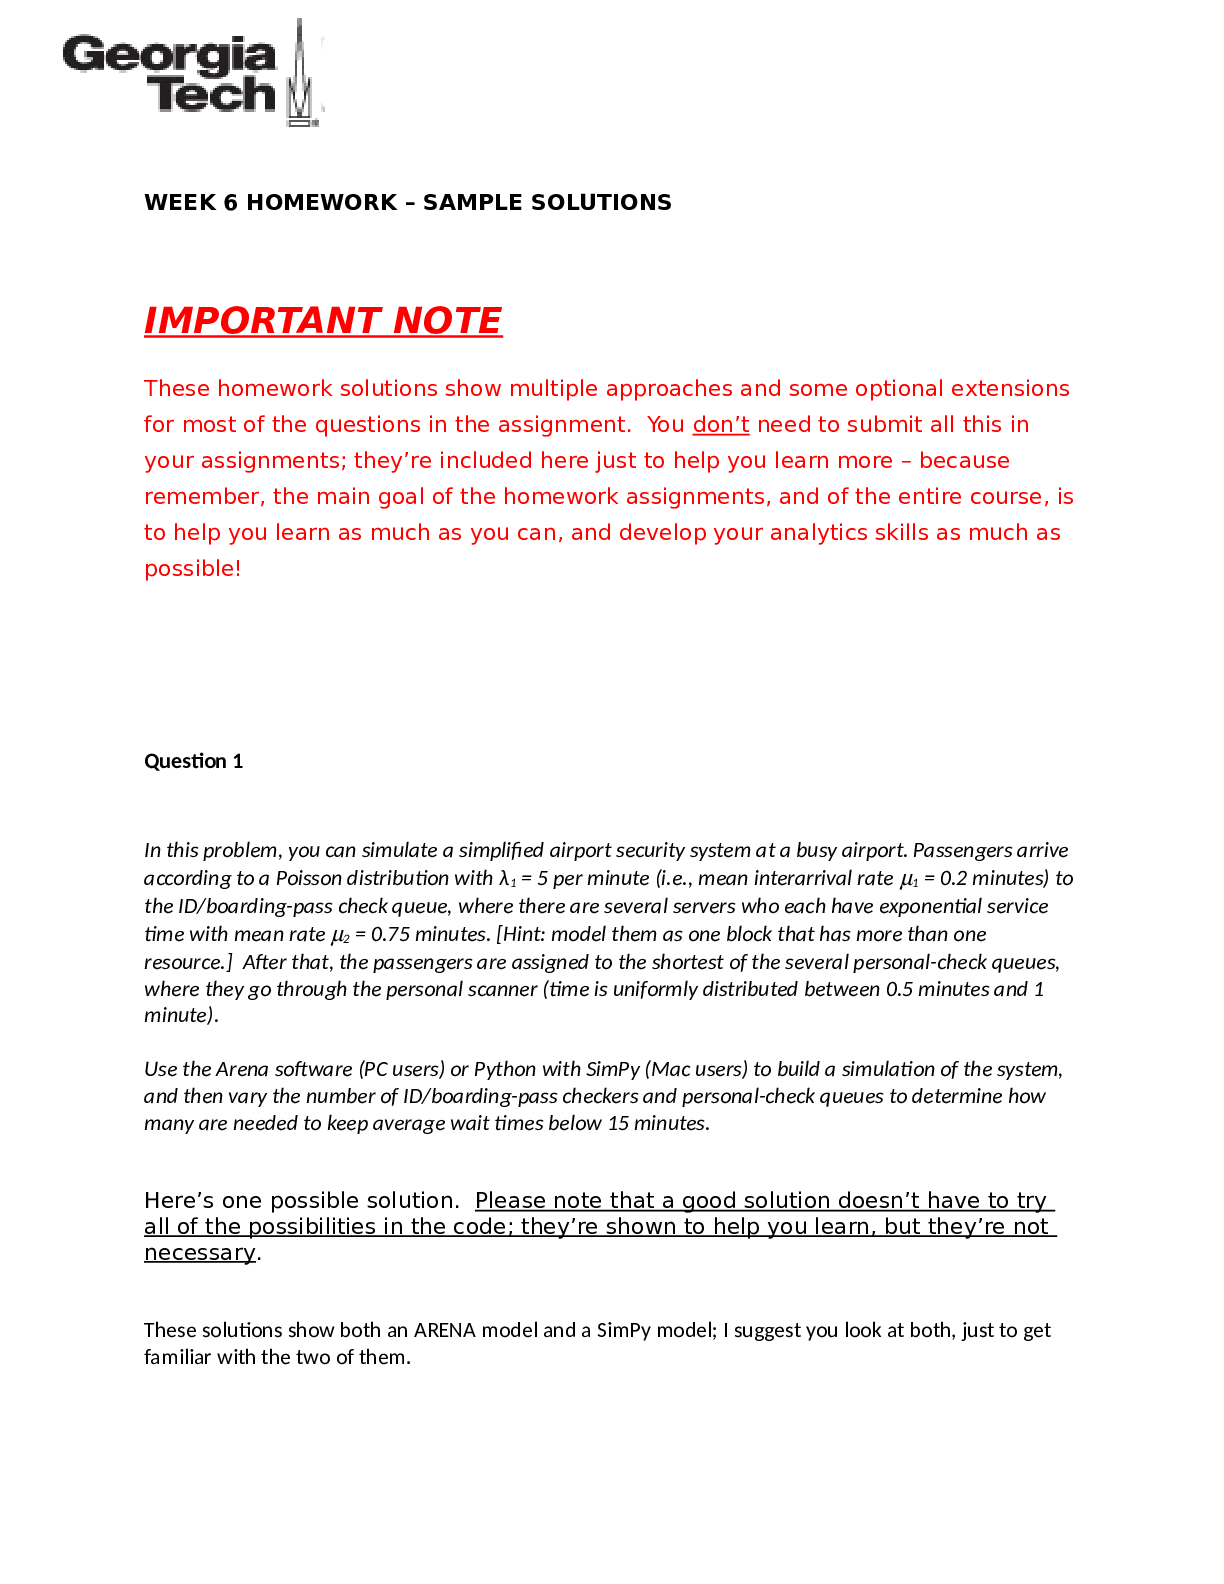
13-week_6_hw_solutions Georgia Institute Of Technology - ISYE...

Georgia Institute Of Technology - ISYE 6501AD_HW4_Full 2020

Georgia Institute Of Technology - ISYE 6501hw4 ( ALL SOLUTIONS...

Harnessing Analytics to Market Banking Products and Services M...