Statistics > QUESTIONS & ANSWERS > Sophia __ Intro to Stats Unit 2 Milestone 2 Latest Update Already Passed (All)
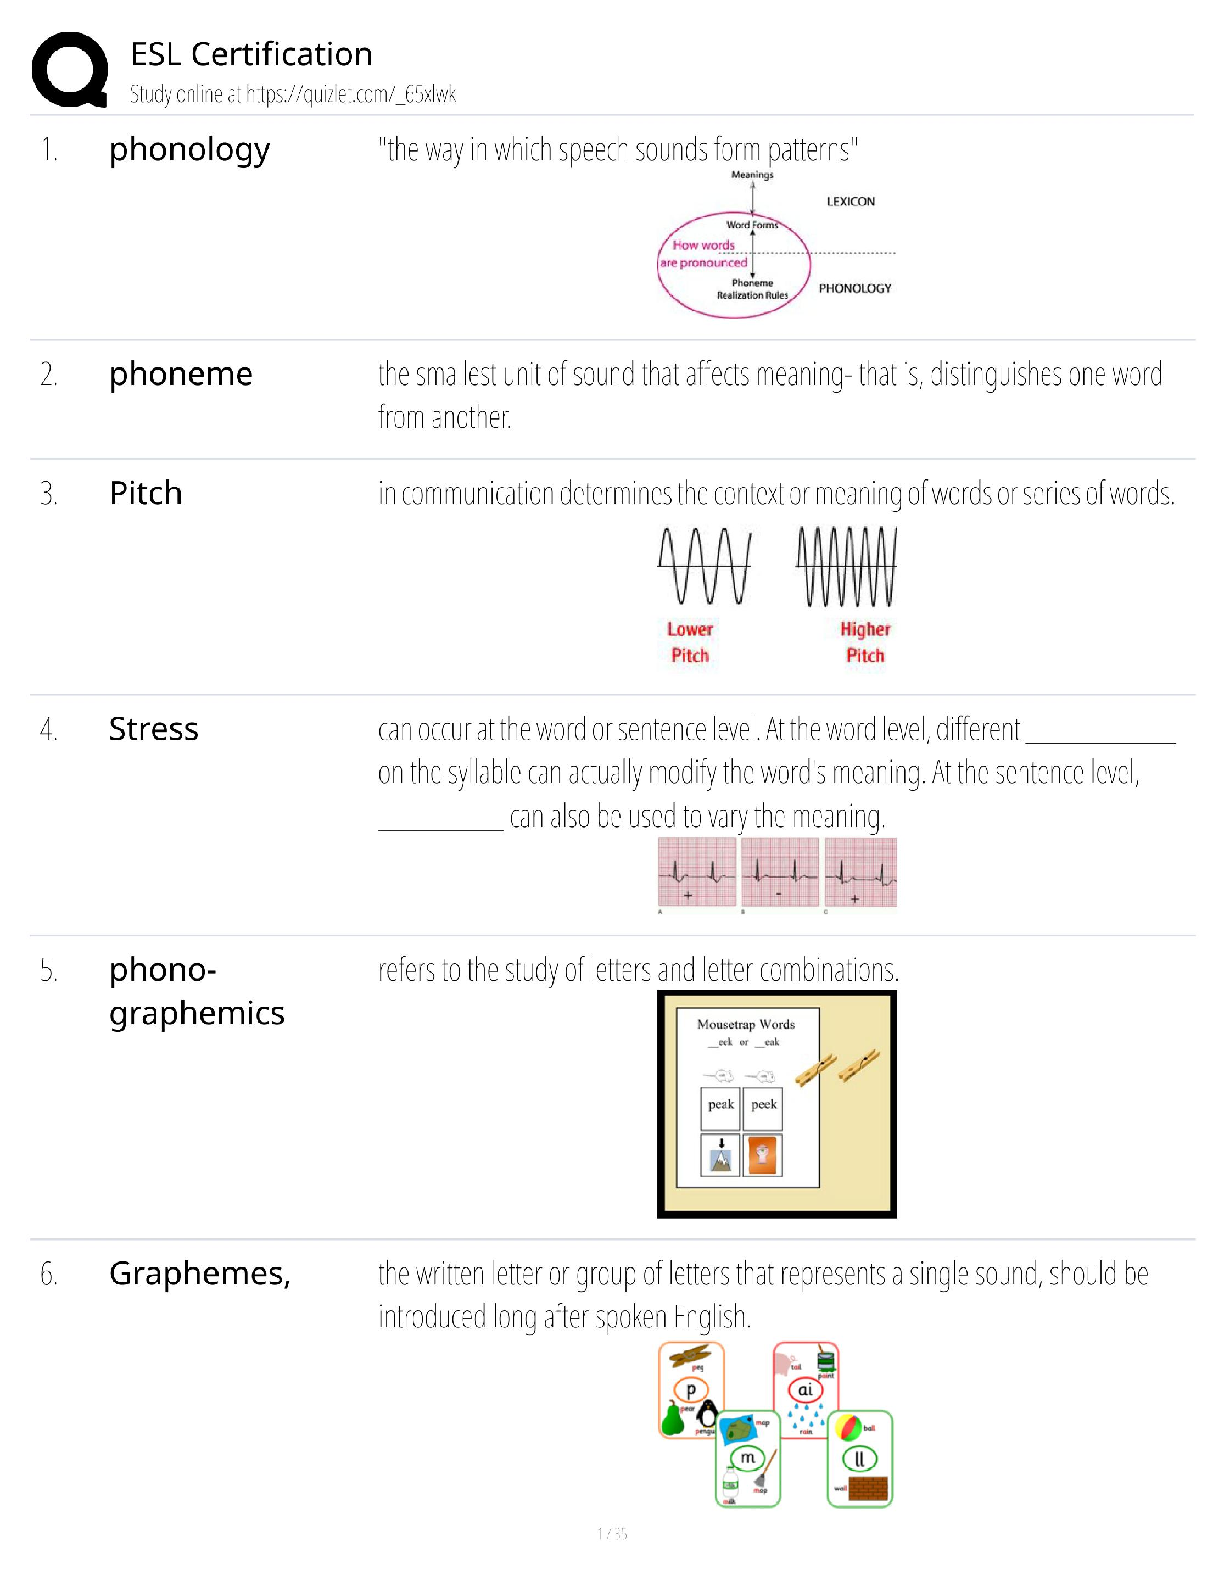
Sophia __ Intro to Stats Unit 2 Milestone 2 Latest Update Already Passed
Document Content and Description Below
24 questions were answered correctly. 2 questions were answered incorrectly. 1 In which of these cases should the median be used? When the data has small variance When data has no outliers When ... the data has extreme values When the data has nominal values RATIONALE Since the mean uses the actual values in the data, it is most affected by outliers and skewness. So, we only want to use the mean when the data is symmetric as a measure of centrality. When the data is skewed or has extreme values, the median is a better measure since it is not as sensitive to these values. CONCEPT Measures of Center 2 Consider the times (in seconds) that it took children and adults to solve a Rubik’s cube at a competition. What does the circled section represent? 21 children completed the Rubik's cube in 7 minutes. One child solved the Rubik's cube in 21.7 seconds. One child took 72 seconds to solve the Rubik's cube, while another took 71 seconds to solve it. 21 children completed the Rubik's cube in 7 seconds. RATIONALE If we recall that the stem and leaf can give us the actual values in the dataset, then the circle corresponds to 71 and 72. We can then note that there are 2 children who solved the Rubik's cube at 71 and 72 seconds. CONCEPT Stem-and-Leaf Plots 3 The first quartile (Q1) value from the above box plot is __________. 54 65 40 47 RATIONALE Note the value for Q1 is the left edge of the box, which is 47. CONCEPT Five Number Summary and Boxplots 4 The formula for the standard deviation of a sample is: Select the true statement for the following data set that has a mean of 6.75: 4, 6, 7, 10 Answer choices are rounded to the hundredths place. The variance is 6.25 and the standard deviation is 2.50. The variance is 4.71 and the standard deviation is 2.17. The variance is 2.50 and the standard deviation is 6.50. The variance is 6.75 and the standard deviation is 6.25. RATIONALE We can first calculate the variance of the data, , by using the part of the formula under the square root: Next, we can find the standard deviation, , by simply taking the square root of the variance: We can also use the statistical functions in Excel to quickly find the variance and standard deviation. CONCEPT Standard Deviation 5 At Brent's school, the final grade for his U.S. History course is weighted as follows: Tests: 30% Quizzes: 50% Homework: 20% Brent has an average of 82% on his tests, 94% on his quizzes, and 50% on his homework. [Show More]
Last updated: 3 years ago
Preview 1 out of 19 pages

Buy this document to get the full access instantly
Instant Download Access after purchase
Buy NowInstant download
We Accept:

Also available in bundle (1)
Click Below to Access Bundle(s)

Sophia __ Intro to Stats Unit 1, 2,3, 4, and 5 Milestones Questions and Answers Latest Updated Already Passed
You passed this Milestone 22 questions were answered correctly. 2 questions were answered incorrectly. 1 Mrs. Pellegrin has weighed 5 packages of cheese and recorded the weights as 10.2 oz, 10.5 o...
By Nutmegs 3 years ago
$30
5
Reviews( 0 )
$13.00
Can't find what you want? Try our AI powered Search
Document information
Connected school, study & course
About the document
Uploaded On
Jun 23, 2022
Number of pages
19
Written in
All

Additional information
This document has been written for:
Uploaded
Jun 23, 2022
Downloads
0
Views
137


.png)