Mathematics > DISCUSSION POST > MATH 221 Week 2 Discussion Post (All)
MATH 221 Week 2 Discussion Post
Document Content and Description Below
Last updated: 3 years ago
Preview 1 out of 2 pages
Instant download
Buy this Document to get the Full Access Instantly
Provided by Students Who Aced it
We Verify Document Content to Gurantee Accuracy
Also available in bundle (1)
Click Below to Access Bundle(s)

MATH 221 Statistics For Decision Making [Entire Course Week 1 – 8] BUNDLED | 100% CORRECT SOLUTIONS | LATEST UPDATE
MATH 221 Week 1 Homework (Collection) MATH-221 Week 1 Quiz (100% Correct Collection) MATH 221 Week 1 Discussion: Posts MATH-221 Week 1 Lesson MATH 221 Week 2 Homework (Collection) MATH-221 Week...
By BestSeller_ScholarFriends 3 years ago
$14.5
38
Reviews( 0 )
Document information
Connected school, study & course
About the document
Uploaded On
Jul 19, 2022
Number of pages
2
Written in
All
Seller

Reviews Received
Additional information
This document has been written for:
Uploaded
Jul 19, 2022
Downloads
0
Views
174
Document Keyword Tags
Recommended For You
Get more on DISCUSSION POST »

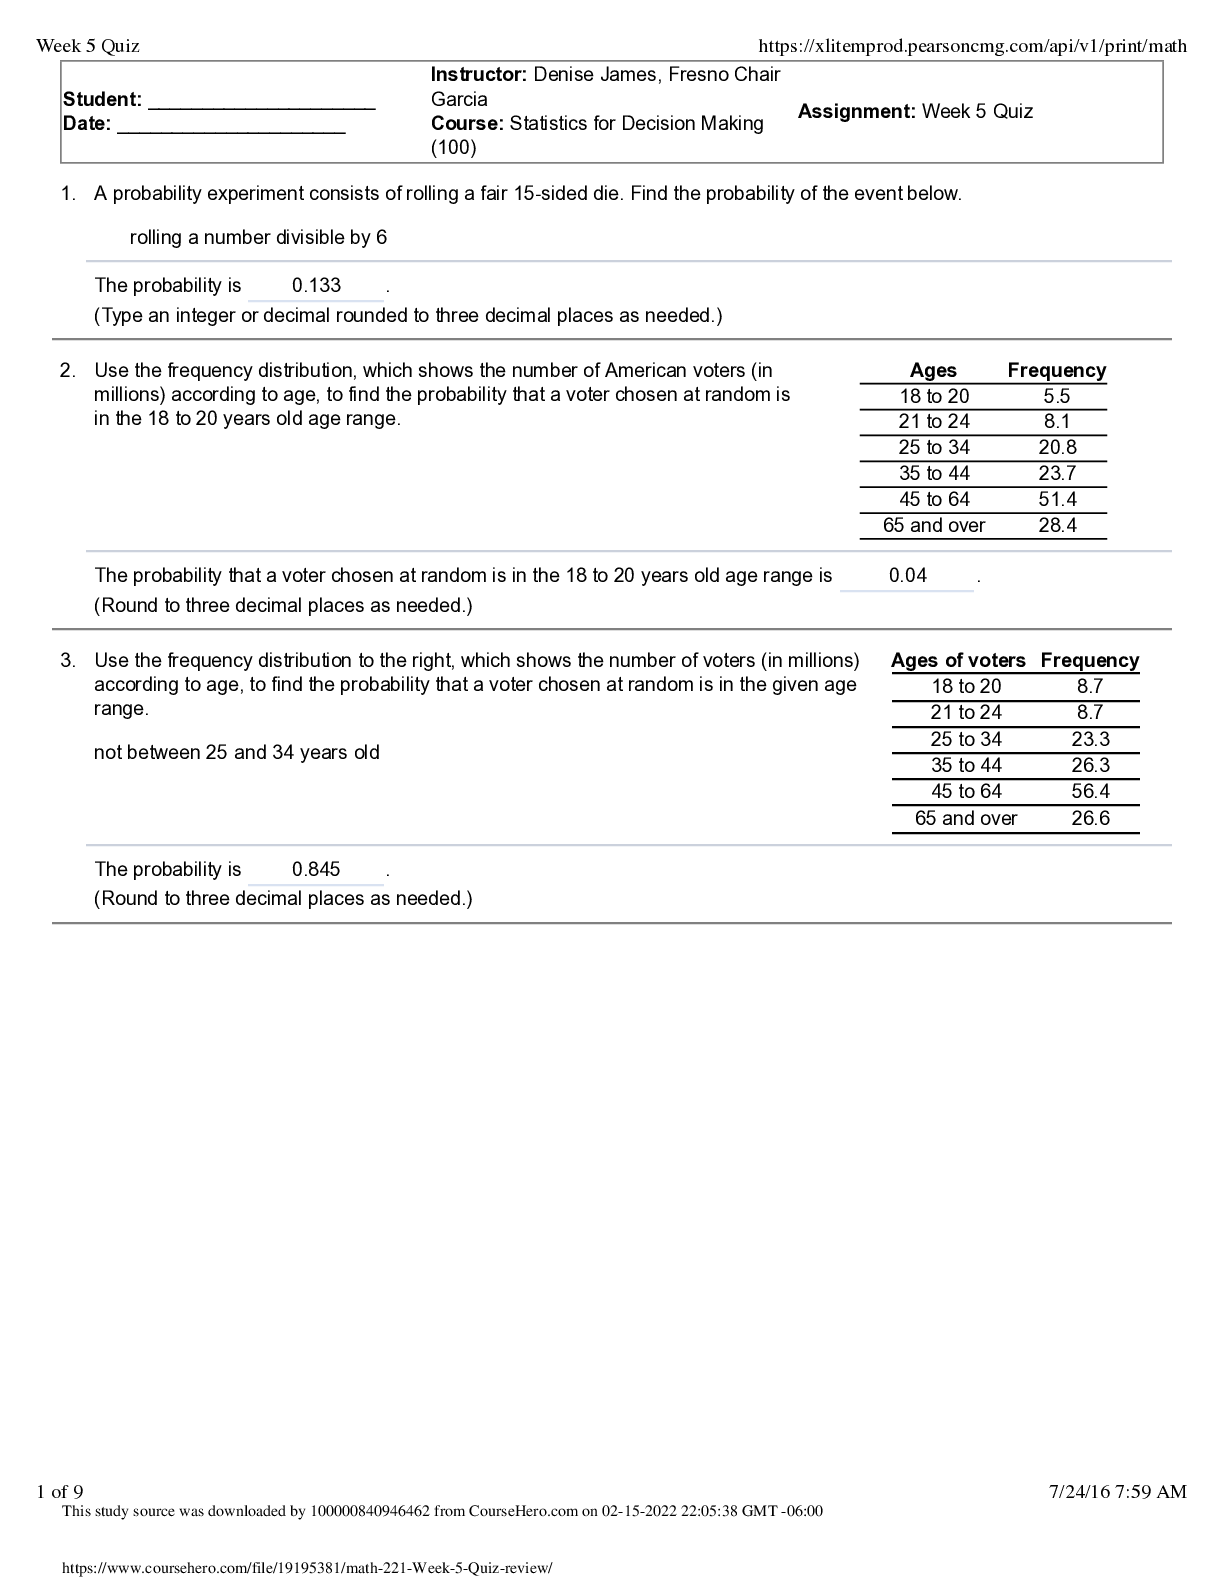
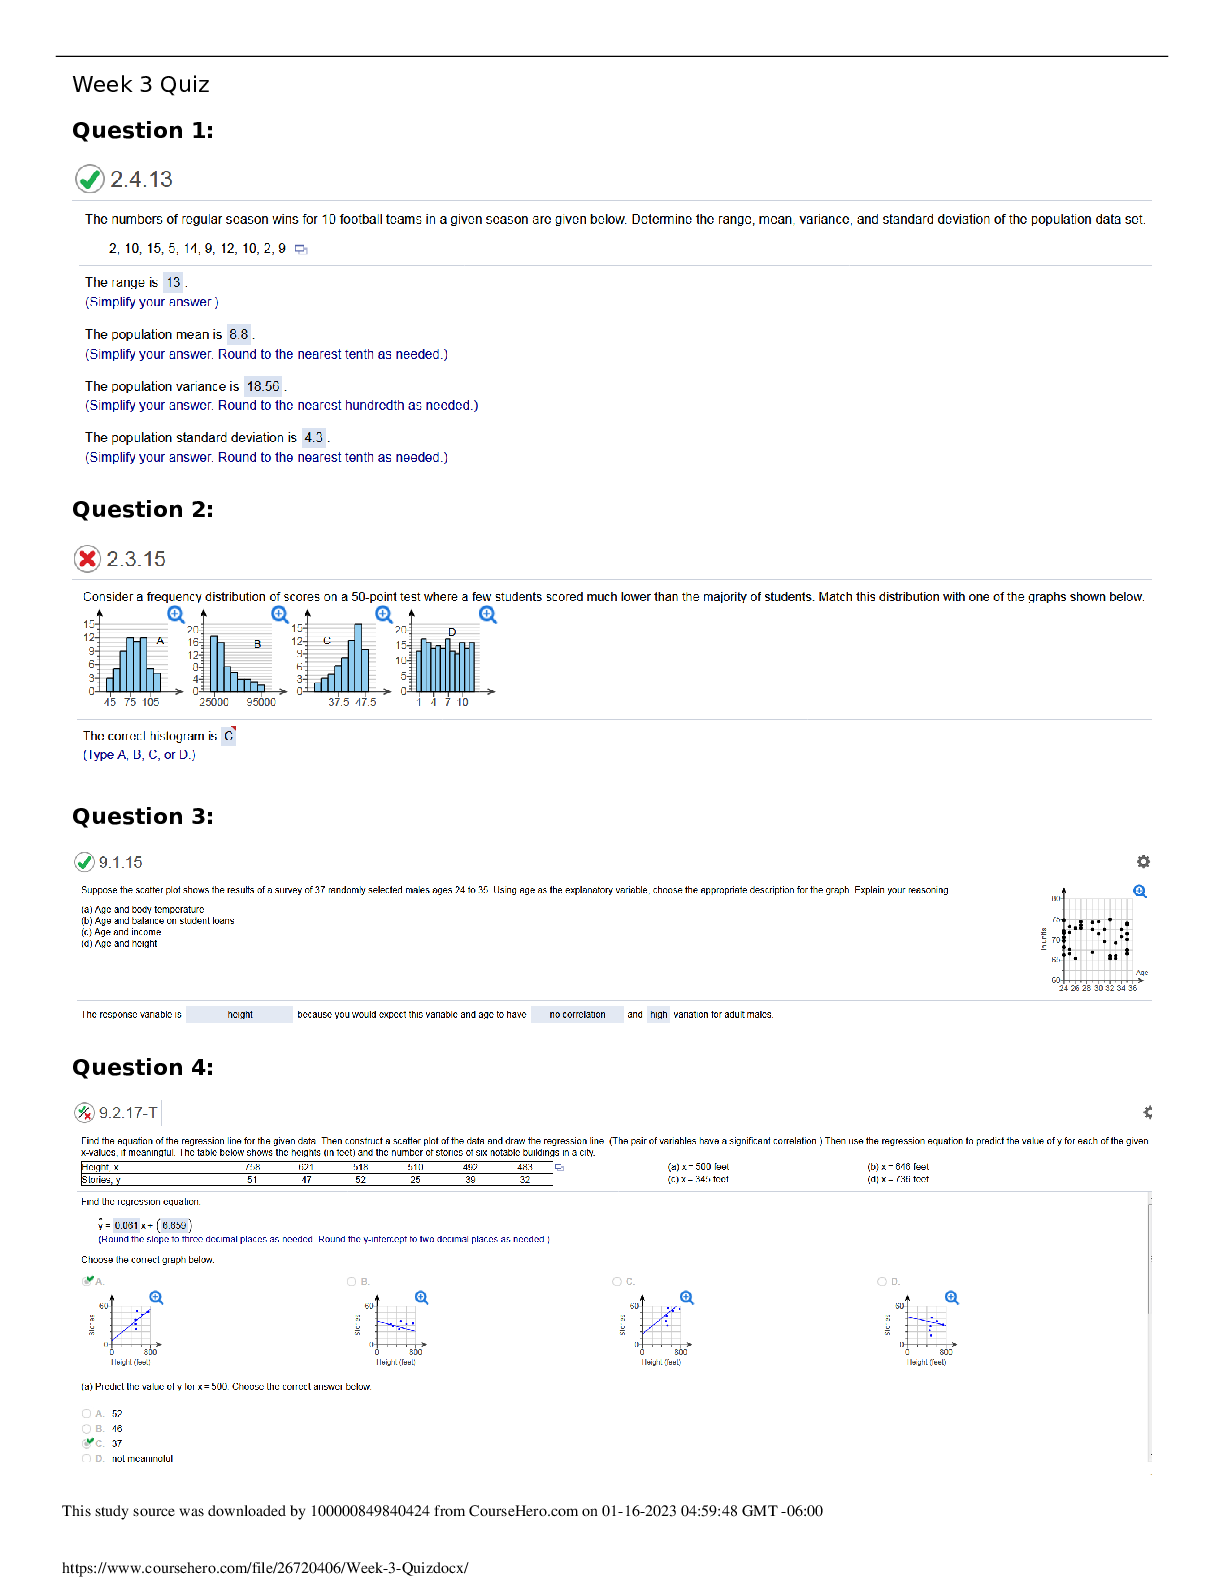

MATH 221 Statistics for Decision Making Week 3 Quiz, Devry Uni...
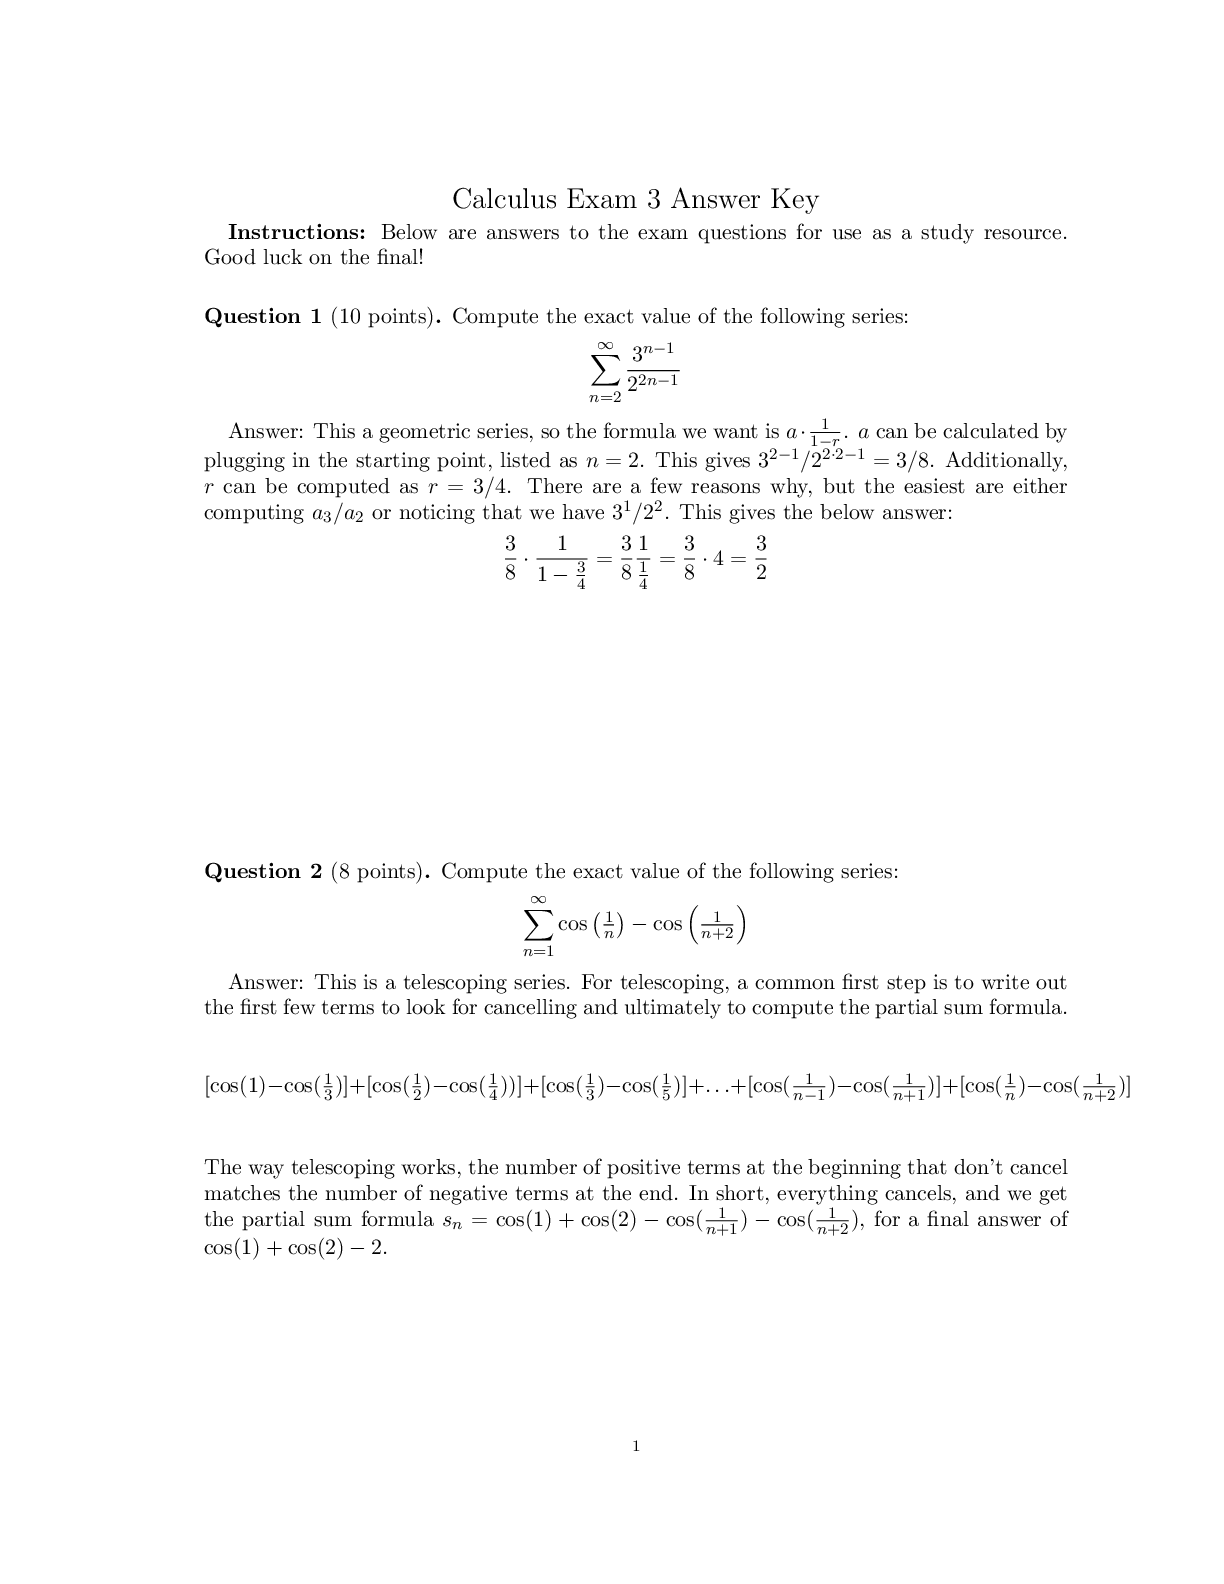
MATH 2212 Exam 3 Answer Key | Questions and Answers (Complete...
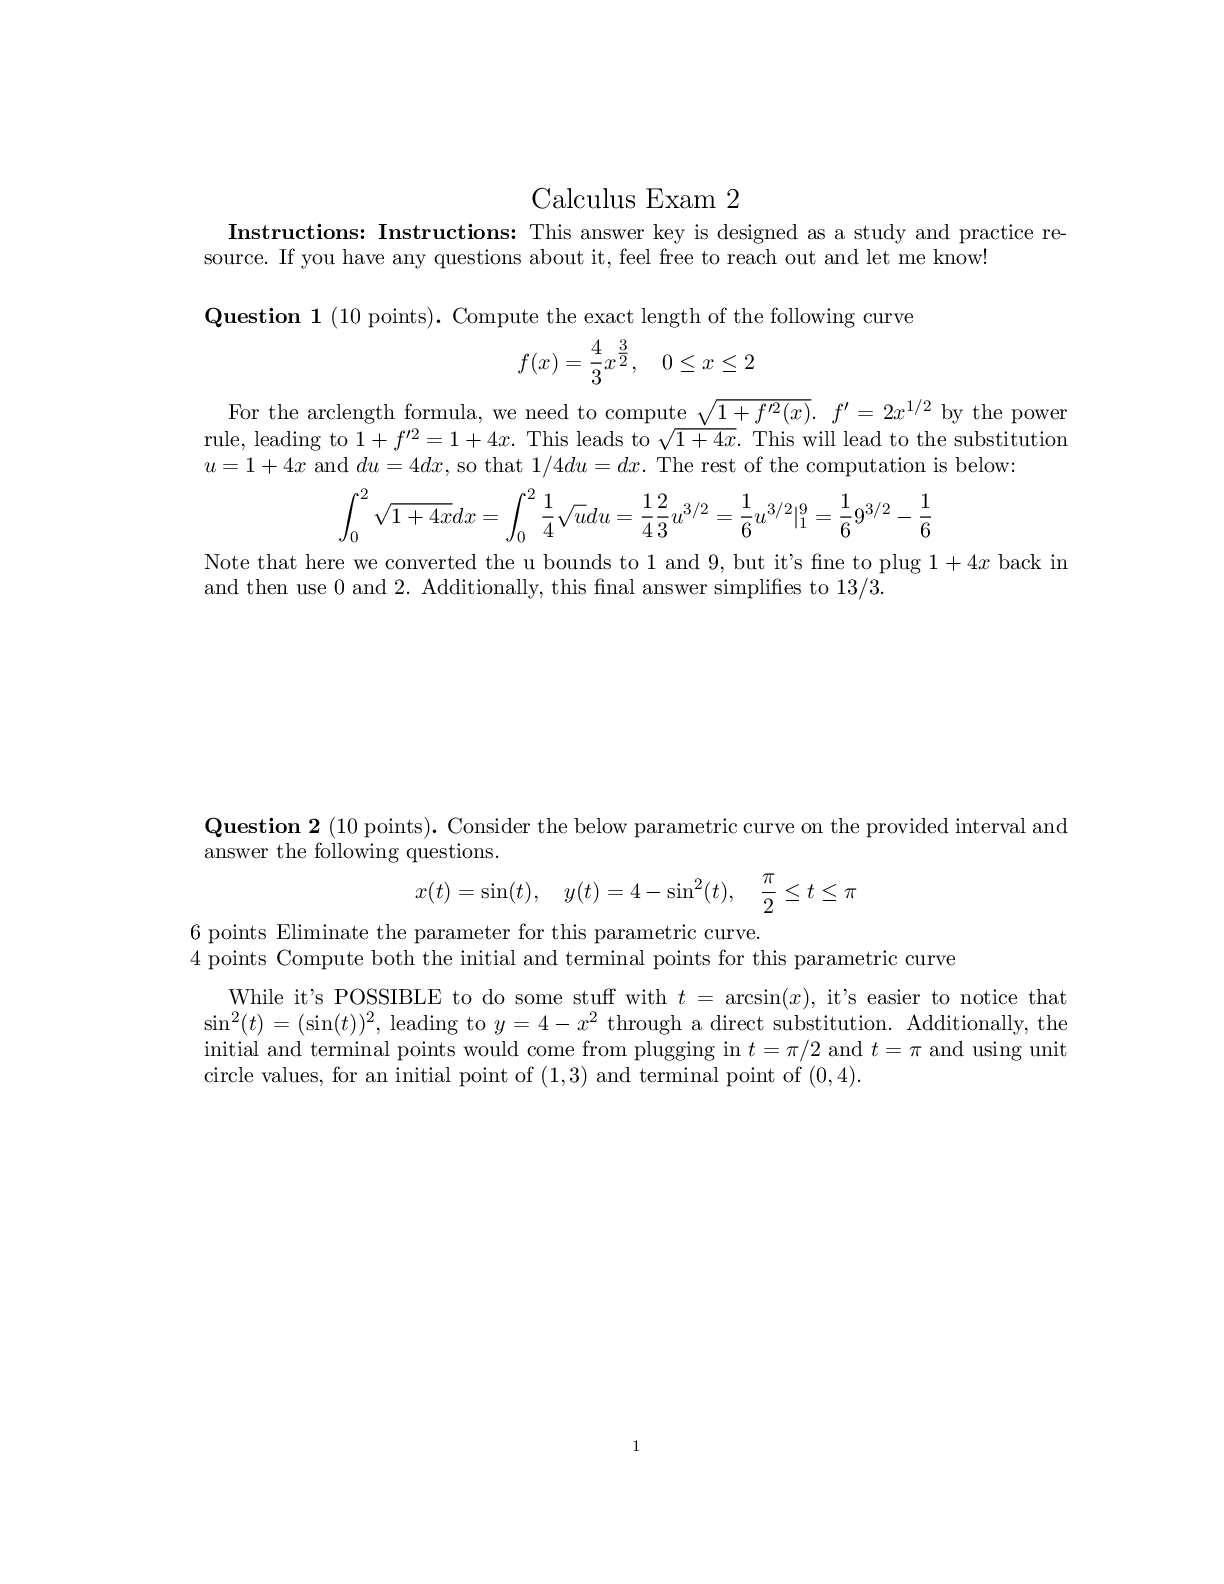

MATH 221 Homework Week 6 Attempt Score 40/40 | DeVry Universi...

Georgia State UniversityMATH 2212Calc II Chapter 6.2--Volumes...

Solution Manual for A First Course in Probability 10th Edition...
Solutions Manual for Precalculus 11th Edition By Michael Sulli...

Solutions Manual For Applied Linear Algebra By Peter J. Olver,...

Solution Manual for A First Course in Probability 10th Edition...

Solutions Manual For A First Course in Probability 9th Edition...

eBook Fractional Integrals, Potentials, and Radon Transforms 2...
![Preview of eBook [PDF] Elementary Geometry for College Students 7th Edition By Daniel C. Alexander, G](https://browseimages.nyc3.digitaloceanspaces.com/paper-images/2026/05/19/FNuoi4Be2026-05-19-11-446a0ccbcb69aa3.png)