Information Technology > QUESTIONS & ANSWERS > ISYE 6501 -Homework_8 (1) (All)
ISYE 6501 -Homework_8 (1)
Document Content and Description Below
Last updated: 3 years ago
Preview 1 out of 27 pages
Instant download
Buy this Document to get the Full Access Instantly
Provided by Students Who Aced it
We Verify Document Content to Gurantee Accuracy
Reviews( 0 )
Document information
Connected school, study & course
About the document
Uploaded On
Jul 22, 2022
Number of pages
27
Written in
All

Additional information
This document has been written for:
Uploaded
Jul 22, 2022
Downloads
0
Views
60
Document Keyword Tags
Recommended For You
Get more on QUESTIONS & ANSWERS »
Georgia Institute Of TechnologyISYE 6501GT Students _ Final Qu...
Georgia Institute Of Technology - ISYE 6501GT Students _ Final...

Georgia Institute Of TechnologyGeorgia Institute Of Technology...
Georgia Institute Of Technology - ISYE 6501XVerified Learners...
Georgia Institute Of TechnologyISYE 6501Midterm Quiz 1 with Co...
Georgia Institute Of TechnologyISYE 6501XVerified Learners _ F...
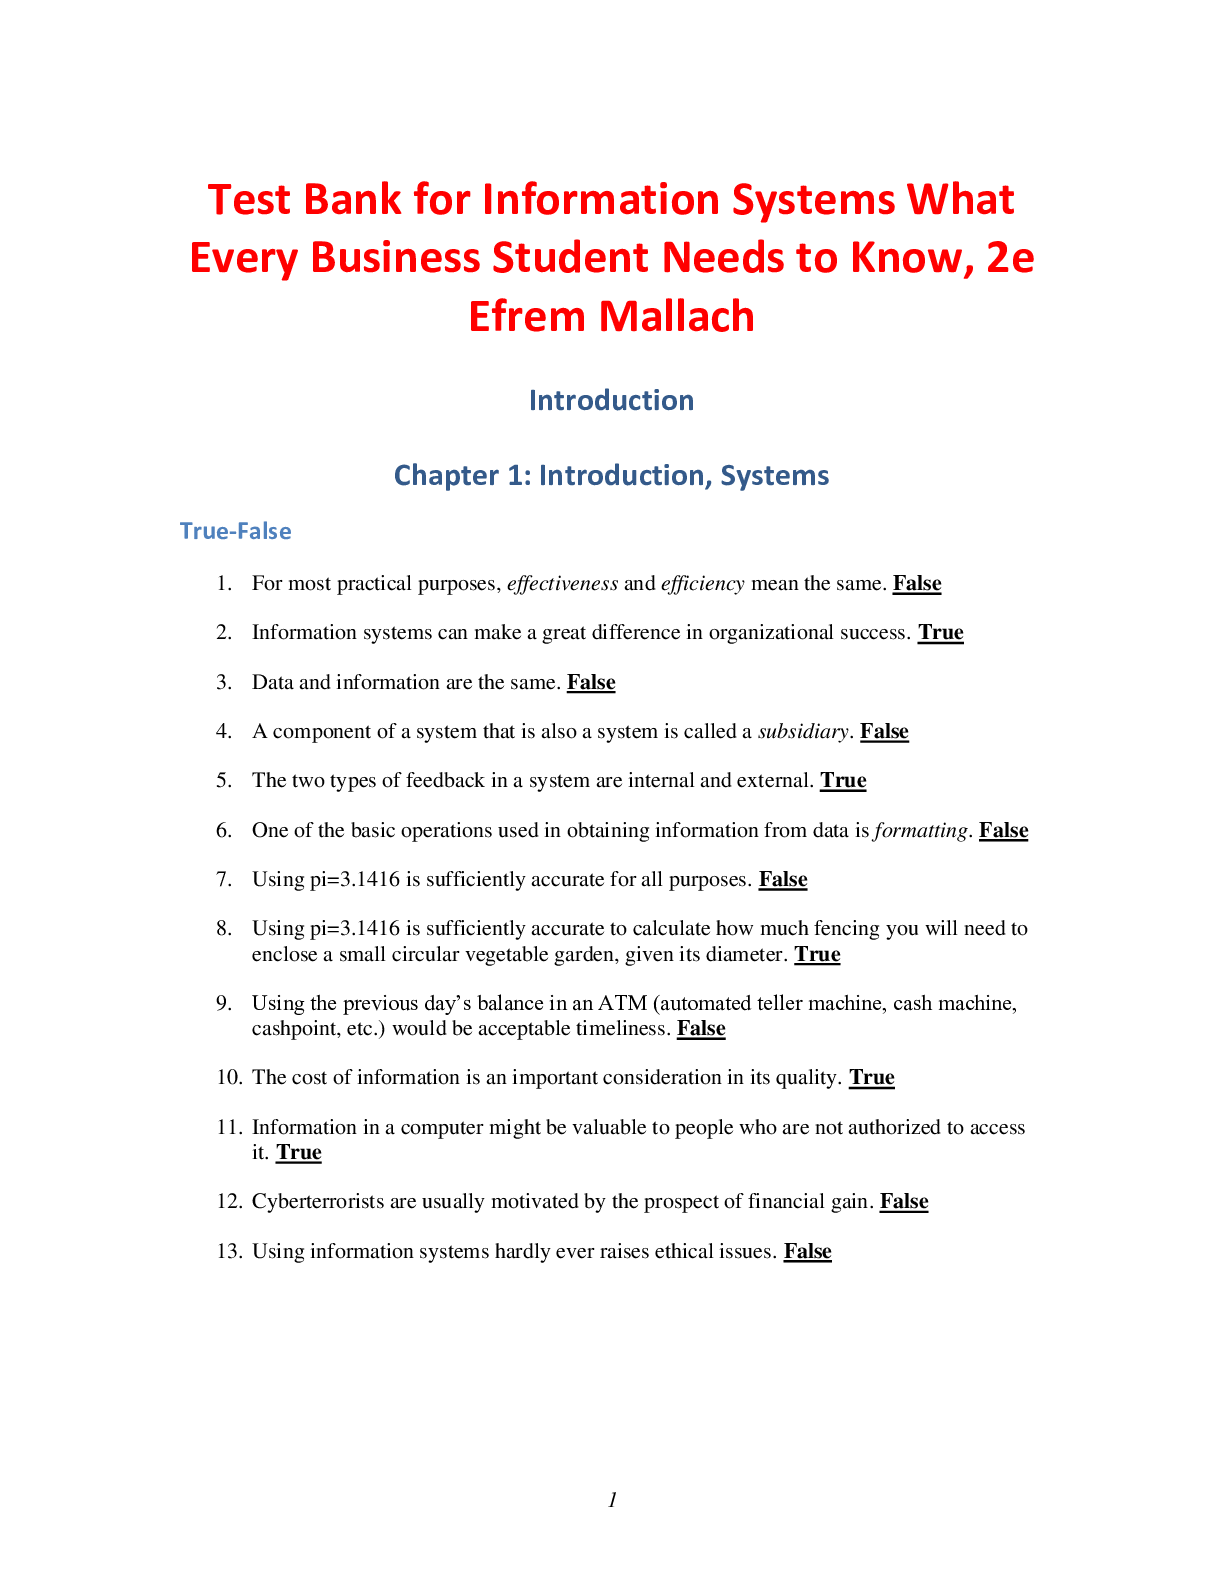
Information Systems What Every Business Student Needs to Know,...
.png)
Information Technology for Management Advancing Sustainable, P...
.png)