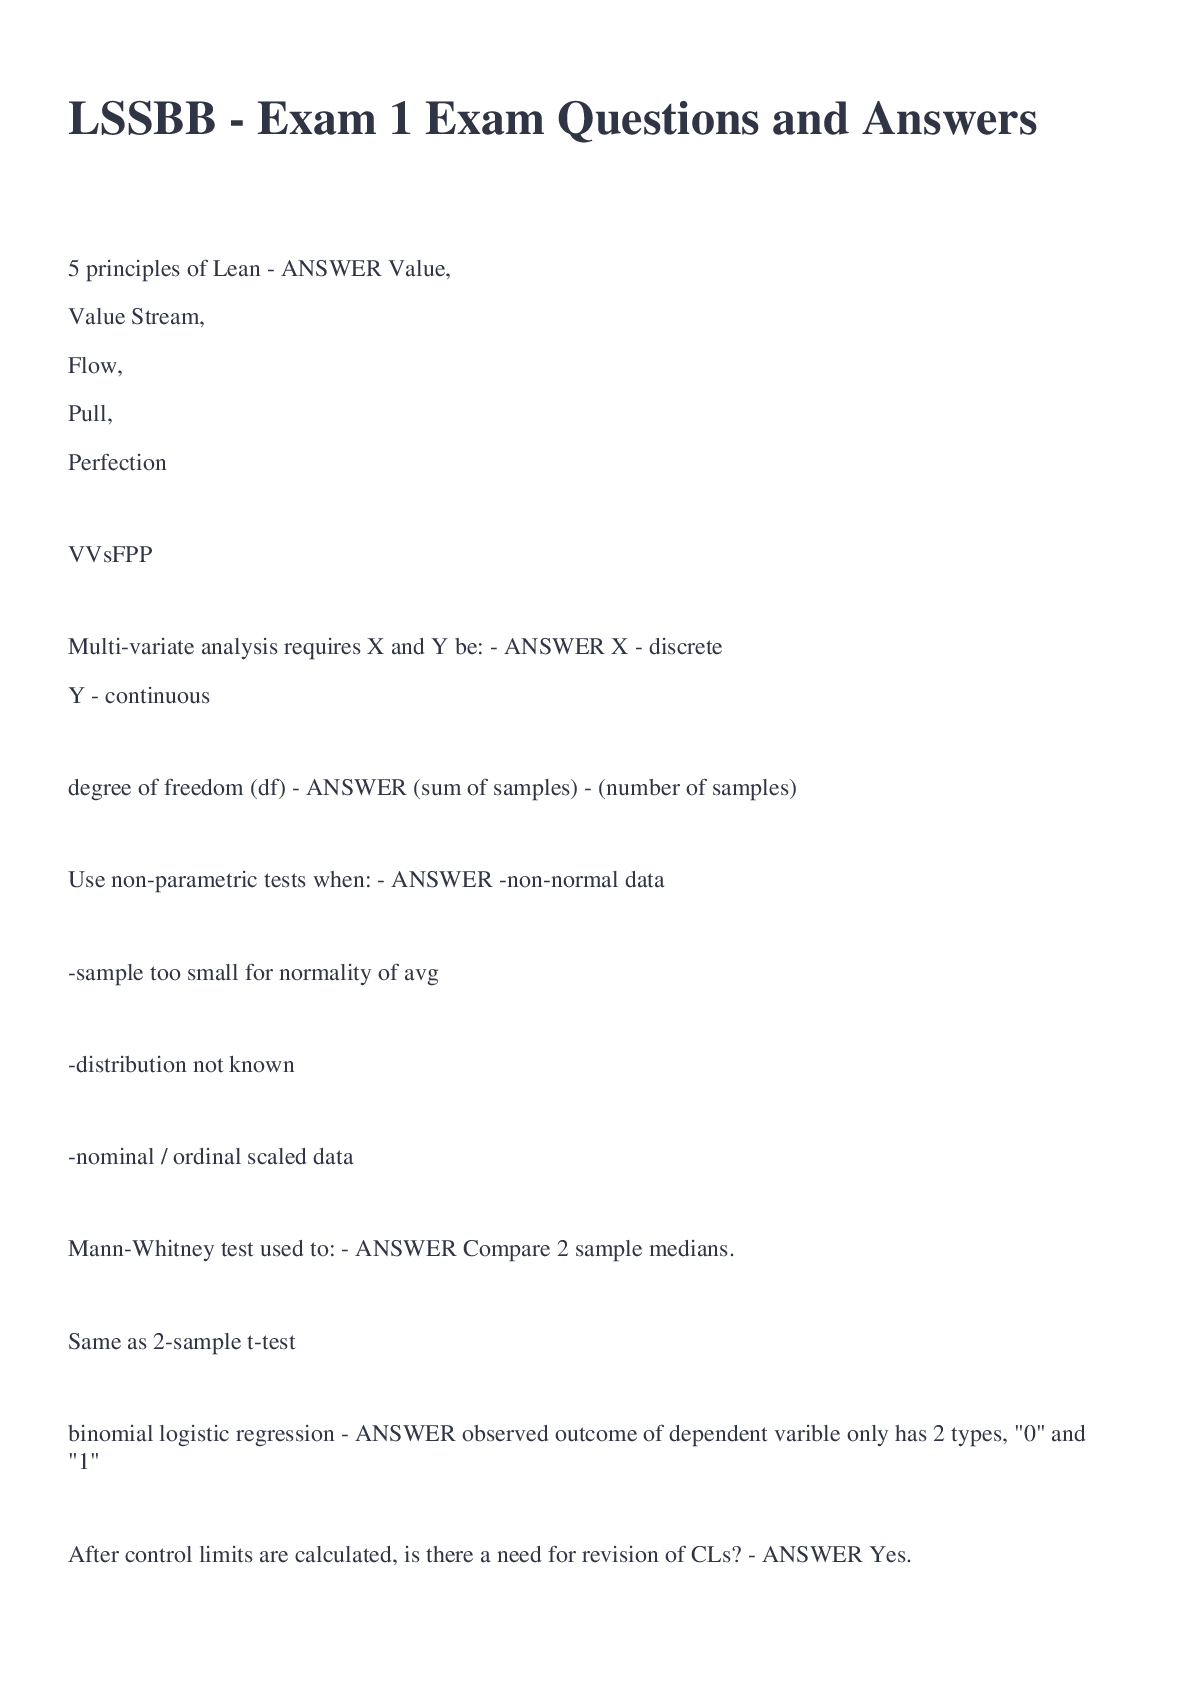
5 principles of Lean - ANSWER Value,
Value Stream,
Flow,
Pull,
Perfection
VVsFPP
Multi-variate analysis requires X and Y be: - ANSWER X - discrete
Y - continuous
degree of freedom (df) - ANSWER (sum of
...
5 principles of Lean - ANSWER Value,
Value Stream,
Flow,
Pull,
Perfection
VVsFPP
Multi-variate analysis requires X and Y be: - ANSWER X - discrete
Y - continuous
degree of freedom (df) - ANSWER (sum of samples) - (number of samples)
Use non-parametric tests when: - ANSWER -non-normal data
-sample too small for normality of avg
-distribution not known
-nominal / ordinal scaled data
Mann-Whitney test used to: - ANSWER Compare 2 sample medians.
Same as 2-sample t-test
binomial logistic regression - ANSWER observed outcome of dependent varible only has 2 types, "0" and "1"
After control limits are calculated, is there a need for revision of CLs? - ANSWER Yes.
if reduction in variation / process shift.
To avoid false special cause detection.
Binomial distribution - ANSWER discrete.
Not continuous.
Same probability of success for each outcome.
Sigma level - ANSWER measures process capability.
measures how process performs against requirements.
reps # of standard deviations between center and specification limit.
P-charts based on: - ANSWER binomial distribution
P-charts used for: - ANSWER tracking proportion or % defectives
only 2 options:
pass/fail; accept/reject
Revised FMEA prepared in what phase: - ANSWER Control Phase
Used as monitoring plan.
Reassessed for out-of-control changes.
Discrete data - ANSWER number by counting; no decimals.
ex. items/persons
Continuous data - ANSWER measured on a continuum; has decimal subdivisions
Multi-vari chart used to: - ANSWER analyze effects of inputs on outputs
horizontal scale of multi-vari chart = - ANSWER work shift,
machine / material type,
noise / uncontrolled factors
Unequal variance due to: - ANSWER - extreme tails
- outliers
- multiple modes
sampling distributions is aka: - ANSWER control charts
1. both plotted on sample data
2. show variation in sample data
Effective LSS must understand difference between: - ANSWER practical & statistical significant
practical difference / significance: - ANSWER difference of practical value
statistical difference / significance: - ANSWER difference between actual difference and possible difference
type 2 error occurs when: - ANSWER fails to reject the null
(null is not rejected)
...when hypothesis is false
(...when alt hypothesis is true)
What does "s" symbolize in X-bar and S charts? - ANSWER process standard deviation
what does S charts and R charts measure? - ANSWER subgroup variability
What does S charts and R charts use? - ANSWER S chart uses - standard deviation
R chart uses - range values
Example of prevention cost: - ANSWER training
what type of cost is quality audit? - ANSWER appraisal cost
what type of cost is time value of money? - ANSWER hidden cost
what type of cost is late delivery? - ANSWER hidden cost
In VSM, triangle with "I" inside = - ANSWER exchange of inventory
Where to add inventory count? - ANSWER below triangle icon
What indicates out of control process? - ANSWER -one point outside UCL / LCL
-8+ points on one side of center
common cause variation - ANSWER inherent variation
not easy to detect
coefficient of determination - ANSWER - denoted by R^2
- proportion of variance in dependent, predictable from independent variable
Mode is: - ANSWER most frequent occurring value in data set
1. 100 passed; 84 good (16 bad)
2. 110 passed; 82 good (28 bad)
3. 138 passed; 126 good (12 bad)
Calculate RTY: - ANSWER RTY:
(84/100) = 84%
(82/110) = 75%
(126/138) = 91%
84 x 75 x 91 = 57%
Process capability index: - ANSWER uses process variability & specification limits to see if process is "capable"
ability of process to produce output within spec limits
3 types of variation in sampling plan: - ANSWER within
between
temporal
temporal variation: - ANSWER variation over time
shift/day/week
kaizen - ANSWER means change for better
continuous improvement
kanban - ANSWER means "card"
used to control flow
Poka-yoke - ANSWER mistake proofing
Prod line A = 5000 units / hour
Prod line B = 10,000 units / hour
Prod line B 2x faster than A
Example of: - ANSWER Ratio Scaled data
Ratio scaled data - ANSWER can be ranked
2 true/false
1 multiple choice (4 choices)
What is probability that all 3 are correct? - ANSWER 1/16
50% x 50% x 25%
95% confidence interval
of students that play sports is
35%
plus / minus 5%
what is the 95% confidence interval: - ANSWER 30% - 40%
35 - 5 = 30
35 + 5 = 40
Test score: 190
test mean: 150
standard deviation: 25
what is z-score? - ANSWER z-score:
(x-mean)/sd
(190 - 150)/25
40/25 = 1.6
In order to determine statistical significance between mean of 2 distributions, you need: - ANSWER -test-statistics
-confidence intervals
-p-values
Sampling method is biased if it: - ANSWER favors some outcomes over others
Bias in sampling is an error due to: - ANSWER lack of independence
systematic sampling
If the control plan has a deviation,
what does the control plan need to have to correct it: - ANSWER Reaction plan
1 sample t-test - ANSWER compares mean of a sample to a known target mean
F-test - ANSWER Used to compare two variances
Stratification - ANSWER points clustering around center line.
lack of variability.
Cause of stratification: - ANSWER incorrect control limits.
Multi-Vari Chart - ANSWER screen inputs to see impact on outputs.
Stability problem in measurement system means: - ANSWER lack of consistency over time.
statistical difference - ANSWER change required between true difference and one that could occur by chance.
Fish-bone diagram classifications: - ANSWER -controllable
-procedural
-noise
ANOVA used to: - ANSWER -relationship between RESPONSE variable and INDEPENDENT variable
-difference between MEANS
In VSM, line with a zig-zag in middle: - ANSWER electronic flow symbol
internet, elec data, etc.
Created quality trilogy - ANSWER Juran
Quality Trilogy (Juran Trilogy) - ANSWER reduce CoPQ by planning quality in process
Contingency table - ANSWER AKA crosstab 2-way
relationship between several variables
78 defects
10,000 units
calculate DPU - ANSWER DPU = defects / total units
78 / 10,000 =
.78 / 100 =
0.78%
In VSM, supplier symbol placed: - ANSWER upper left corner
In VSM, customer symbol placed: - ANSWER upper right corner
In VSM, are customer / supplier symbols same or different? - ANSWER In VSM, customer and supplier symbols are same - placement is different.
Correlation - ANSWER relationship strength between random variables
regression - ANSWER mathematical relationship between two variables
Gage R&R used to: - ANSWER see variation attributed to operator
Wilcoxon sign test: - ANSWER compare mediam scores of 2 dependent samples
Poisson distrbution - ANSWER discrete
count over a constant space
overproduction - ANSWER producing more that needed / customer demanded
1 of 8 types of waste
I-MR chart - ANSWER plots
individual observations on 1 chart
&
range of individual observations on another chart
-shows process level and variation
-detects special causes
type 1 error - ANSWER rejection of true null hypothesis
(false positive)
type 2 error - ANSWER fails to reject a false null hypothesis
(false negative)
If r > 0.8 - ANSWER relationship practically significant
If r < 0.2 - ANSWER relationship is not practically significant
[Show More]