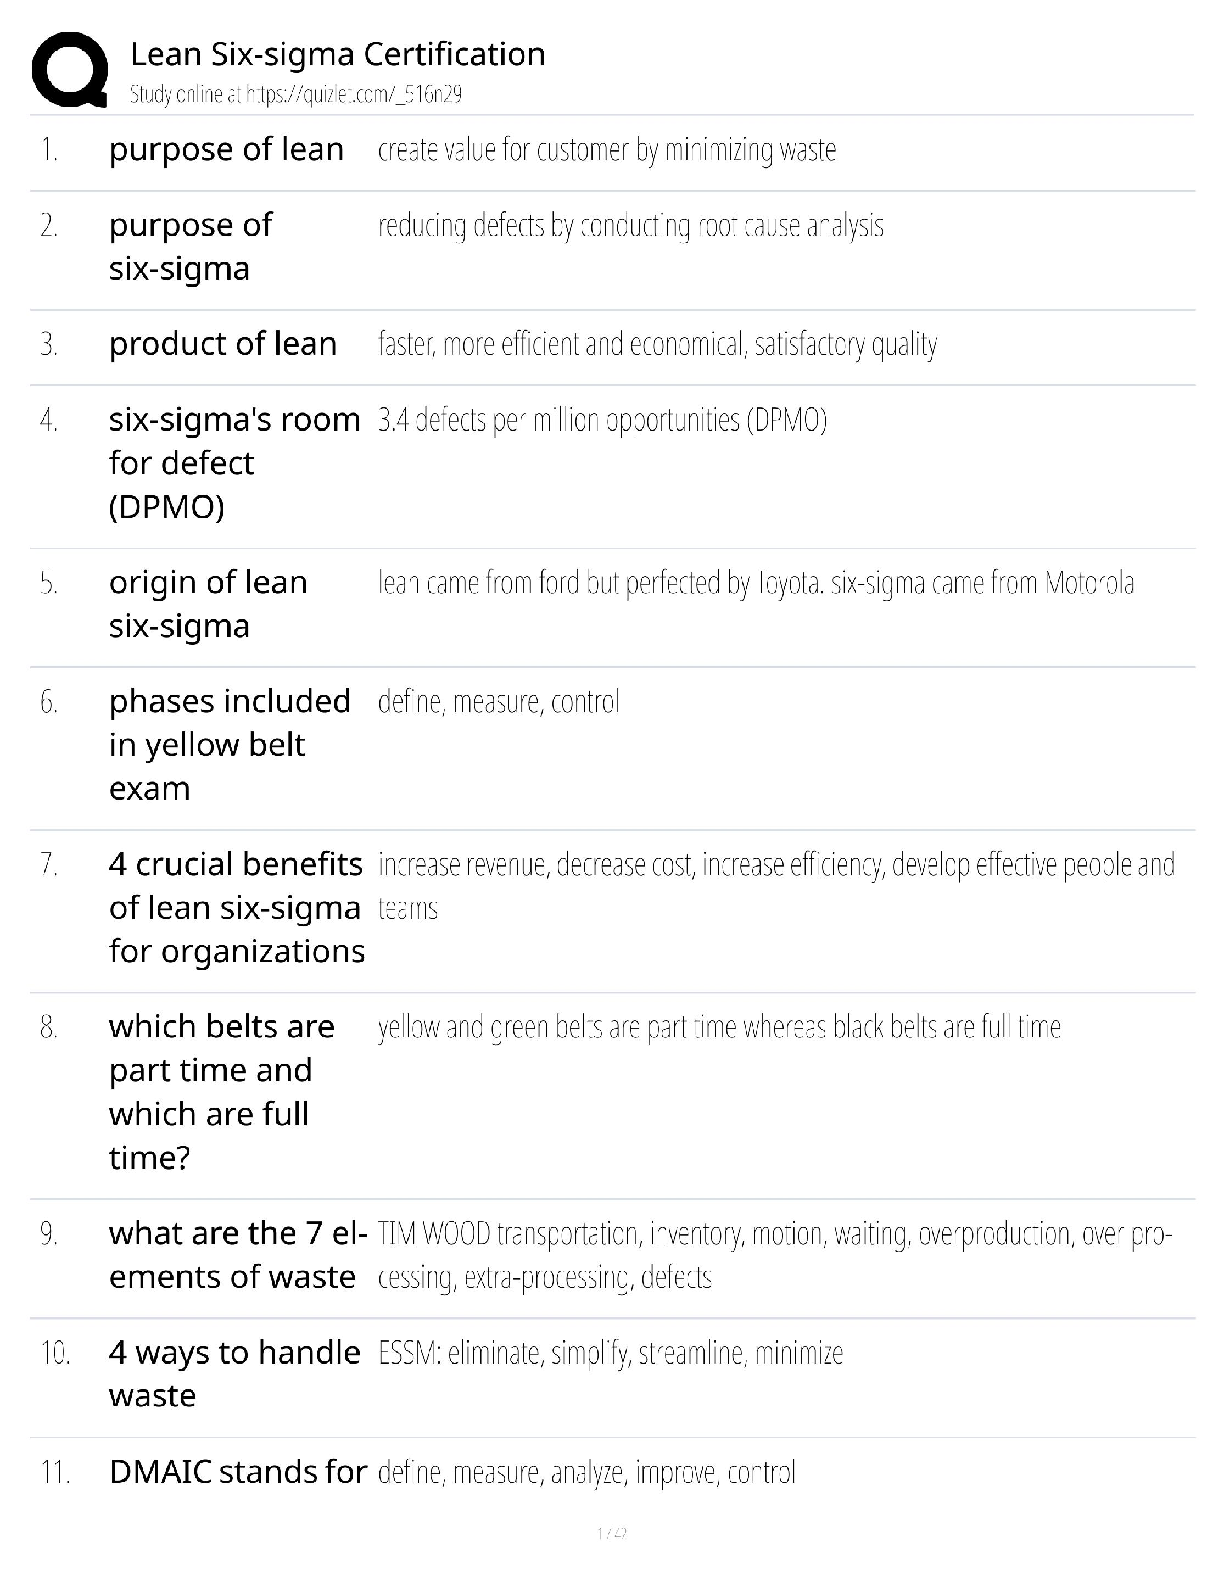
purpose of lean - ANSWER create value for customer by minimizing waste
purpose of six-sigma - ANSWER reducing defects by conducting root cause analysis
product of lean - ANSWER faster, more efficient and economical
...
purpose of lean - ANSWER create value for customer by minimizing waste
purpose of six-sigma - ANSWER reducing defects by conducting root cause analysis
product of lean - ANSWER faster, more efficient and economical, satisfactory quality
six-sigma's room for defect (DPMO) - ANSWER 3.4 defects per million opportunities (DPMO)
origin of lean six-sigma - ANSWER lean came from ford but perfected by Toyota. six-sigma came from Motorola
phases included in yellow belt exam - ANSWER define, measure, control
4 crucial benefits of lean six-sigma for organizations - ANSWER increase revenue, decrease cost, increase efficiency, develop effective people and teams
which belts are part time and which are full time? - ANSWER yellow and green belts are part time whereas black belts are full time
what are the 7 elements of waste (waste)? - ANSWER TIM WOOD transportation, inventory, motion, waiting, overproduction, over processing, extra-processing, defects
4 ways to handle waste (muda) - ANSWER ESSM: eliminate, simplify, streamline, minimize
DMAIC stands for - ANSWER define, measure, analyze, improve, control
modules included in define stage - ANSWER project charter, voice of customer, SIPOC
modules included in measure stage - ANSWER select measures, data collection planning, operational definitions, baseline data
modules included in analyze stage - ANSWER process analysis, brainstorm root causes, pareto charts, develop hypothesis
modules included in improve stage - ANSWER create flow, mistake proofing, visual management and 5s
modules included in control stage - ANSWER process monitoring and response plan, documentation and story board
deliverables in define phase - ANSWER fully prepared team is formed and committed to work, customers identified and critical to quality characteristics (CTQs) defined, team charter developed, business process mapped.
deliverables in measure phase - ANSWER Key measures identified, data collection planned and executed, process variation displayed and communicated, performance baselined, sigma level (variance) calculated.
deliverables in control phase - ANSWER Documented and implemented monitoring plan, standardized process, documented procedures, response plan established and deployed, transfer of ownership (project closure).
The Problem Solving Strategy Y = f(x) - ANSWER illustrates the idea that the important process outcomes Ys are a result of the drivers x's within processes
what is a project charter? - ANSWER contract between organizations leadership and project team that outlines the problem/objectives, emphasizes senior management expectations, and establishes timeline and team member roles
business case - ANSWER a document that uses the problem and the goal statements and converts it into a statement of business value
a good problem statement should address these issues - ANSWER what, when, where, magnitude, impact
a good goal statement should address these issues - ANSWER when, what, how, relevance
types of project metrics - ANSWER operational (turnaround time, production time, number of defects) and financial (profitability ratios, sales figures)
primary vs secondary metrics - ANSWER primary metrics are usually the most important critical to quality characteristic that measures what is desired, and secondary metrics are required to measure what is not desired or errors
what is CTQ? - ANSWER critical to Quality factor is the quality of a product or service that is derived from the voice of the customer. A good CTQ should be measurable and include operational definitions and specific performance standards.
cost of poor quality (COPQ) - ANSWER quantifies the negative outcomes (costs) due to waste, inefficiencies, and defects in a process; does not include detection and prevention cost.
Financial Evaluation & Benefits Capture - ANSWER revenue, costs, market share, net present value (NPV), Return on investment (ROI)
net present value (NPV) - ANSWER (future amount to be received)*(1+ annual interest rate)^(number of years)
Return on investment (ROI) - ANSWER (Income / cost) * 100%
importance in the voice of the customer - ANSWER important in guiding where to focus improvement efforts
importance in the voice of the business - ANSWER provides clarity in identifying revenue growth areas, economic value added and market value.
importance in the voice of the employee - ANSWER carries out the message and mission of the company
six sigma hierarchy - ANSWER CEO, Champion, Master Black Belt, Black Belt, Green Belt, Yellow Belt
yellow belt responsibilities - ANSWER A Yellow Belt typically has a basic knowledge of Six Sigma, but does not lead projects on their own. They are often responsible for the development of process
maps
green belt responsibilities - ANSWER work on small, carefully defined Six Sigma projects, requiring less than a Black Belt's full-time commitment.
black belt responsibilities - ANSWER project team leader, allowing them to be directly responsible for projects within their organization. They are
held accountable for the results.
master black belt responsibilities - ANSWER identification of project deployment opportunities, highly skilled in communication, coaching, project management and statistical analysis
champion black belt responsibilities - ANSWER ensure that whatever projects are undertaken mesh well with the goals and intentions of the business or corporation overall
common internal customers - ANSWER HR and IT
external customers - ANSWER people outside the organization that receive products and services
stakeholders - ANSWER groups or individuals that might be impacted by process changes but they don't receive products or services
main focus of define phase - ANSWER outline the issue and process to address
process map - ANSWER using flowcharts to visualize and analyze the as-is process
eclipse symbol on the process map means - ANSWER start/end point
rectangle symbol on the process map means - ANSWER process point
diamond symbol on the process map means - ANSWER decision point
papercut symbol on the process map means - ANSWER document point
trapezoid symbol on the process map means - ANSWER data collection point
traingle symbol on the process map means - ANSWER storage point
homeplate symbol on the process map means - ANSWER transport point
circle symbol on the process map means - ANSWER inspection point
SIPOC stands for - ANSWER supplier, input, process, output, customer
what is SIPOC? - ANSWER high level map that defines the scope for process improvement activities by identifying potential gaps between suppliers and input specifications and between output specifications and customers expectations
value stream map - ANSWER page documenting all the process used to produce and ship a product to the customer, both value-adding and nonvalue-adding processes
correlation (quality function deployment) - ANSWER analytical chart identifying the relation between customer perception and design specifications
Failure Modes & Effects Analysis (FMEA) - ANSWER qualitative and systematic tool to help anticipate what might go wrong with a product or process. In addition to identifying how a product or process might fail and the effects of that failure, FMEA also helps find the possible causes of failures and the likelihood of failures being detected before occurrence.
FMEA key measures - ANSWER severity, frequency of occurrence and ease of detection
risk priority number - ANSWER Severity x Occurrence x Detection
importance of data collection - ANSWER understand how the process is performing and what parts of the process are contributing to the problem
types of measures encountered in lean six sigma - ANSWER cycles time, days, size, dollars, attribute counts, defect counts
importance of operational definition - ANSWER provides a clear and concise description of what is to be observed or measured, so that people taking or interpreting data will do it consistently
importance of baseline data - ANSWER helps the team view the data from the customer's perspective and determines if the process is capable of meeting customer expectations
how to classify data - ANSWER categorize data into continuous data which is quantitative or discrete which is qualitative
possible distributions if data is continuous - ANSWER uniform, normal, exponential, chi sq (left skewed normal dist)
possible distributions if data is discrete - ANSWER Binomial (affected by sample size and probability), Poisson (affected by mean)
descriptive vs inferential data - ANSWER Descriptive statistics provide information about the specific data being analyzed, inferential statistics draw conclusions about a population
how to tell if data is normal distribution? - ANSWER critical value test or normality plot
importance of graphical analysis - ANSWER visualize and understand data in a graphical form to study significant relations among variables
different types of graphs to represent data - ANSWER control chart, pareto chart, pie chart, histogram, scatter plot, box plot, matrix
histogram - ANSWER A graph of vertical bars representing the frequency distribution of a set of data`
control chart - ANSWER A graphic display of process data over time and against established control limits, which has a centerline that assists in detecting a trend of plotted values toward either control limit
box plot - ANSWER A graph that displays the highest and lowest quarters of data as whiskers, the middle two quarters of the data as a box, and the median
important data analysis values - ANSWER average, median, standard deviation, minimum, maximum, sample size
Measurement system analysis (MSA) purpose - ANSWER create a measurement system to use by quantifying its accuracy, precision, and stability
precision vs accuracy - ANSWER precision is consistency of output whereas accuracy is alignment with the targeted value or goal
linearity (best fit line) - ANSWER consistency of bias over a range of measurements (example, if a bathroom scale is under by 1.0 pound when measuring a 150 pound person, but is off by 5.0 pounds when measuring a 200 pound person, the scale Bias is non-linear in the sense that the degree of Bias changes over the range of use)
stability - ANSWER capacity of a measurement system to produce the same values over time when measuring the same sample
Gage Repeatability & Reproducibility - ANSWER method for evaluating the variation in the measurement process. Allows for comparison, graphically and analytically, of process to measurement and specification to measurement variation
variable vs attribute data - ANSWER attribute data shows go/no-go information (non-statistical) whereas variable data shows measurement information
process capability - ANSWER the ability to meet design specifications, based on a sample of data taken from a process
Cp equation (process capability) - ANSWER (upperlimit - lowerlimit) / (6*standard deviations)
process stability vs process capability - ANSWER stability refers to consistency of the process with respect to important process characteristics whereas capability refers to the ability of the process to meet specifications
process capability index - ANSWER adjustment of Cp for the effect of non-centered distribution
Cpk equation (process capability index) - ANSWER (Zmin)/3 where Zmin = (upperlimit - mean)/ (3*SD) or (mean - lowerlimit)/ (3*SD) ,which ever is smaller
A larger Cpk indicates - ANSWER the less likely it is that any item will be outside the specs
Cp and Cpk levels that correspond to Four Sigma - ANSWER 1.33
process performance (Pp) - ANSWER capability of a process during its initial set-up, before it has been brought into a state of statistical control
process performance index (Ppk) - ANSWER adjustment of process performance for the effect of non-centered distribution
Cp > Cpk and Pp > Ppk - ANSWER Process is off-target but stable
Cp > Pp and Cpk > Ppk - ANSWER Special (known) causes present
Cp < Pp and Cpk < Ppk - ANSWER Certain fixed pattern in subgroup
capability measure for discrete and attribute data - ANSWER capability measured in Defects per Million Opportunities (DPMO)
purpose of the analyze phase - ANSWER determine the root causes of the problem and sources of waste
opportunities to look for root cause in the process analysis - ANSWER rework loops, redundancies, bottlenecks, inspections and decisions, handoffs
what are bottlenecks? - ANSWER design flawed places where the process is limited in the volume it can handle (shaped like a bottle neck)
are inspections the solution to prevent defects? - ANSWER no inspections are non-value added work and adds to the cost of the system
the five why's - ANSWER practice of asking why repeatedly in order to work the causal chain
fishbone diagrams (cause and effect diagram) - ANSWER visual tool used to logically organize possible causes to specific problems by graphically displaying them in increasing detail
importance of the Pareto analysis - ANSWER find the process that should be prioritized for improvement by ranking sources of problems by frequency of occurrence
pareto 80:20 rule - ANSWER focusing on 20 percent of causes that result in 80 percent of the failures, instead of trying to attack all the problem causing factors, will have the best return on the effort and will be the most cost effective
basic six sigma metrics - ANSWER DPU, DPO, DPMO, PPM, FPY, FTY, RTY Cycle Time
DPU - ANSWER defects per unit or (total number of defects)/(total number of units)
DPO - ANSWER defects per opportunity or (DPU)/(total defect opportunities)
DPMO - ANSWER defects per million opportunities or DPU*million
PPM - ANSWER parts per million or quantity of defective parts per million parts produced
FPY (first pass yield) - ANSWER number of units coming out of a process divided by the number of units going into that process over a specified period of time. Rework or scrap are not counted as coming out of an individual process.
FTY (first time yield) - ANSWER total number of acceptable product leaves the process when rework/scrap are counted, but only if the rework performed corrects the defects.
5 principles of lean - ANSWER define value, map the value system, create flow, establish pull, pursuit of perfection
how to optimize flow? (river analogy) - ANSWER trying to remove parts where customer or subject is stuck in the process due to inefficiencies and bottlenecks
ways to create flow - ANSWER batch size reduction, cross training, parallel processing and standard work
serial processing - ANSWER process that is linear and sequential
parallel processing - ANSWER process with steps designed to happen at the same time
what does standard work consist of? - ANSWER consists of creating common procedures by using checklists, visual aids, templates, etc
mistake proofing or poka-yoke - ANSWER reducing the likelihood of defect by eliminating the opportunity of error to occur in the first place
hard mistake proofing (poka yoke) - ANSWER design process for error free execution
soft mistake proofing (poka yoke) - ANSWER create alarms to warn for defects about to occur
visual management - ANSWER being able to look at any process and know the status of the operation
5s - ANSWER 5 step process used to create a visual workplace that results in leaner and more efficient workplaces
steps of 5s - ANSWER sort, straighten, shine, standardize, sustain
sort step - ANSWER remove all items from the workplace that aren't needed or rarely used for current production operations
red tag tool (used for sorting) - ANSWER temporarily tag confusing items to sort later by answering 3 questions
red tag questions for sorting - ANSWER is the item needed? if it is needed, is it needed in the quantity? if it is needed, does it need to be located here?
set in order techniques - ANSWER shadow boards, visual management with tape, process flow for items
shine step in 5s - ANSWER regular cleaning/shining of workplace during intervals
standardize step in 5s - ANSWER create definitions, set guidelines documenting procedures, assign ownership
3 methods for assuring standardization - ANSWER make check sheets, daily logs and work instructions
ways to sustain (step in 5s) - ANSWER auditing and enforcement
kanban - ANSWER a manual system that signals the need for materials; card or other device that communicates demand for work or materials from the preceding station
cost benefit analysis - ANSWER a comparative assessment of all the benefits you anticipate from your project and all the costs to introduce the project, perform it, and support the changes resulting from it.
cost benefit analysis helps to - ANSWER prioritize a project over others, frame appropriate project objectives, develop before and after measures of project success, prepare estimates of the resources required to perform the project work. Also considers potential costs of not doing the project, if the project fails, and opportunity costs
two key factors influence the results of a cost-benefit analysis - ANSWER -How far into the future you look to identify benefits
-On which assumptions you base your analysis
control phase main objective - ANSWER create systems and processes to maintain and sustain the improvement
process control plan - ANSWER system to monitor a process with detailed measurement instructions
Elements of the Control Plan - ANSWER Measurements and Specifications, Input-Output Process,
importance of process control plan - ANSWER maintains long term success
control plan consists of what two plans? - ANSWER monitoring plan and response plan
elements of the response plan - ANSWER damage control, process adjustment, effectiveness assessment, continuous improvement
importance of documentation - ANSWER helps capture the project methods, successes and lessons learned, serves as communication tool to share the project with ot
[Show More]


![Preview of [eBook] [PDF] Irwin and Rippe's Intensive Care Medicine 9th Edition V 1& 2 BY Richard S Ir](https://browseimages.nyc3.digitaloceanspaces.com/paper-images/2025/Mar/08/yotgxhEm2025-03-08-01-2967cb73390fcd2.png)
![Preview of eBook [PDF] Human Trafficking A Global Health Emergency By Mary de Chesnay, Donna Sabella](https://browseimages.nyc3.digitaloceanspaces.com/paper-images/2025/Jul/31/oadCIzOM2025-07-31-06-07688addf285b44.png)
![Preview of eBook [PDF] Java A Beginner's Guide 9th Edition By Herbert Schildt](https://browseimages.nyc3.digitaloceanspaces.com/paper-images/2024/Aug/29/cAp1VB1M2024-08-29-12-5166d044a590695.png)
![Preview of eBook [PDF] Glencoe Short Stories 2nd Edition By Jeffrey D. Wilhelm et al](https://browseimages.nyc3.digitaloceanspaces.com/paper-images/2024/Aug/29/YR760CqR2024-08-29-12-5066d04480a195f.png)
![Preview of eBook [PDF] Gray Hat Hacking The Ethical Hacker's Handbook 6th Edition By Allen Harper, Ry](https://browseimages.nyc3.digitaloceanspaces.com/paper-images/2026/01/13/QKQKjbOJ2026-01-13-03-09696635ecdc301.png)
![Preview of eBook [PDF] Multinary Alloys Based on IV- VI and IV- VI2 Semiconductors 1st Edition By Vas](https://browseimages.nyc3.digitaloceanspaces.com/paper-images/2024/Aug/30/fwIEdhCo2024-08-30-01-5666d1a55616c84.png)