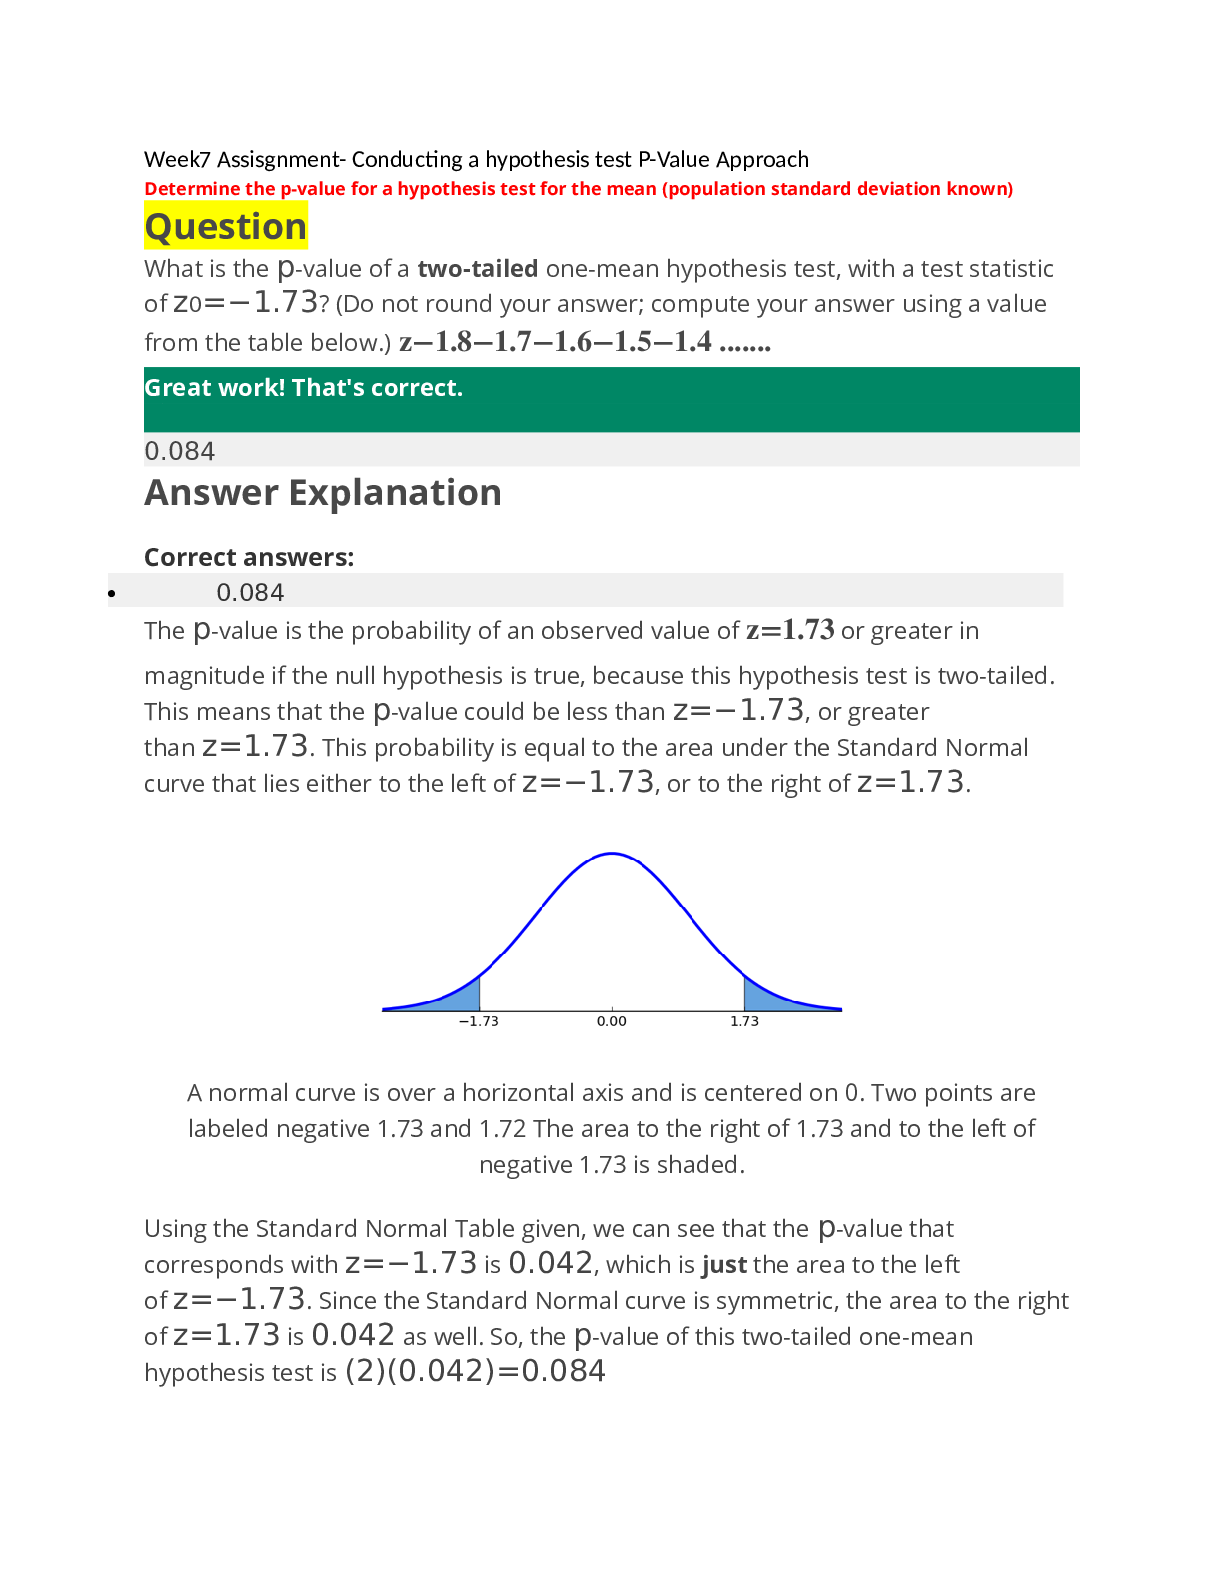
1. Question: What is the p-value of a two-tailed one-mean hypothesis test, with a test statistic of z0=−1.73? (Do not round your answer; compute your answer using a value from the table below.)…. z−1.8−1.7−1.6−1.5−1.40.0
...
1. Question: What is the p-value of a two-tailed one-mean hypothesis test, with a test statistic of z0=−1.73? (Do not round your answer; compute your answer using a value from the table below.)…. z−1.8−1.7−1.6−1.5−1.40.000.0360.0450.0550.0670.0810.010.0350.0440.0540.0660.0790.020.0340.0430.0530. 0640.0780.030.0340.0420.0520.0630.0760.040.0330.0410.0510.0620.0750.050.0320.0400.0490.0610.0740.060.0310.0390.0480.0590.0720.070.0310.0380.0470.0580.0710.080.0300.0380.0460.0570.0690.090.0290.0370.0460.0560.068 2. Question: Mary, a javelin thrower, claims that her average throw is 61 During a practice session, Mary has a sample throw mean of 55.5 meters based on 12 throws. At the 1% significance level, does the data provide sufficient evidence to conclude that Mary’s mean throw is less than 61 meters? Accept or reject the hypothesis given the sample data below. H0:μ=61 meters; Ha:μ<61 meters α=0.01 (significance level) z0=−1.99 p=0.0233 The Right Choice Is Option E i.e Do Not Reject The Null Hypothesis because The P value is 0.02333 is Greater than The Significance Level 0.01 3. Question: What is the p-value of a two-tailed one-mean hypothesis test, with a test statistic of z0=0.27? (Do not round your answer; compute your answer using a value from the table below.)….. 10.20.30.40.50.000.5400.5790.6180.6550.6910.010.5440.5830.6220.6590.6950.020.5480.5870.6260.6630.6980.030.5520.5910.6290.6660.7020.040.5560.5950.6330.6700.7050.050.5600.5990.6370.6740.7090.060.5640.6030.6410.6770.7120.070.5670.6060.6440.6810.7160.080.5710.6100.6480.6840.7190.090.5750.6140.6520.6880.722 4. Question: Marty, a typist, claims that his average typing speed is 72 words per minute. During a practice session, Marty has a sample typing speed mean of 84 words per minute based on 12 At the 5% significance level, does the data provide sufficient evidence to conclude that his mean typing speed is greater than 72 words per minute? Accept or reject the hypothesis given the sample data below. H0:μ≤72 words per minute; Ha:μ>72 words per minute α=0.05 (significance level) z0=2.1 p=0.018 5. Question: Nancy, a golfer, claims that her average driving distance is 253 During a practice session, Nancy has a sample driving distance mean of 229.6 yards based on 18 drives. At the 2% significance level, does the data provide sufficient evidence to conclude that Nancy’s mean driving distance is less than 253 yards? Accept or reject the hypothesis given the sample data below. H0:μ=253 yards; Ha:μ<253 yards α=0.02 (significance level) z0=−0.75 p=0.2266 6. Question: Kathryn, a golfer, has a sample driving distance mean of 3 yards from 13 drives. Kathryn still claims that her average driving distance is 207 yards, and the low average can be attributed to chance. At the 1% significance level, does the data provide sufficient evidence to conclude that Kathryn’s mean driving distance is less than 207 yards? Given the sample data below, accept or reject the hypothesis. H0:μ=207 yards; Ha:μ<207 yards α=0.01 (significance level) z0=−1.46 p=0.0721 7. Question: What is the p-value of a two-tailed one-mean hypothesis test, with a test statistic of z0=−1.01? (Do not round your answer; compute your answer using a value from the table below.)….. z−1.2−1.1−1.0−0.90.000.1150.1360.1590.1840.010.1130.1330.1560.1810.020.1110.1310.1540.1790.030.1090.1290.1520.1760.040.1070.1270.1490.1740.050.1060.1250.1470.1710.060.1040.1230.1450.1690.070.1020.1210.1420.1660.080.1000.1190.1400.1640.090.0990.1170.1380.161 8. Question: What is the p-value of a left-tailed one-mean hypothesis test, with a test statistic of z0=−1.19?…. Use a p-value rounded to 3 decimal places…… Here is a portion of the Standard Normal Table. To read the Standard Normal table, match the ones and tenths digits of the z-value in the first column with the correct hundredths digit in the first row. 9. Question: What is the p-value of a two-tailed one-mean hypothesis test, with a test statistic of z0=−1.59? (Do not round your answer; compute your answer using a value from the table below.)…. z−1.8−1.7−1.6−1.5−1.40.000.0360.0450.0550.0670.0810.010.0350.0440.0540.0660.0790.020.0340.0430.0530.0640.0780.030.0340.0420.0520.0630.0760.040.0330.0410.0510.0620.0750.050.0320.0400.0490.0610.0740.060.0310.0390.0480.0590.0720.070.0310.0380.0470.0580.0710.080.0300.0380.0460.0570.0690.090.0290.0370.0460.0560.068 10. Question: Kurtis is a statistician who claims that the average salary of an employee in the city of Yarmouth is no more than $55,000 per year. Gina, his colleague, believes this to be incorrect, so she randomly selects 61 employees who work in Yarmouth and record their annual salary. Gina calculates the sample mean income to be $56,500 per year with a sample standard deviation of 3,750. Using the alternative hypothesis Ha:μ>55,000, find the test statistic t and the p-value for the appropriate hypothesis test. Round the test statistic to two decimal places and the p-value to three decimal places.
[Show More]


 2e Peter Olver, Chehrzad Shakiban.png)


.png)