Computer Science > EXAM > BANA 2372 - Hollander - Final Exam - Chapters 1-9 - All Exam Questions and Answers (All)
BANA 2372 - Hollander - Final Exam - Chapters 1-9 - All Exam Questions and Answers
Document Content and Description Below
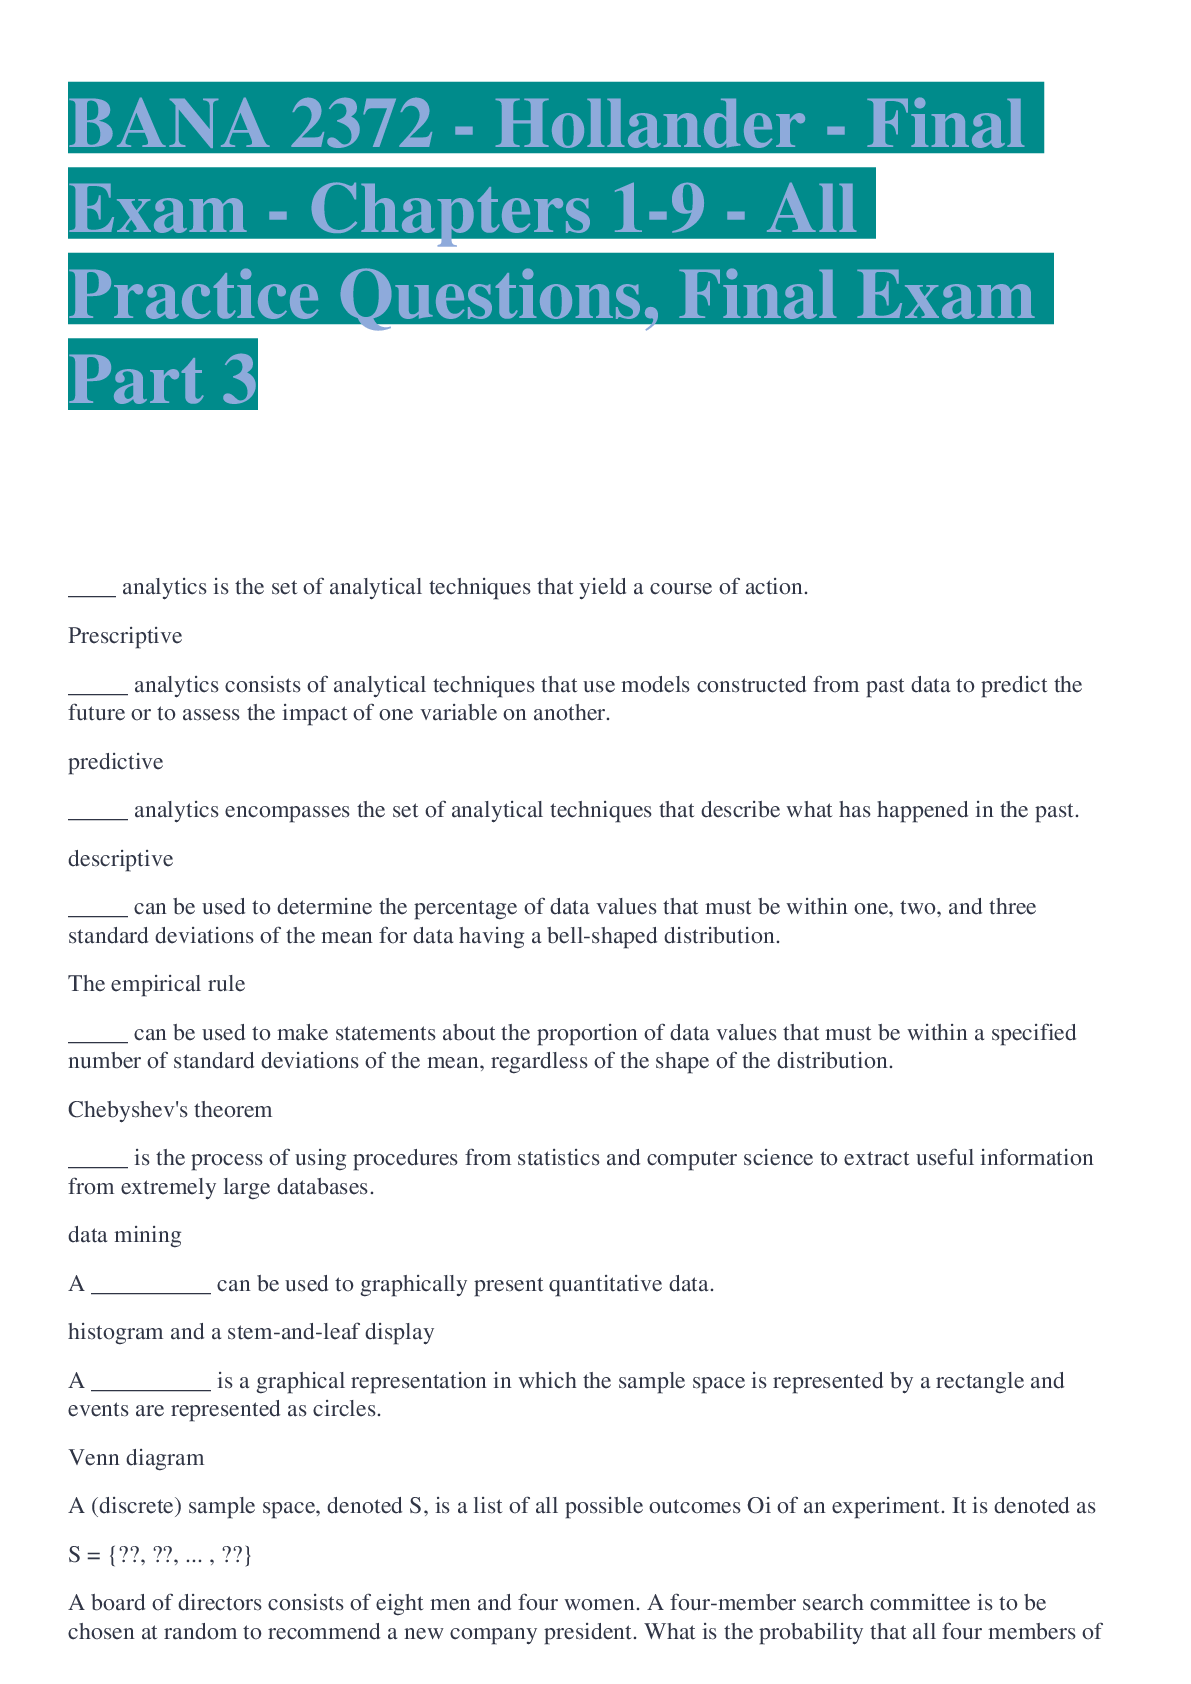
____ analytics is the set of analytical techniques that yield a course of action. Prescriptive _____ analytics consists of analytical techniques that use models constructed from past data to pre... dict the future or to assess the impact of one variable on another. predictive _____ analytics encompasses the set of analytical techniques that describe what has happened in the past. descriptive _____ can be used to determine the percentage of data values that must be within one, two, and three standard deviations of the mean for data having a bell-shaped distribution. The empirical rule _____ can be used to make statements about the proportion of data values that must be within a specified number of standard deviations of the mean, regardless of the shape of the distribution. Chebyshev's theorem _____ is the process of using procedures from statistics and computer science to extract useful information from extremely large databases. data mining A __________ can be used to graphically present quantitative data. histogram and a stem-and-leaf display A __________ is a graphical representation in which the sample space is represented by a rectangle and events are represented as circles. Venn diagram A (discrete) sample space, denoted S, is a list of all possible outcomes Oi of an experiment. It is denoted as S = {??, ??, ... , ??} A board of directors consists of eight men and four women. A four-member search committee is to be chosen at random to recommend a new company president. What is the probability that all four members of the search committee will be women? 1/495 or 0.002 A box plot is a graphical representation of data that is based on _____. a five-number summary A characteristic of interest for the elements is called a(n) _____. variable A committee of four is to be selected from a group of 12 people. How many possible committees can be selected? 495 A common graphical presentation of quantitative data is a _____. histogram A company created a side-by-side bar graph to display their projected financing for the next three years. The display is shown below. Which of the following statements is correct? The company projects to increase income, while decrea [Show More]
Last updated: 2 years ago
Preview 1 out of 14 pages
Buy this document to get the full access instantly
Instant Download Access after purchase
Buy NowInstant download
We Accept:

Reviews( 0 )
$14.00
Can't find what you want? Try our AI powered Search
Document information
Connected school, study & course
About the document
Uploaded On
Oct 06, 2022
Number of pages
14
Written in
Additional information
This document has been written for:
Uploaded
Oct 06, 2022
Downloads
0
Views
96

