STATISTICS 100Stats_Material251
1. The following are body mass index (BMI) scores measured in 12 patients who are free of diabetes and participating in a study of risk factors for obesity. Body mass index is measured a
...
STATISTICS 100Stats_Material251
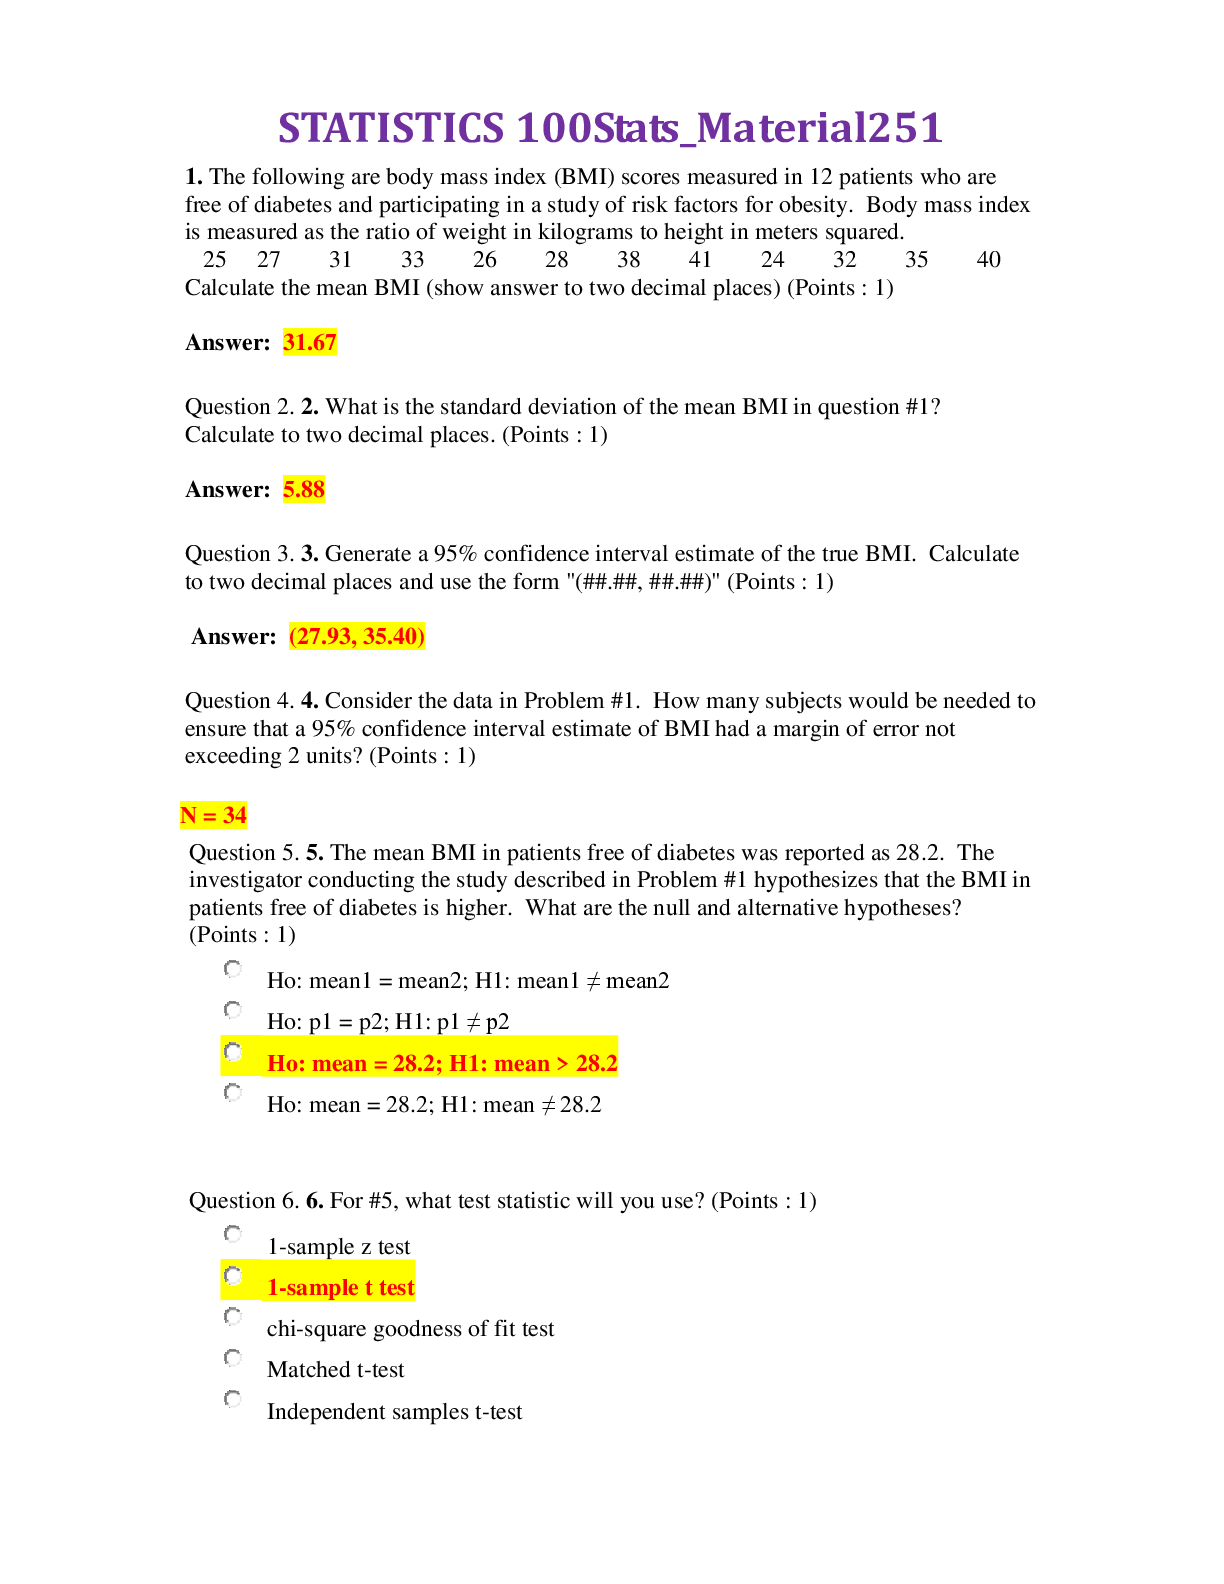
1. The following are body mass index (BMI) scores measured in 12 patients who are free of diabetes and participating in a study of risk factors for obesity. Body mass index is measured as the ratio of weight in kilograms to height in meters squared.
25 27 31 33 26 28 38 41 24 32 35 40
Calculate the mean BMI (show answer to two decimal places) (Points : 1)
Question 2. 2. What is the standard deviation of the mean BMI in question #1? Calculate to two decimal places. (Points : 1)
Question 3. 3. Generate a 95% confidence interval estimate of the true BMI. Calculate to two decimal places and use the form "(##.##, ##.##)" (Points : 1)
Question 4. 4. Consider the data in Problem #1. How many subjects would be needed to ensure that a 95% confidence interval estimate of BMI had a margin of error not exceeding 2 units? (Points : 1)
N = 34
Question 5. 5. The mean BMI in patients free of diabetes was reported as 28.2. The investigator conducting the study described in Problem #1 hypothesizes that the BMI in patients free of diabetes is higher. What are the null and alternative hypotheses? (Points : 1)
Ho: mean1 = mean2; H1: mean1 ≠ mean2
Ho: p1 = p2; H1: p1 ≠ p2
Ho: mean = 28.2; H1: mean > 28.2
Ho: mean = 28.2; H1: mean ≠ 28.2
Question 6. 6. For #5, what test statistic will you use? (Points : 1)
1-sample z test
1-sample t test
chi-square goodness of fit test
Matched t-test
Independent samples t-test
Question 7. 7. What is the decision rule? (Points : 1)
Reject H0 if t > 1.796
Reject H0 if z > 1.96
Reject H0 if t > 2.201 or if t≤-2.201
Reject H0 if chi-square > 19.68
Question 8. 8. Compute the test statistic for #5, and carry your result to two decimal places. (Points : 1)
t= 2.04
Question 9. 9. State your conclusion for #5. (Points : 1)
Question 10. 10. An investigator conducts a study to investigate whether mean peak expiratory flow (PEF) is lower in children with chronic bronchitis as compared to those without. Data on PEF are collected and summarized below. Based on the data, is there statistical evidence of a lower mean PEF in children with chronic bronchitis as compared to those without? Run the appropriate test at a=0.05.
Group Number of Children Mean PEF Std Dev PEF
Chronic Bronchitis 25 281 68
No Chronic Bronchitis 25 319 74
What are the null and alternative hypotheses? (Points : 1)
Ho: µ1 = µ2 vs. H1: µ1 ≠ µ2
Ho: µ1 = µ2 vs. H1: µ1 < µ2
Ho: µd = 0 vs. H1: µd ≠ 0
Ho: p=0.5 vs. H1: p>0.5
Question 11. 11. What is the appropriate test statistic for #10? (Points : 1)
matched z-test
independent samples z-test
matched t-test
independent samples t-test
chi-square test of independence
Question 12. 12. Calculate the test statistic for #10. Give only the number, and calculate to two decimal places. (Points : 2)
Question 13. 13. State the conclusion for #10. (Points : 1)
Question 14. 14. Using the data in #10, construct a 95% confidence interval for the mean PEF in children without chronic bronchitis. (Points : 2)
Question 15. 15. How many children would be required to ensure that the margin of error in #14 does not exceed 10 units? (Points : 1)
Question 16. 16. A clinical trial is run to investigate the effectiveness of an experimental drug in reducing preterm delivery to a drug considered standard care and to placebo. Pregnant women are enrolled and randomly assigned to receive either the experimental drug, the standard drug or placebo. Women are followed through delivery and classified as delivering preterm (< 37 weeks) or not. The data are shown below.
Preterm Delivery Experimental Drug Standard Drug Placebo
Yes 17 23 35
No 83 77 65
What are the null and alternative hypotheses? (Points : 1)
Ho: µ1 = µ2 = µ3
H1: means are not all equal
Ho: µ1 = µ2 = µ3
H1: µ1 > µ2 > µ3
H0: Treatment and preterm delivery are independent
H1: Treatment and preterm delivery are not independent
Ho: Z<1.96
H1: Z>1.96
Question 17. 17. For #16, what is the appropriate test statistic? (Points : 1)
Mann-Whitney U
Wilcoxon Rank Sum Test
Analysis of Variance
Chi-square test of independence
Kruskal-Wallis test
Question 18. 18. What is the critical value to reject the null hypothesis? (i.e., what is the decision rule?)
Only state the number to two decimal places. (Points : 1)
Question 19. 19. Compute the test statistic. Display your answer to two decimal places. (Points : 2)
Question 20. 20. Using the data in problem #16, generate a 95% confidence interval for the difference in proportions of women delivering preterm in the experimental and standard drug treatment groups (Points : 1)
Question 21. 21. A study is run comparing HDL cholesterol levels between men who exercise regularly and those who do not. The data are shown below
Regular Exercise N Mean Std Dev
Yes 35 48.5 12.5
No 120 56.9 11.9
Generate a 95% confidence interval for the difference in mean HDL levels between men who exercise regularly and those who do not. (Points : 2)
Question 22. 22.
A clinical trial is run to assess the effects of different forms of regular exercise on HDL levels in persons between the ages of 18 and 29. Participants in the study are randomly assigned to one of three exercise groups - Weight training, Aerobic exercise or Stretching/Yoga – and instructed to follow the program for 8 weeks. Their HDL levels are measured after 8 weeks and are summarized below
Exercise Group N Mean
Weight Training 20 49.7
Aerobic Exercise 20 43.1
Stretching/Yoga 20 57.0
Total 60 49.9
We want to test the null hypothesis that the mean HDL levels in each of the exercise groups are equal, vs. the alternative hypothesis that the means are not all equal, at alpha = 0.05. What is the appropriate test statistic? (Points : 1)
Kruskal-Wallis test
ANOVA
Chi-square test of independence
Chi-square goodness of fit test
Independent samples t-test
Question 23. 23. For the previous question, what is the critical value to reject the null hypothesis? (Points : 1)
Question 24. 24. Compute the test statistic for #22.
Hint: the SS(within) = 21,860. (Points : 2)
Question 25. 25. State the conclusion for #22. (Points : 1)
Question 26. 26. The table below summarizes baseline characteristics on patients participating in a clinical trial
Are there any statistically significant differences in baseline characteristics between treatment groups? Justify your answer. (Points : 2)
Question 27. 27. Based on the table in #26, match each of the following study questions to the appropriate null and alternative hypotheses:
(Points : 3)
Potential Matches:
1 : H0: Categories are independent of treatment level
H1: Categories are not independent of treatment level
2 : H0: p1 = p2
H1: p1 ≠ p2
3 : H0: µ1 = µ2 H1: µ1 ≠ µ2
Question 28. 28. The margin of error is always greater than or equal to the standard error (Points : 1)
True
False
Question 29. 29. If a test is run and p=0.0356, then we can reject H0 at a=0.01 (Points : 1)
True
False
Question 30. 30. If a 95% CI for the difference in two independent means is (2.1 to 4.5), there is no significant difference in means (Points : 1)
True
False
Question 31. 31. In the standard normal distribution, the mean = the median (Points : 1)
True
False
Question 32. 32. A logistic regression model returns a coefficient for variable A of 2.12. What is the odds ratio for variable A? Calculate to two decimal places. (Points : 1)
[Show More]

.png)


.png)


.png)
.png)