A popular retail store knows that the distribution of purchase amounts by its customers is approximately normal with a
mean of $30 and a standard deviation of $9. Below you will find normal probability and percentile ca
...
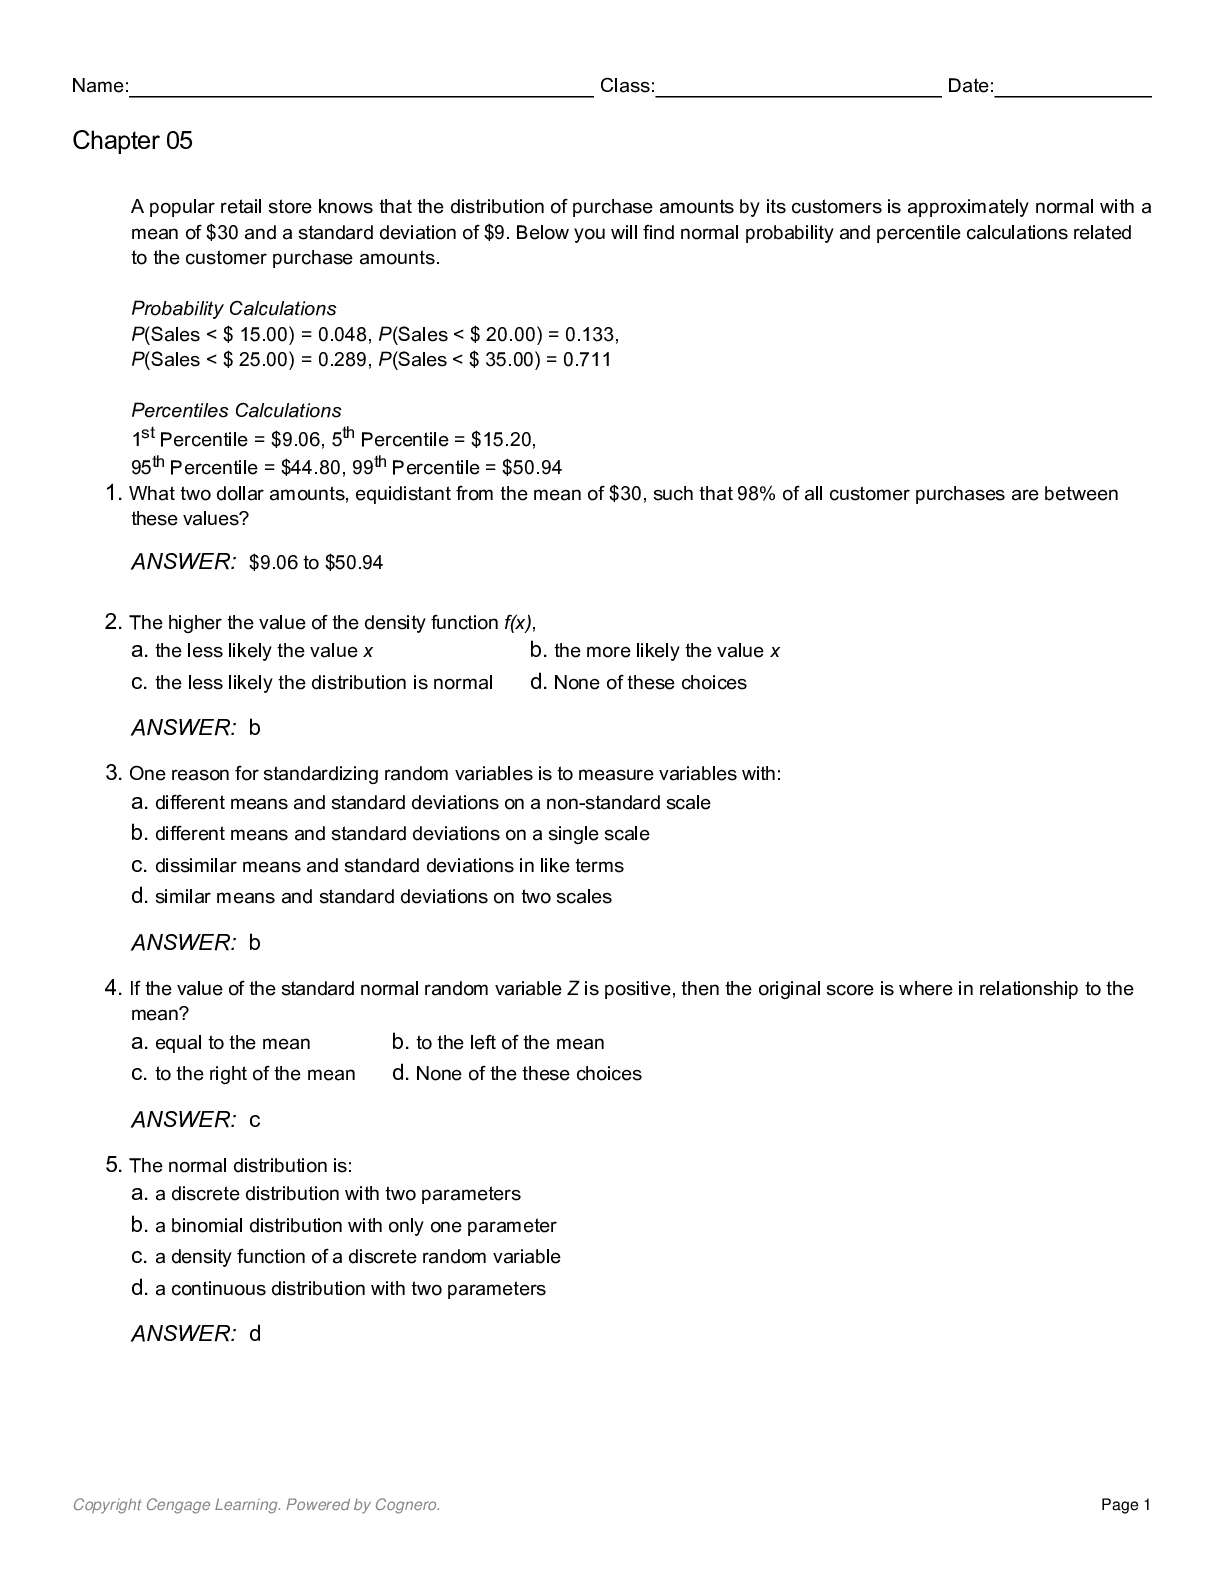
A popular retail store knows that the distribution of purchase amounts by its customers is approximately normal with a
mean of $30 and a standard deviation of $9. Below you will find normal probability and percentile calculations related
to the customer purchase amounts.
Probability Calculations
P(Sales < $ 15.00) = 0.048, P(Sales < $ 20.00) = 0.133,
P(Sales < $ 25.00) = 0.289, P(Sales < $ 35.00) = 0.711
Percentiles Calculations
1st Percentile = $9.06, 5th Percentile = $15.20,
95th Percentile = $44.80, 99th Percentile = $50.94
1. What two dollar amounts, equidistant from the mean of $30, such that 98% of all customer purchases are between
these values?
ANSWER: $9.06 to $50.94
2. The higher the value of the density function f(x),
a. the less likely the value x b. the more likely the value x
c. the less likely the distribution is normal d. None of these choices
ANSWER: b
3. One reason for standardizing random variables is to measure variables with:
a. different means and standard deviations on a non-standard scale
b. different means and standard deviations on a single scale
c. dissimilar means and standard deviations in like terms
d. similar means and standard deviations on two scales
ANSWER: b
4. If the value of the standard normal random variable Z is positive, then the original score is where in relationship to the
mean?
a. equal to the mean b. to the left of the mean
c. to the right of the mean d. None of the these choices
ANSWER: c
5. The normal distribution is:
a. a discrete distribution with two parameters
b. a binomial distribution with only one parameter
c. a density function of a discrete random variable
d. a continuous distribution with two parameters
ANSWER: d
Copyright Cengage Learning. Powered by Cognero. Page 1
Name: Class: Date:
Chapter 056. The standard deviation of a probability distribution is a:
a. measure of variability of the distribution b. measure of central location
c. measure of relative likelihood d. measure of skewness of the distribution
ANSWER: a
7. The mean of a probability distribution is a:
a. measure of variability of the distribution b. measure of central location
c. measure of relative likelihood d. measure of skewness of the distribution
ANSWER: b
8. If we plot a continuous probability distribution f(x), the total probability under the curve is
a. -1 b. 0
c. 1 d. 100
ANSWER: c
9. A continuous probability distribution is characterized by:
a. a list of possible values b. counts
c. an array of individual values d. a continuum of possible values
ANSWER: d
10. Which of the following equations shows the process of standardizing?
a. b.
c. d.
ANSWER: b
11. The standard normal distribution has a mean and a standard deviation respectively equal to
a. 0 and 0 b. 1 and 1
c. 1 and 0 d. 0 and 1
ANSWER: d
12. Which of the following might not be appropriately modeled with a normal distribution?
a. The daily low temperature in Anchorage, Alaska
b. The returns on a stock
c. The daily change in inventory at a computer manufacturer
d. The salaries of employees at a large company
ANSWER: d
13. Given that Z is a standard normal random variable, P(-1.0 Z 1.5) is
a. 0.7745 b. 0.8413
c. 0.0919 d. 0.9332
ANSWER: a
Copyright Cengage Learning. Powered by Cognero. Page 2
Name: Class: Date:
Chapter 0514. Given that Z is a standard normal variable, the value z for which P(Z z) = 0.2580 is
a. 0.70 b. 0.758
c. -0.65 d. 0.242
ANSWER: c
15. If X is a normal random variable with a standard deviation of 10, then 3X has a standard deviation equal to
a. 10 b. 13
c. 30 d. 90
ANSWER: c
16. Given that the random variable X is normally distributed with a mean of 80 and a standard deviation of 10, P(85 X
90) is
a. 0.5328 b. 0.3413
c. 0.1915 d. 0.1498
ANSWER: d
17. The total area under the normal distribution curve is equal to one.
a. True
b. False
ANSWER: True
18. If the random variable X is normally distributed with mean and standard deviation , then the random variable Z
defined by is also normally distributed with mean 0 and standard deviation 1.
a. True
b. False
ANSWER: True
19. Using the standard normal distribution, the Z-score representing the 5th percentile is 1.645.
a. True
b. False
ANSWER: False
20. A random variable X is standardized when each value of X has the mean of X subtracted from it, and the difference is
divided by the standard deviation of X.
a. True
b. False
ANSWER: True
21. Using the standard normal distribution, the Z- score representing the 99th percentile is 2.326.
a. True
b. False
ANSWER: True
Copyright Cengage Learning. Powered by Cognero. Page 3
Name: Class: Date:
Chapter 0522. The mean and standard deviation of a normally distributed random variable which has been "standardized" are zero
and one, respectively.
a. True
b. False
ANSWER: True
23. Using the standard normal curve, the Z- score representing the 75th percentile is 0.674.
a. True
b. False
ANSWER: True
24. A random variable X is normally distributed with a mean of 175 and a standard deviation of 50. Given that X = 150, its
corresponding Z- score is –0.50.
a. True
b. False
ANSWER: True
25. Using the standard normal curve, the Z- score representing the 10th percentile is 1.28.
a. True
b. False
ANSWER: False
A popular retail store knows that the distribution of purchase amounts by its customers is approximately normal with a
mean of $30 and a standard deviation of $9. Below you will find normal probability and percentile calculations related
to the customer purchase amounts.
Probability Calculations
P(Sales < $ 15.00) = 0.048, P(Sales < $ 20.00) = 0.133,
P(Sales < $ 25.00) = 0.289, P(Sales < $ 35.00) = 0.711
Percentiles Calculations
1st Percentile = $9.06, 5th Percentile = $15.20,
95th Percentile = $44.80, 99th Percentile = $50.94
26. What is the probability that a randomly selected customer will spend less than $15?
ANSWER: 0.048
27. What is the probability that a randomly selected customer will spend $20 or more?
ANSWER: 1.0 – 0.133 = 0.867
28. What is the probability that a randomly selected customer will spend $30 or more?
ANSWER: 0.50
Copyright Cengage Learning. Powered by Cognero. Page 4
Name: Class: Date:
Chapter 0529. What is the probability that a randomly selected customer will spend between $20 and $35?
ANSWER: 0.711 – 0.133 = 0.578
30. What two dollar amounts, equidistant from the mean of $30, such that 90% of all customer purchases are between
these values?
ANSWER: $15.20 to $44.80
The weekly demand for General Motors (GM) car sales follows a normal distribution with a mean of 40,000 cars and a
standard deviation of 12,000 cars.
31. There is a 5% chance that GM will sell more than what number of cars during the next year?
ANSWER: Let X represent the number of cars that will be sold during the next year. Assuming that demands in
different weeks are independent, then the yearly distribution is normal with mean and standard deviation
given by:
Therefore the 95th percentile (using Excel) is 2.222 million cars.
32. What is the probability that GM will sell between 2.0 and 2.3 million cars during the next year?
ANSWER: = = 0.8184
The weekly demand for a particular automobile manufacturer follows a normal distribution with a mean of 40,000 cars
and a standard deviation of 10,000. Below you will find probability and percentile calculations related to the customer
purchase amounts. Use this information to answer the following questions.
Probability Calculations
P(Sales < 2,000,000) = 0.134, P(Sales < 2,050,000) = 0.339
P(Sales < 2,100,000) = 0.609, P(Sales < 2,150,000) = 0.834
Percentiles Calculations
1st percentile = 1,912,245, 5th percentile = 1,961,388
95th percentile = 2,198,612, 99th percentile = 2,247,755
33. Calculate the mean, variance, and standard deviation for the entire year (assume 52 weeks in the year).
ANSWER: Mean = 2,080,000, Variance = 5,200,000,000, Std. Dev. = 72,111
34. There is a 1% chance that this company will sell more than what number of cars during the next year?
ANSWER: 2,247,755
35. What is the probability that this company will sell more than 2 million cars next year?
ANSWER: 1.0 – 0.134 = 0.866
Copyright Cengage Learning. Powered by Cognero. Page 5
Name: Class: Date:
Chapter 0536. What is the probability that this company will sell between 2.0 and 2.15 million cars next year?
ANSWER: 0.834 – 0.134 = 0.700
37. What number of cars, equidistant from the mean, such that 90% of car sales are between these values?
ANSWER: 1,961,388 to 2,198,612
38. What number of cars, equidistant from the mean, such that 98% of car sales are between these values?
ANSWER: 1,912,245 to 2,247,755
Wendy’s fast-food restaurant sells hamburgers and chicken sandwiches. On a typical weekday, the demand for
hamburgers is normally distributed with a mean of 450 and standard deviation of 80 and the demand for chicken
sandwiches is normally distributed with a mean of 120 and standard deviation of 30. Use this information to answer
the following questions.
39. How many chicken sandwiches must the restaurant stock to be 99% sure of not running out on a given day?
ANSWER: The 99th percentile for chicken sandwiches = 189.79 (To be on the safe side, round up to 190).
40. If the restaurant stocks 600 hamburgers and 150 chicken sandwiches for a given day, what is the probability that it will
run out of hamburgers or chicken sandwiches (or both) that day? Assume that the demands for hamburgers and
chicken sandwiches are probabilistically independent.
ANSWER: P( stock out of at least one) = 1-P (no stock out of either
41. Why is the independence assumption in Question 74 probably not realistic? Using a more realistic assumption, do
you think the probability in Question 74 would increase or decrease?
ANSWER: It might not be realistic to assume independence. If hamburgers and chicken sandwiches are
“substitute” products; that is, a customer will order one if there is none of the other, then the two
demands would be positively correlated. Still, it is not clear that this would have a large effect on the
probability in Question 132.
A set of final exam scores in an organic chemistry course was found to be normally distributed, with a mean of 73 and
a standard deviation of 8.
42. What percentage of students scored between 81 and 89 on this exam?
ANSWER: P(81 X 89) = P(1.00 Z 2.00) = 0.9772 – 0.8413 = 0.1359
Therefore, 13.59% of students scored between 81 and 89 on this exam.
43. What is the probability of getting a score higher than 85 on this exam?
ANSWER: P(X > 85) = P(Z > 1.5) = 0.0668
Copyright Cengage Learning. Powered by Cognero. Page 6
Name: Class: Date:
Chapter 0544. Only 5% of the students taking the test scored higher than what value?
ANSWER: P(X > A) = 0.05. Then, P(Z ) = 0.95
A = 73 + 1.645(8) = 86.16
Therefore, only 5% of the students taking the test scored higher than about 86.2.
Wendy’s fast-food restaurant sells hamburgers and chicken sandwiches. On a typical weekday, the demand for
hamburgers is normally distributed with a mean of 450 and standard deviation of 80 and the demand for chicken
sandwiches is normally distributed with a mean of 120 and standard deviation of 30. Use this information to answer
the following questions.
45. How many hamburgers must the restaurant stock to be 99% sure of not running out on a given day?
ANSWER: The 99th percentile for hamburger sandwiches = 636.1 (To be on the safe side, round up to 637).
46. Tossing a coin is an example of a (n)
a. binomial distribution b. normal distribution
c. exponential distribution d. Poisson distribution
ANSWER: a
47. We assume that the outcomes of successive trials in a binomial experiment are:
a. probabilistically independent b. probabilistically dependent
c. identical from trial to trial d. random number between 0 and 1
ANSWER: a
48. Sampling done without replacement means that
a. only certain members of the population can be sampled
b. each member of the population can be sampled repeatedly
c. each member of the population can be sampled only once
d. each member of the population can be sampled twice
ANSWER: c
49. The variance of a binomial distribution for which n = 100 and p = 0.20 is:
a. 100 b. 80
c. 20 d. 16
ANSWER: d
Copyright Cengage Learning. Powered by Cognero. Page 7
Name: Class: Date:
Chapter 0550. The binomial probability distribution is used with
a. a discrete random variable
b. a continuous random variable
c. either a discrete or a continuous random variable, depending on the variance
d. either a discrete or a continuous random variable, depending on the sample size
ANSWER: a
51. The variance of a binomial distribution is given by the formula , where n is the number of trials, and p
is the probability of success in any trial.
a. True
b. False
ANSWER: True
52. The binomial distribution is a continuous distribution that is not far behind the normal distribution in order of
importance.
a. True
b. False
ANSWER: False
53. The binomial distribution is a discrete distribution that deals with a sequence of identical trials, each of which has only
two possible outcomes.
a. True
b. False
ANSWER: True
54. A binomial distribution with n number of trials, and probability of success p can be approximated well by a normal
distribution with mean np and variance
a. True
b. False
ANSWER: True
55. For a given probability of success p that is not too close to 0 or 1, the binomial distribution tends to take on more of a
symmetric bell shape as the number of trials n increases.
a. True
b. False
ANSWER: True
56. The binomial random variable represents the number of successes that occur in a specific period of time.
a. True
b. False
ANSWER: False
Copyright Cengage Learning. Powered by Cognero. Page 8
Name: Class: Date:
Chapter 0557. The binomial distribution deals with consecutive trials, each of which has two possible outcomes.
a. True
b. False
ANSWER: True
58. The variance of a binomial distribution for which n = 50 and p = 0.20 is 8.0.
a. True
b. False
ANSWER: True
The height of a typical American male adult is normally distributed with a mean of 68 inches and a standard deviation
of 5 inches. We observe the heights of 12 American male adults.
59. What is the probability that exactly half the male adults will be less than 62 inches tall?
ANSWER: Let X be the height of a male adult. Then P(X<62) = P(Z<-1.2) = 0.1151
Number of male adults who are less than 62 inches tall follows a binomial distribution with n =12 and p =
0.1151. Then P(exactly 6 under 62 inches) = 0.00103
60. Let Y be the number of the 12 male adults who are less than 62 inches tall. Determine the mean and standard
deviation of Y.
ANSWER: Y follows a binomial distribution with n =12 and p = 0.1151. Then,
The service manager for a new appliances store reviewed sales records of the past 20 sales of new microwaves to
determine the number of warranty repairs he will be called on to perform in the next 90 days. Corporate reports
indicate that the probability any one of their new microwaves needs a warranty repair in the first 90 days is 0.05. The
manager assumes that calls for warranty repair are independent of one another and is interested in predicting the
number of warranty repairs he will be called on to perform in the next 90 days for this batch of 20 new microwaves
sold.
61. What type of probability distribution will most likely be used to analyze warranty repair needs on new microwaves in
this situation?
ANSWER: Binomial distribution
62. What is the probability that none of the 20 new microwaves sold will require a warranty repair in the first 90 days?
ANSWER: P(X= 0) = 0.3585
63. What is the probability that exactly two of the 20 new microwaves sold will require a warranty repair in the first 90
days?
ANSWER: P(X = 2) = 0.1887
Copyright Cengage Learning. Powered by Cognero. Page 9
Name: Class: Date:
Chapter 0564. What is the probability that less than two of the 20 new microwaves sold will require a warranty repair in the first 90
days?
ANSWER: P(X < 2) = 0.7358
65. What is the probability that at most two of the 20 new microwaves sold will require a warranty repair in the first 90
days?
ANSWER: P(X 2) = 0.9245
66. What is the probability that only one of the 20 new microwaves sold will require a warranty repair in the first 90 days?
ANSWER: P(X = 1) = 0.3774
67. What is the probability that more than one of the 20 new microwaves sold will require a warranty repair in the first 90
days?
ANSWER: P(X > 1) = 0.2642
68. What is the probability that at least one of the 20 new microwaves sold will require a warranty repair in the first 90
days?
ANSWER: P(X 1) = 0.6415
69. What is the probability that between two and four (inclusive) of the 20 new microwaves sold will require a warranty
repair in the first 90 days?
ANSWER: P(2 X 4) = 0.2616
70. What is the probability that between three and six (exclusive) of the 20 new microwaves sold will require a warranty
repair in the first 90 days?
ANSWER: P(3 X 6) = 0.0156
71. What is the expected number of the new microwaves sold that will require a warranty repair in the first 90 days?
ANSWER: E(X) = np = 1.0
72. What is the standard deviation of the number of the new microwaves sold that will require a warranty repair in the first
90 days?
ANSWER: = 0.9747
Consider a binomial random variable X with n = 5 and p = 0.40.
73. Find the probability distribution of X.
ANSWER:
x 0 1 2 3 4 5
p(x) .0778 .2592 .3456 .2304 .0768 .0102
Copyright Cengage Learning. Powered by Cognero. Page 10
Name: Class: Date:
Chapter 0574. Find P(X < 3).
ANSWER: 0.6826
75. Find
ANSWER: 0.6528
76. Find the mean and the variance of X.
ANSWER: E(X) = 2, and Var(X) = 1.2
A recent survey in Michigan revealed that 60% of the vehicles traveling on highways, where speed limits are posted at
70 miles per hour, were exceeding the limit. Suppose you randomly record the speeds of ten vehicles traveling on US
131 where the speed limit is 70 miles per hour. Let X denote the number of vehicles that were exceeding the limit.
77. Describe the probability distribution of X.
ANSWER: Binomial with n = 10 and p = 0.60.
78. Find P(X = 10).
ANSWER: 0.006
79. Find P(4 < X < 9).
ANSWER: 0.788
80. Find P(X = 2).
ANSWER: 0.01
81. Find P(3 X 6).
ANSWER: 0.607
82. Suppose that an highway patrol officer can obtain radar readings on 500 vehicles during a typical shift. How many
traffic violations would be found in a shift?
ANSWER: 300
Copyright Cengage Learning. Powered by Cognero. Page 11
Name: Class: Date:
Chapter 05Past experience indicates that 20% of all freshman college students taking an intermediate algebra course withdraw
from the class.
83. (A) Using the binomial distribution, find the probability that 6 or more of the 30 students taking this course in a given
semester will withdraw from the class.
(B) Using the normal approximation to the binomial, find the probability that 6 or more of the 30 students taking this
course in a given semester will withdraw from the class.
(C) Compare the results obtained in (A) and (B). Under what conditions will the normal approximation to this binomial
probability become even more accurate?
ANSWER: (A) Parameters for binomial are n = 30 and p = 0.20. Then, (using Excel)
(B) Parameters for normal approximation to the binomial are mean = and standard deviation
. Then (using Excel).
(C) The results are not identical, but very close. We have used the continuity correction (making the
interval longer by 0.5) for the normal approximation in (B). Generally, the normal approximation to the
binomial gets better as n increases and p is not too close to 0 or 1.
A large retailer has purchased 10,000 DVDs. The retailer is assured by the supplier that the shipment contains no
more than 1% defective DVDs (according to agreed specifications). To check the supplier’s claim, the retailer
randomly selects 100 DVDs and finds six of the 100 to be defective.
84. (A) Assuming the supplier’s claim is true, compute the mean and the standard deviation of the number of defective
DVDs in the sample.
(B) Based on your answer to (A), is it likely that as many as six DVDs would be found to be defective, if the claim is
correct?
(C) Suppose that six DVDs are indeed found to be defective. Based on your answer to (A), what might be a
reasonable inference about the manufacturer’s claim for this shipment of 10,000 DVDs?
ANSWER: (A) Mean = np =1, and standard deviation = 0.995
(B) No. If you were 3 standard deviations to the right of the mean, the value would be 3.985. It is unlikely
you would observe 6 defects out of 100.
(C) You would have to infer that the manufacturer’s claim is incorrect. Based on this observation, the
supplier appears to have a higher defect rate than 1%.
Copyright Cengage Learning. Powered by Cognero. Page 12
Name: Class: Date:
Chapter 0585. A Poisson distribution is:
a. relevant when we sample from a population with only two types of members.
b. relevant when we perform a series of independent, identical experiments with only two possible outcomes.
c. usually relevant when we are interested in the number of events that occur over a given interval of time
d. the cornerstone of statistical theory
e. All of these choices
ANSWER: c
86. The Poisson random variable is a:
a. discrete random variable with infinitely many possible values
b. discrete random variable with finite number of possible values
c. continuous random variable with infinitely many possible values
d. continuous random variable with finite number of possible values
ANSWER: a
87. Which probability distribution applies to the number of events occurring within a specified period of time or space
a. Binomial distribution b. Poisson distribution
c. Any discrete probability distribution d. Any continuous probability distribution
ANSWER: b
88. If the random variable X is exponentially distributed with parameter = 3, then P(X 2) , up to 4 decimal places , is
a. 0.3333 b. 0.5000
c. 0.6667 d. 0.0025
ANSWER: d
89. If the random variable X is exponentially distributed with parameter = 1.5, then P(2 X 4), up to 4 decimal
places, is
a. 0.6667 b. 0.0473
c. 0.5000 d. 0.2500
ANSWER: b
90. The Poisson and Exponential distributions are commonly used in which of the following applications
a. Inventory models b. Financial models
c. Failure analysis models d. All of these options
ANSWER: a
91. Which of the following distributions is appropriate to measure the length of time between arrivals at a grocery checkout
counter?
a. Uniform b. Normal
c. Exponential d. Poisson
ANSWER: c
Copyright Cengage Learning. Powered by Cognero. Page 13
Name: Class: Date:
Chapter 0592. If the mean of an exponential distribution is 2, then the value of the parameter is
a. 4 b. 2
c. 1 d. 0.5
ANSWER: d
93. The number of loan defaults per month at a bank is Poisson distributed.
a. True
b. False
ANSWER: True
94. Much of the study of probabilistic inventory models, queuing models, and reliability models relies heavily on the
Poisson and Exponential distributions.
a. True
b. False
ANSWER: True
95. The Poisson probability distribution is one of the most commonly used continuous probability distributions.
a. True
b. False
ANSWER: False
96. Poisson distribution is appropriate to determine the probability of a given number of defective items in a shipment.
a. True
b. False
ANSWER: False
97. The Poisson distribution is characterized by a single parameter , which must be positive.
a. True
b. False
ANSWER: True
98. An exponential distribution with parameter = 0.2 has mean and standard deviation both equal to 5.
a. True
b. False
ANSWER: True
99. The Poisson distribution is applied to events for which the probability of occurrence over a given span of time, space,
or distance is very small.
a. True
b. False
ANSWER: True
Copyright Cengage Learning. Powered by Cognero. Page 14
Name: Class: Date:
Chapter 05100. The Poisson random variable is a discrete random variable with infinitely many possible values.
a. True
b. False
ANSWER: True
Suppose that the number of customers arriving each hour at the only checkout counter at a local convenience store is
approximately Poisson distributed with an expected arrival rate of 30 customers per hour. Let X represent the number
of customers arriving per hour. The probabilities associated with X are shown below.
P(X < 5) = 0.0000, P(X < 10) = 0.0000, P(X < 15) = 0.0009,
P(X < 20) = 0.0219, P(X < 25) = 0.1572, P(X < 30) = 0.4757
P(X = 30) = 0.0726, P(X = 31) = 0.0703, P(X = 32) = 0.0659,
P(X = 33) = 0.0599, P(X = 34) = 0.0529, P(X = 35) = 0.0453
101. What is the probability that at least 25 customers arrive at this checkout counter in a given hour?
ANSWER: 0.843
102. What is the probability that at least 20 customers, but fewer than 30 customers arrive at this checkout counter in a
given hour?
ANSWER: 0.4538
103. What is the probability that fewer than 33 customers arrive at this checkout counter in a given hour?
ANSWER: 0.6718
104. What is the probability that the number of customers who arrive at this checkout counter in a given hour will be
between 30 and 35 (inclusive)?
ANSWER: 0.3669
105. What is the probability that the number of customers who arrive at this checkout counter in a given hour will be greater
than 35?
ANSWER: 0.1574
The number of arrivals at a local gas station between 3:00 and 5:00 P.M. has a Poisson distribution with a mean of 12.
106. Find the probability that the number of arrivals between 3:00 and 5:00 P.M. is at least 10.
ANSWER: =12; P(X 10) = 0.758
107. Find the probability that the number of arrivals between 3:30 and 4:00 P.M. is at least 10.
ANSWER: = 3; P(X 10) = 0.001
108. Find the probability that the number of arrivals between 4:00 and 5:00 P.M. is exactly two.
ANSWER: = 6; P(X = 2) = 0.045
Copyright Cengage Learning. Powered by Cognero. Page 15
Name: Class: Date:
Chapter 05A used car salesman in a small town states that, on the average, it takes him 5 days to sell a car. Assume that the
probability distribution of the length of time between sales is exponentially distributed.
109. What is the probability that he will have to wait at least 8 days before making another sale?
ANSWER: 0.2019
110. What is the probability that he will have to wait between 6 and 10 days before making another sale?
ANSWER: 0.1659
The time it takes a technician to fix a computer problem is exponentially distributed with a mean of 15 minutes.
111. What is the probability density function for the time it takes a technician to fix a computer problem?
ANSWER: f(x) = (15) , x 0
112. What is the probability that it will take a technician less than 10 minutes to fix a computer problem?
ANSWER: 0.4866
113. What is the variance of the time it takes a technician to fix a computer problem?
ANSWER: Var (X) = 225
114. What is the probability that it will take a technician between 10 to 15 minutes to fix a computer problem?
ANSWER: 0.1455
A continuous random variable X has the probability density function: f(x) = 2 , 0
115. What is the distribution of X and what are the parameters?
ANSWER: Exponential with parameter = 2
116. Find the mean and standard deviation of X.
ANSWER: E(X) = Stdev (X) = 1/ = 0.5
117. What is the probability that X is between 1 and 3?
ANSWER: 0.1329
118. What is the probability that X is at most 2?
ANSWER: 0.9817
Copyright Cengage Learning. Powered by Cognero. Page 16
Name: Class: Date:
Chapter 05
[Show More]

.png)


.png)
.png)


![Preview of EEE-III-ELECTRICAL AND ELECTRONICMEASUREMENTS AND INSTRUME [10EE35]-NOTES](https://scholarfriends.com/storage/8.png)


.png)