Mathematics > EXAM > MATH 225N Week 2 Graphs Help Questions and Answers UPDATED 2022/2023| GRADED A (All)
MATH 225N Week 2 Graphs Help Questions and Answers UPDATED 2022/2023| GRADED A
Document Content and Description Below
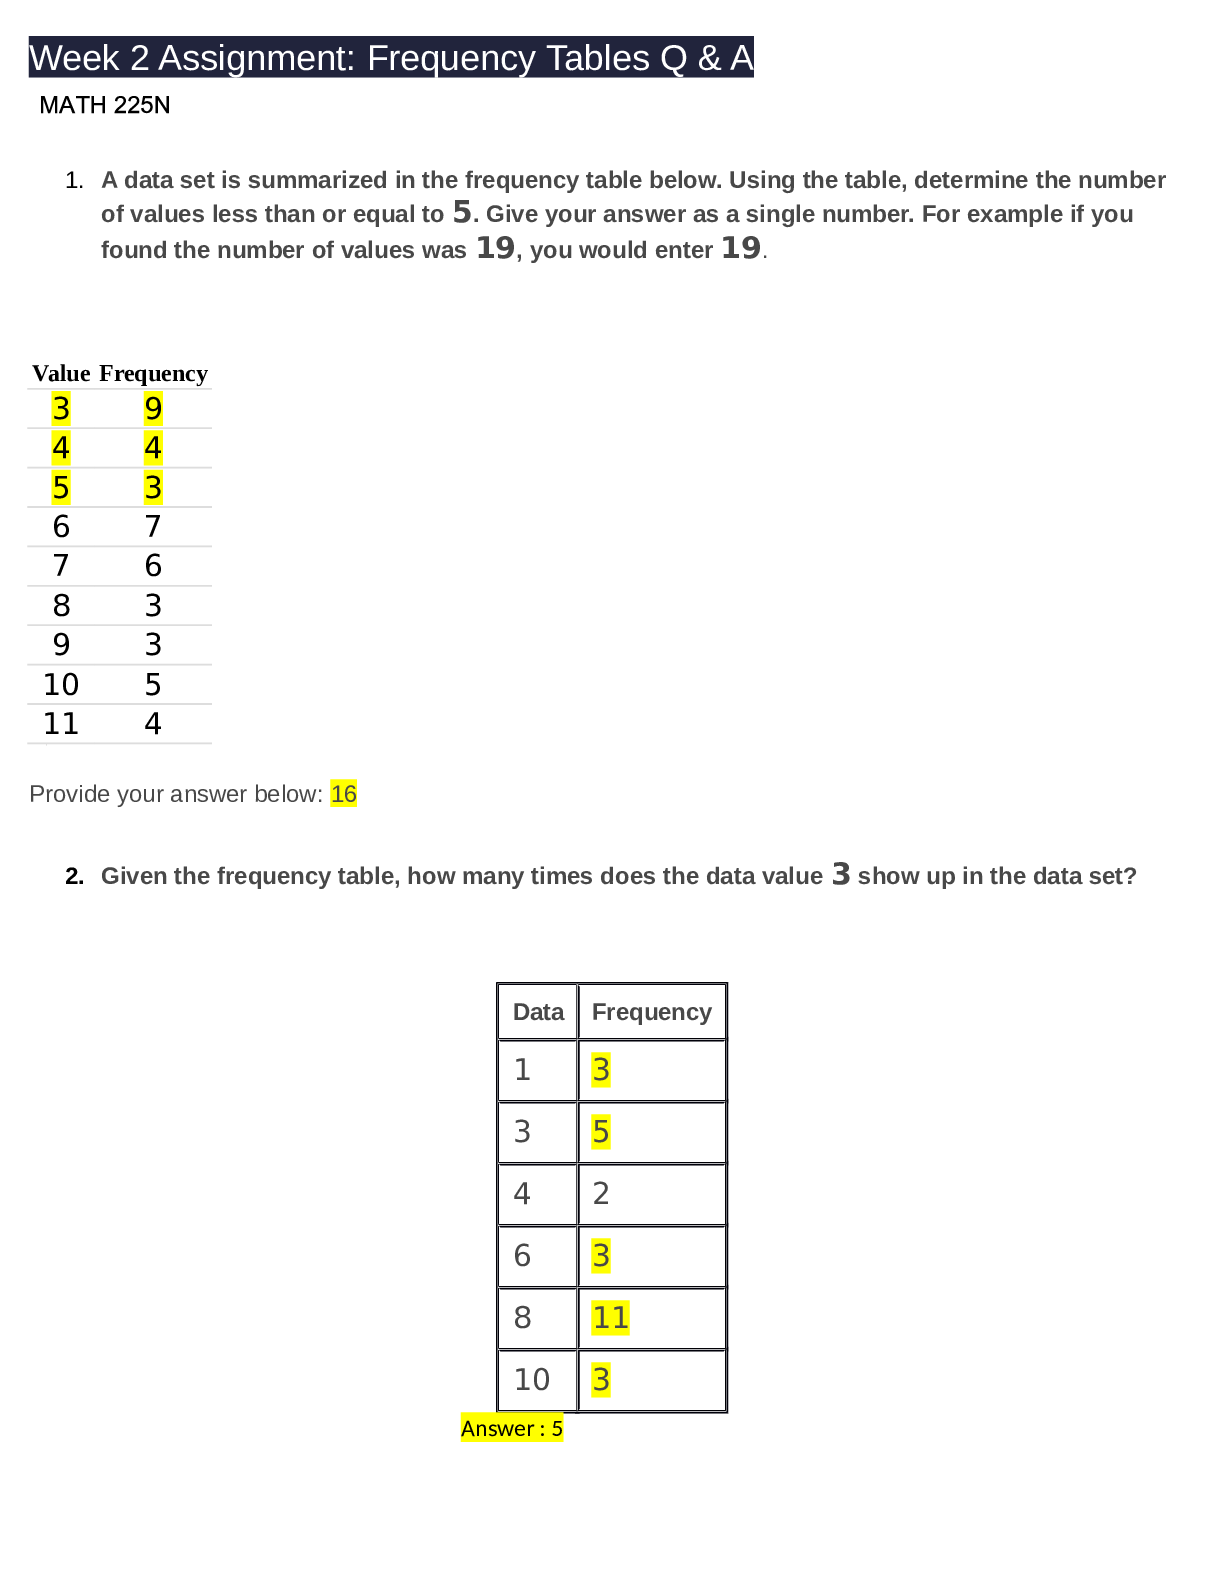
1. A data set is summarized in the frequency table below. Using the table, determine the number of values less than or equal to 5. Give your answer as a single number. For example if you found the n ... umber of values was 19, you would enter 19. Value Frequency 3 9 4 4 5 3 6 7 7 6 8 3 9 3 10 5 11 4 Provide your answer below: 16 2. Given the frequency table, how many times does the data value 3 show up in the data set? Data Frequency 1 3 3 5 4 2 6 3 8 11 10 3 Answer : 5 MATH 225N 3. A group of students were surveyed about the number of siblings they have. The frequencies and relative frequencies of their responses are shown in the below. Complete the cumulative relative frequency table. Number of Siblings Relative Frequency 0 0.18 1 0.33 2 0.16 3 0.14 4 or more 0.19 Provide your answer below:.18, .51, .67, .81, 1.0 4. Given the relative frequency table below, which of the following is the corresponding cumulative relative frequency table? Value Frequency 4 0.35 5 0.2 6 0.05 7 0.4 HelpCopy to ClipboardDownload CSV [Show More]
Last updated: 3 years ago
Preview 1 out of 20 pages
Buy this document to get the full access instantly
Instant Download Access after purchase
Buy NowInstant download
We Accept:

Reviews( 0 )
$13.00
Can't find what you want? Try our AI powered Search
Document information
Connected school, study & course
About the document
Uploaded On
Oct 27, 2022
Number of pages
20
Written in
All

Additional information
This document has been written for:
Uploaded
Oct 27, 2022
Downloads
0
Views
68