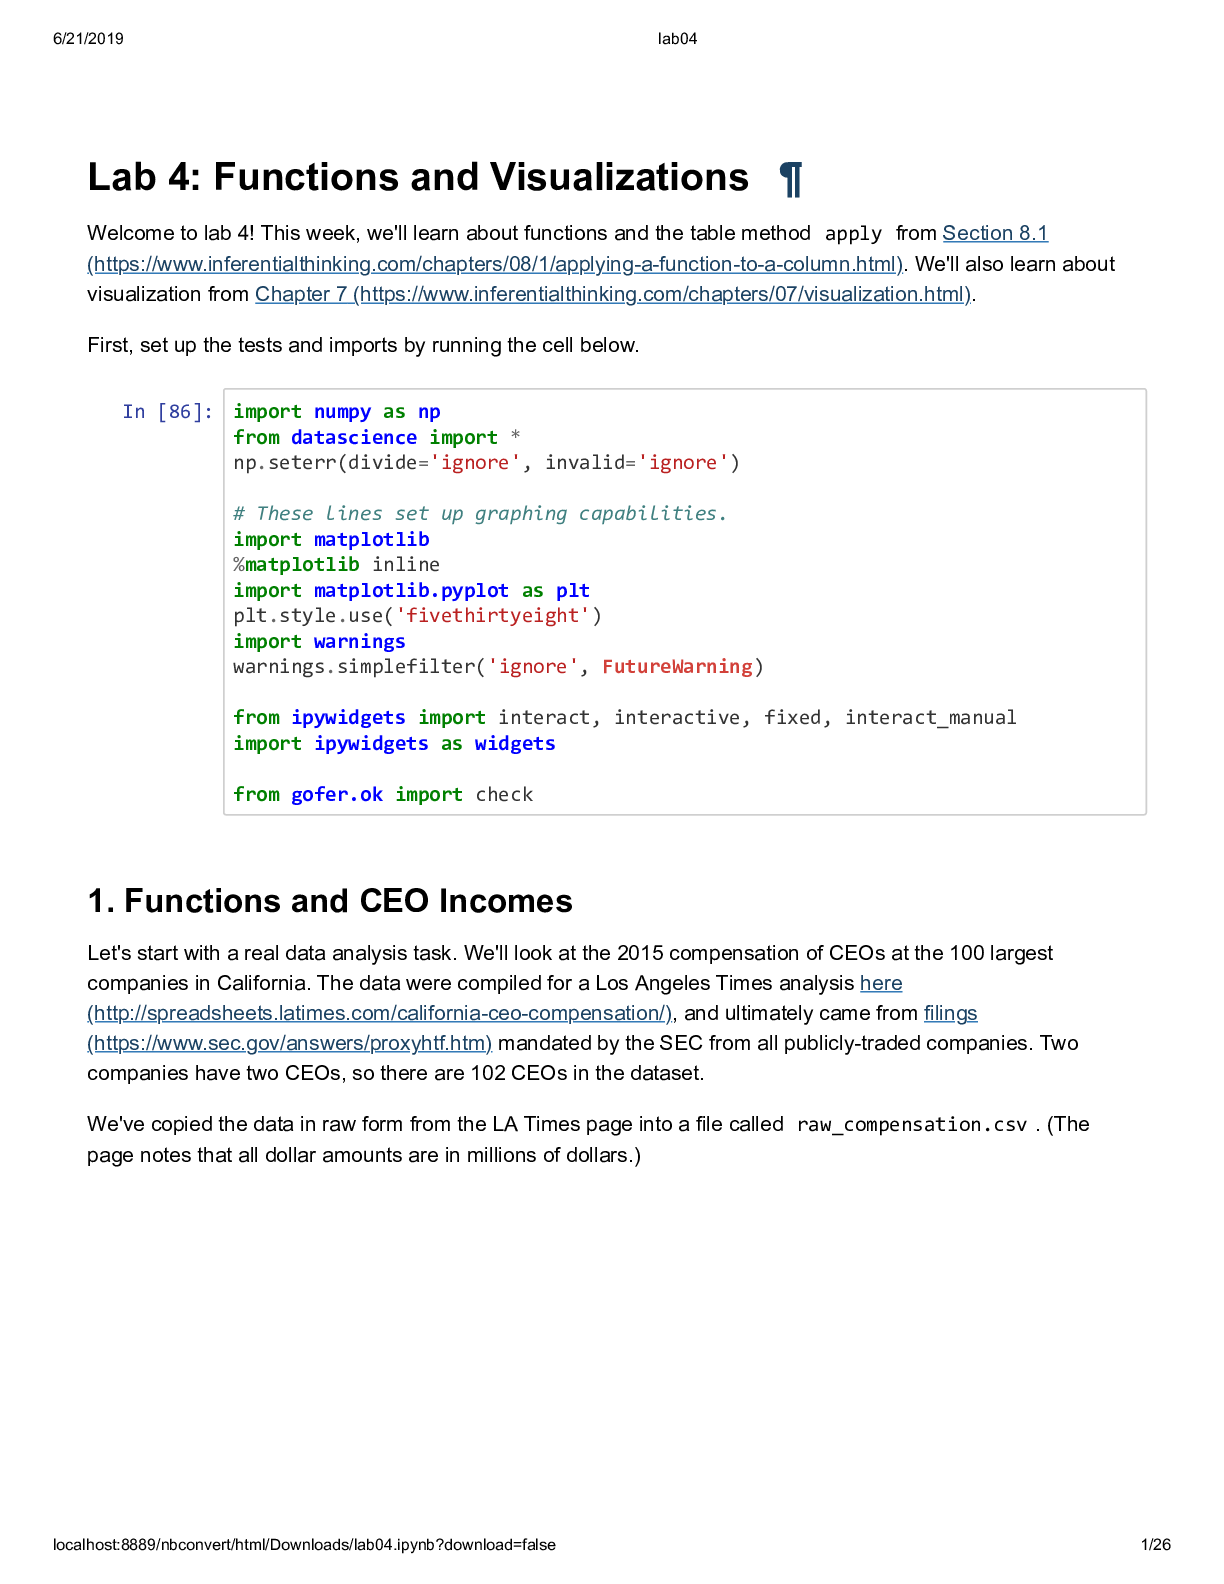
Lab 4: Functions and Visualizations 
Welcome to lab 4! This week, we'll learn about functions and the table method apply from Section 8.1
(https://www.inferentialthinking.com/chapters/08/1/applying-a-function-to-a-col
...
Lab 4: Functions and Visualizations 
Welcome to lab 4! This week, we'll learn about functions and the table method apply from Section 8.1
(https://www.inferentialthinking.com/chapters/08/1/applying-a-function-to-a-column.html). We'll also learn about
visualization from Chapter 7 (https://www.inferentialthinking.com/chapters/07/visualization.html).
First, set up the tests and imports by running the cell below.
In [86]: import numpy as np
from datascience import *
np.seterr(divide='ignore', invalid='ignore')
# These lines set up graphing capabilities.
import matplotlib
%matplotlib inline
import matplotlib.pyplot as plt
plt.style.use('fivethirtyeight')
import warnings
warnings.simplefilter('ignore', FutureWarning)
from ipywidgets import interact, interactive, fixed, interact_manual
import ipywidgets as widgets
from gofer.ok import check
1. Functions and CEO Incomes
Let's start with a real data analysis task. We'll look at the 2015 compensation of CEOs at the 100 largest
companies in California. The data were compiled for a Los Angeles Times analysis here
(http://spreadsheets.latimes.com/california-ceo-compensation/), and ultimately came from filings
(https://www.sec.gov/answers/proxyhtf.htm) mandated by the SEC from all publicly-traded companies. Two
companies have two CEOs, so there are 102 CEOs in the dataset.
We've copied the data in raw form from the LA Times page into a file called raw_compensation.csv . (The
page notes that all dollar amounts are in millions of dollars.)
6/21/2019 lab04
localhost:8889/nbconvert/html/Downloads/lab04.ipynb?download=false 2/26
In [2]: raw_compensation = Table.read_table('raw_compensation.csv')
raw_compensation
Question 1.1.
We want to compute the average of the CEOs' pay. Try running the cell below.
Out[2]:
Rank Name Company
(Headquarters)
Total
Pay
%
Change
Cash
Pay
Equity
Pay
Other
Pay
Ratio of CEO pay
to average industry
worker pay
1
Mark V.
Hurd*
Oracle
(Redwood City) $53.25
(No
previous
year)
$0.95 $52.27 $0.02 362
2
Safra A.
Catz*
Oracle
(Redwood City) $53.24
(No
previous
year)
$0.95 $52.27 $0.02 362
3
Robert A.
Iger
Walt Disney
(Burbank) $44.91 -3% $24.89 $17.28 $2.74 477
4
Marissa A.
Mayer
Yahoo!
(Sunnyvale) $35.98 -15% $1.00 $34.43 $0.55 342
5 Marc Benioff
salesforce.com
(San Francisco) $33.36 -16% $4.65 $27.26 $1.45 338
6
John H.
Hammergren
McKesson (San
Francisco) $24.84 -4% $12.10 $12.37 $0.37 222
7
John S.
Watson
Chevron (San
Ramon) $22.04 -15% $4.31 $14.68 $3.05 183
8
Jeffrey
Weiner
LinkedIn
(Mountain View) $19.86 27% $2.47 $17.26 $0.13 182
9
John T.
Chambers**
Cisco Systems
(San Jose) $19.62 19% $5.10 $14.51 $0.01 170
10 John G.
Stumpf
Wells Fargo
(San Francisco) $19.32 -10% $6.80 $12.50 $0.02 256
... (92 rows omitted)
6/21/2019 lab04
localhost:8889/nbconvert/html/Downloads/lab04.ipynb?download=false 3/26
In [5]: np.average(raw_compensation.column("Total Pay"))
You should see an error. Let's examine why this error occured by looking at the values in the "Total Pay" column.
Use the type function and set total_pay_type to the type of the first value in the "Total Pay" column.
In [6]: total_pay_type = type(raw_compensation.column("Total Pay").item(0))
total_pay_type
In [7]: check('tests/q1_1.py')
Question 1.2.
You should have found that the values in "Total Pay" column are strings (text). It doesn't make sense to take the
average of the text values, so we need to convert them to numbers if we want to do this. Extract the first value in
the "Total Pay" column. It's Mark Hurd's pay in 2015, in millions of dollars. Call it mark_hurd_pay_string .
In [8]: mark_hurd_pay_string = (raw_compensation.column("Total Pay").item(0))
mark_hurd_pay_string
In [9]: check('tests/q1_2.py')
---------------------------------------------------------------------------
TypeError Traceback (most recent call last)
in
----> 1 np.average(raw_compensation.column("Total Pay"))
/srv/conda/envs/notebook/lib/python3.7/site-packages/numpy/lib/function_base.
py in average(a, axis, weights, returned)
390
391 if weights is None:
--> 392 avg = a.mean(axis)
393 scl = avg.dtype.type(a.size/avg.size)
394 else:
/srv/conda/envs/notebook/lib
[Show More]


![Preview of eBook [PDF] Gray Hat Hacking The Ethical Hacker's Handbook 6th Edition By Allen Harper, Ry](https://browseimages.nyc3.digitaloceanspaces.com/paper-images/2025/Aug/24/lpRHB6th2025-08-24-04-5468aa70ca8c5b8.png)

![Preview of eBook [PDF] Computer Vision Challenges, Trends, and Opportunities 1st Edition By Md Atiqur](https://browseimages.nyc3.digitaloceanspaces.com/paper-images/2024/Aug/30/sO1Ff4FE2024-08-30-02-3766d1af0994f96.png)


![Preview of [eTextbook] [PDF] CompTIA Network+ Guide to Networks 9th edition By Jill West](https://browseimages.nyc3.digitaloceanspaces.com/paper-images/2025/Jan/18/o6ppor3h2025-01-18-02-55678b96c116501.png)