Elementary Statistics
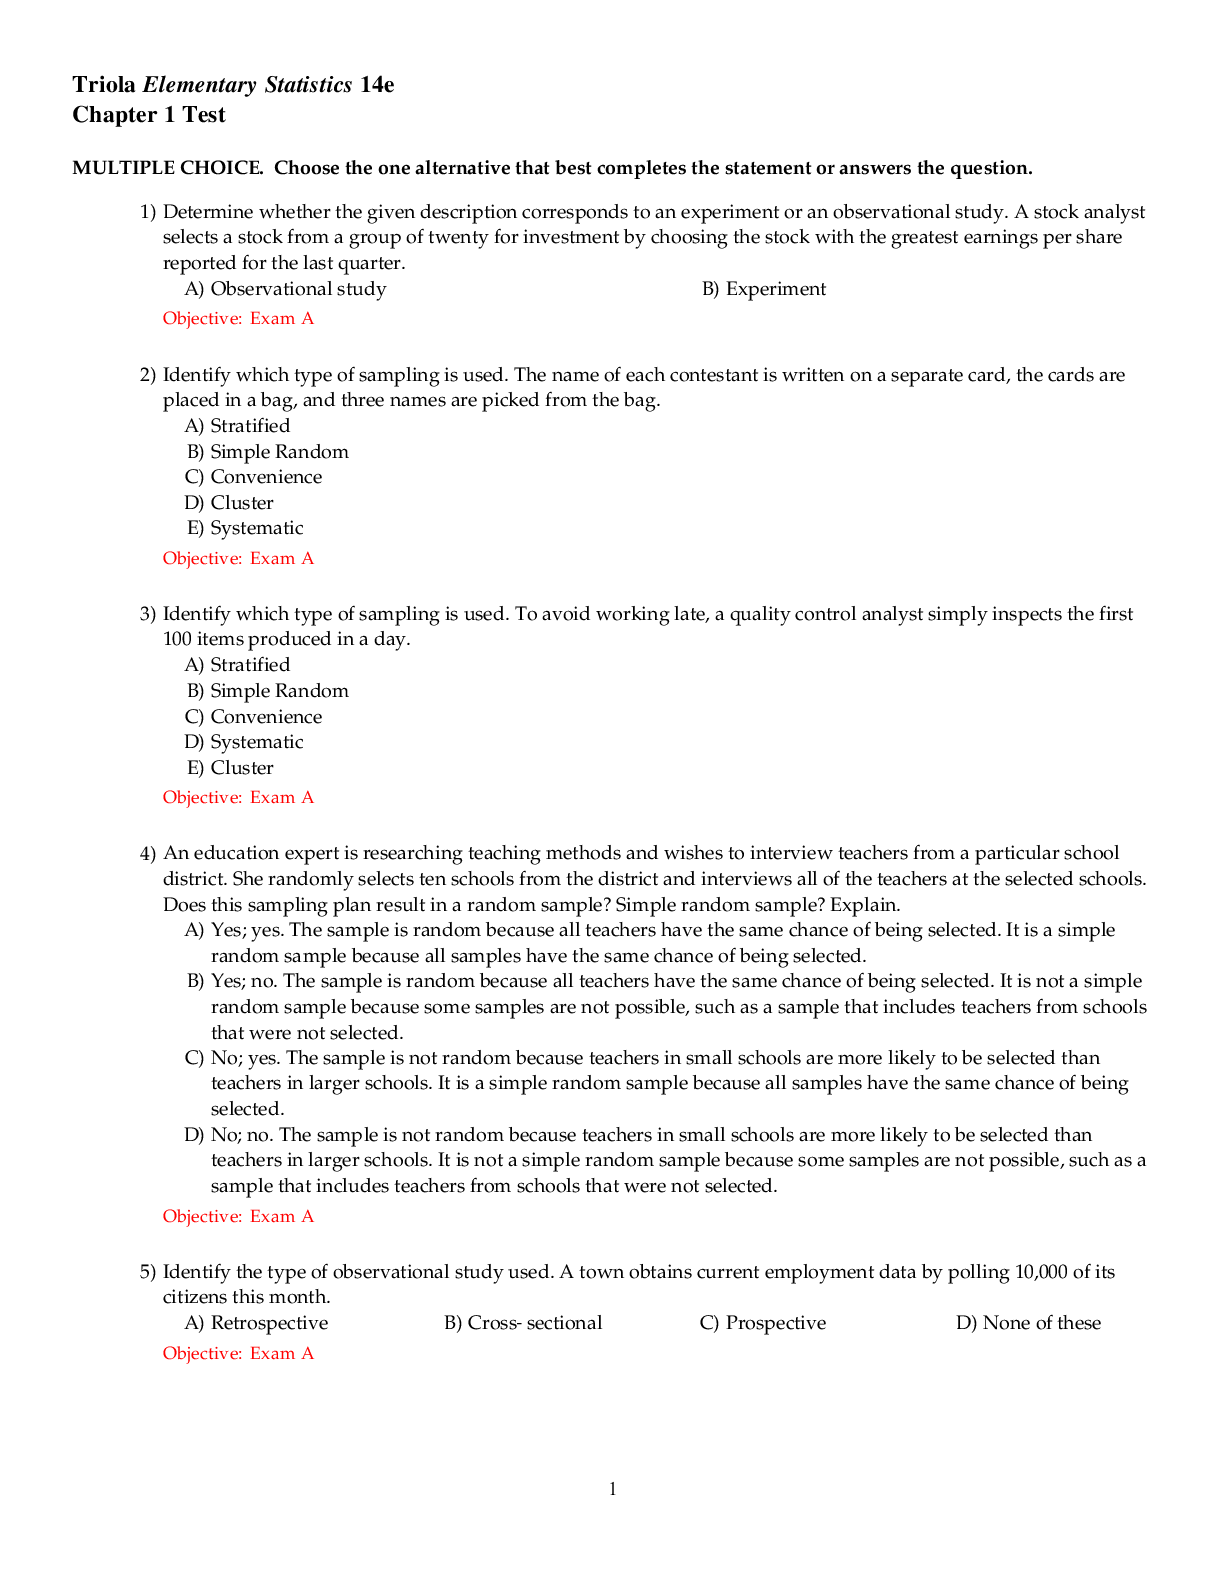
Elementary Statistics
About the Author
Contents
Preface
Goals of This Fourteenth Edition
Audience/Prerequisites
Hallmark Features
Changes to This 14th Edition
Flexible Syllabus
Resources f
...
Elementary Statistics
Elementary Statistics
About the Author
Contents
Preface
Goals of This Fourteenth Edition
Audience/Prerequisites
Hallmark Features
Changes to This 14th Edition
Flexible Syllabus
Resources for Success
Get the Most Out of MyLab Statistics®
1 Introduction to Statistics
Chapter Problem Is YouTube Becoming a More Important Learning Tool?
Flaw 1: Misleading Graphs
Flaw 2: Bad Sampling Method
Chapter Objectives
1-1 Statistical and Critical Thinking
Prepare
Analyze
Conclude
Analyzing Data: Potential Pitfalls
1-1 Basic Skills and Concepts
Statistical Literacy and Critical Thinking
Consider the Source
Sampling Method
Statistical Significance and Practical Significance
What’s Wrong?
Percentages
1-1 Beyond the Basics
1-2 Types of Data
Parameter/Statistic
Quantitative/Categorical
Discrete/Continuous
Levels of Measurement
Big Data
Missing Data
1-2 Basic Skills and Concepts
Statistical Literacy and Critical Thinking
1-2 Beyond the Basics
1-3 Collecting Sample Data
Design of Experiments
Sampling Errors
1-3 Basic Skills and Concepts
Statistical Literacy and Critical Thinking
Critical Thinking: What’s Wrong?
1-3 Beyond the Basics
1-4 Ethics in Statistics
Chapter Quick Quiz
Review Exercises
Cumulative Review Exercises
Scientific Notation
Technology Project
Big (or Very Large) Data Project
Critical Thinking: Is Being a Student More Dangerous or Unhealthy Than Being a Carpenter?
Analysis
Cooperative Group Activities
2 Exploring Data with Tables and Graphs
Chapter Problem Stuck in Traffic?
Chapter Objectives
2-1 Frequency Distributions for Organizing and Summarizing Data
Procedure for Constructing a Frequency Distribution
Relative Frequency Distribution
Cumulative Frequency Distribution
Critical Thinking: Using Frequency Distributions to Understand Data
Normal Distribution
Analysis of Last Digits
Gaps
2-1 Basic Skills and Concepts
Statistical Literacy and Critical Thinking
2-1 Beyond the Basics
2-2 Histograms
Relative Frequency Histogram
Critical Thinking: Interpreting Histograms
Common Distribution Shapes
Normal Distribution
Uniform Distribution
Skewness
2-2 Basic Skills and Concepts
Statistical Literacy and Critical Thinking
2-2 Beyond the Basics
2-3 Graphs That Enlighten and Graphs That Deceive
Graphs That Enlighten
Dotplots
Stemplots
Time-Series Graph
Bar Graphs
Pareto Charts
Pie Charts
Frequency Polygon
Graphs That Deceive
Nonzero Vertical Axis
Pictographs
Concluding Thoughts
2-3 Basic Skills and Concepts
Statistical Literacy and Critical Thinking
2-3 Beyond the Basics
2-4 Scatterplots, Correlation, and Regression
2-4 Basic Skills and Concepts
Statistical Literacy and Critical Thinking
2-4 Beyond the Basics
P-Values
Chapter Quick Quiz
Review Exercises
Cumulative Review Exercises
Technology Project
Big (or Very Large) Data Project
Were the subjects weighed or did they report their weights?
Critical Thinking
Cooperative Group Activities
3 Describing, Exploring, and Comparing Data
Chapter Problem It’s a Small World After All!
Chapter Objectives
3-1 Measures of Center
3-1 Basic Skills and Concepts
Statistical Literacy and Critical Thinking
3-1 Beyond the Basics
3-2 Measures of Variation
3-2 Basic Skills and Concepts
Statistical Literacy and Critical Thinking
3-2 Beyond the Basics
3-3 Measures of Relative Standing and Boxplots
3-3 Basic Skills and Concepts
Statistical Literacy and Critical Thinking
3-3 Beyond the Basics
Chapter Quick Quiz
Review Exercises
Cumulative Review Exercises
Technology Project
Big (or Very Large) Data Project
Second-Hand Smoke
Critical Thinking
Cooperative Group Activities
4 Probability
Chapter Problem Probability for Significance
Chapter Objectives
4-1 Basic Concepts of Probability
Complementary Events
Identifying Significant Results with Probabilities: The Rare Event Rule for Inferential Statistics
Probability Review
4-1 Basic Skills and Concepts
Statistical Literacy and Critical Thinking
Probability from a Sample Space
Using Probability for Signifiance
4-1 Beyond the Basics
Odds
4-2 Addition Rule and Multiplication Rule
Addition Rule
Notation for Addition Rule
Disjoint Events and the Addition Rule
Complementary Events and the Addition Rule
Multiplication Rule
Notation for Multiplication Rule
Independence and the Multiplication Rule
Redundancy: Important Application of Multiplication Rule
Rationale for the Multiplication Rule
Summary of Addition Rule and Multiplication Rule
4-2 Basic Skills and Concepts
Statistical Literacy and Critical Thinking
Finding Complements
Redundancy
Acceptance Sampling
4-2 Beyond the Basics
4-3 Complements, Conditional Probability, and Bayes’ Theorem
Confusion of the Inverse
4-3 Basic Skills and Concepts
Statistical Literacy and Critical Thinking
At Least One
Denomination Effect
4-3 Beyond the Basics
4-4 Counting
4-4 Basic Skills and Concepts
Statistical Literacy and Critical Thinking
4-4 Beyond the Basics
4-5 Simulations for Hypothesis Tests
4-5 Basic Skills and Concepts
Statistical Literacy and Critical Thinking
4-5 Beyond the Basics
Chapter Quick Quiz
Review Exercises
Cumulative Review Exercises
Technology Project
Big (or Very Large) Data Project
Critical Thinking: Interpreting results from a test for smoking
Analyzing the Results
Cooperative Group Activities
5 Discrete Probability Distributions
Chapter Problem Is the NFL Overtime Coin-Toss Rule Fair?
Chapter Objectives
5-1 Probability Distributions
Parameters of a Probability Distribution
Expected Value
Making Sense of Results: Significant Values
Identifying Significant Results with the Range Rule of Thumb
Identifying Significant Results with Probabilities
The Rare Event Rule for Inferential Statistics
Expected Value
Rationale for Formulas 5-1 Through 5-4
5-1 Basic Skills and Concepts
Statistical Literacy and Critical Thinking
5-1 Beyond the Basics
5-2 Binomial Probability Distributions
Methods for Finding Binomial Probabilities
Rationale for the Binomial Probability Formula
5-2 Basic Skills and Concepts
Statistical Literacy and Critical Thinking
5-2 Beyond the Basics
5-3 Poisson Probability Distributions
Poisson Distribution as Approximation to Binomial
5-3 Basic Skills and Concepts
Statistical Literacy and Critical Thinking
5-3 Beyond the Basics
Chapter Quick Quiz
Review Exercises
Cumulative Review Exercises
Technology Project
Big (or Very Large) Data Project
Critical Thinking: Using probability to test a claim
Cooperative Group Activities
6 Normal Probability Distributions
Chapter Problem So, You Want to Fly a U.S. Air Force Jet?
Chapter Objectives
6-1 The Standard Normal Distribution
Normal Distributions
Uniform Distributions
Standard Normal Distribution
Finding Probabilities When Given z Scores
Finding z Scores from Known Areas
6-1 Basic Skills and Concepts
Statistical Literacy and Critical Thinking
6-1 Beyond the Basics
6-2 Real Applications of Normal Distributions
Finding Values from Known Areas
Significance
6-2 Basic Skills and Concepts
Statistical Literacy and Critical Thinking
6-2 Beyond the Basics
6-3 Sampling Distributions and Estimators
Sampling Distribution of Sample Proportion
Sampling Distribution of the Sample Mean
Sampling Distribution of the Sample Variance
Estimators: Unbiased and Biased
6-3 Basic Skills and Concepts
Statistical Literacy and Critical Thinking
6-3 Beyond the Basics
6-4 The Central Limit Theorem
Applying the Central Limit Theorem
Introduction to Hypothesis Testing
Identifying Significant Results with Probabilities: The Rare Event Rule for Inferential Statistics
Not Exactly, but “At Least as Extreme”
Correction for a Finite Population
6-4 Basic Skills and Concepts
Statistical Literacy and Critical Thinking
6-4 Beyond the Basics
6-5 Assessing Normality
6-5 Basic Skills and Concepts
Statistical Literacy and Critical Thinking
6-5 Beyond the Basics
6-6 Normal as Approximation to Binomial (available at www.TriolaStats.com)
Chapter Quick Quiz
Review Exercises
Cumulative Review Exercises
Technology Project
Big (or Very Large) Data Project
Critical Thinking: Designing a campus dormitory elevator
Cooperative Group Activities
7 Estimating Parameters and Determining Sample Sizes
Chapter Problem Surveys: The Window to Evolving Technologies
Chapter Objectives
7-1 Estimating a Population Proportion
Point Estimate
Confidence Interval
Interpreting a Confidence Interval
Bootstrap Resampling for Constructing Confidence Intervals
Analyzing Polls
Finding the Point Estimate and E from a Confidence Interval
Using Confidence Intervals for Hypothesis Tests
Determining Sample Size
Better-Performing Confidence Intervals
Which Method Is Best?
7-1 Basic Skills and Concepts
Statistical Literacy and Critical Thinking
7-1 Beyond the Basics
7-2 Estimating a Population Mean
Estimating a Population Mean
Student t Distribution
Procedure for Constructing a Confidence Interval for μ
Bootstrap Resampling for Constructing Confidence Intervals
Finding a Point Estimate and Margin of Error E from a Confidence Interval
Using Confidence Intervals to Describe, Explore, or Compare Data
Estimating a Population Mean When σ Is Known
Choosing the Correct Distribution
Determining Sample Size
7-2 Basic Skills and Concepts
Statistical Literacy and Critical Thinking
7-2 Beyond the Basics
7-3 Estimating a Population Standard Deviation or Variance
Determining Sample Size
7-3 Basic Skills and Concepts
Statistical Literacy and Critical Thinking
7-3 Beyond the Basics
7-4 Bootstrapping: Using Technology for Estimates
7-4 Basic Skills and Concepts
Statistical Literacy and Critical Thinking
7-4 Beyond the Basics
Chapter Quick Quiz
Review Exercises
Cumulative Review Exercises
Technology Project
Chicago Commute Time
Big (or Very Large) Data Project
Critical Thinking: What does the survey tell us?
Analyzing the Data
Cooperative Group Activities
8 Hypothesis Testing
Chapter Problem Cybersecurity: Do Most Internet Users Utilize Two-Factor Authentication to Protect Their Online Data?
Chapter Objectives
8-1 Basics of Hypothesis Testing
Steps 1, 2, 3: Use the Original Claim to Create a Null Hypothesis H0 and an Alternative Hypothesis H1
Step 4: Select the Significance Level α
Step 5: Identify the Statistic Relevant to the Test and Determine Its Sampling Distribution (such as normal, t, or χ2)
Step 6: Find the Value of the Test Statistic, Then Find Either the P-Value or the Critical Value(s)
Two-Tailed, Left-Tailed, Right-Tailed
P-Value Method
P-Value and Hypothesis Testing Controversy
Critical Value Method
Step 7: Make a Decision to Either Reject H0 or Fail to Reject H0
Step 8: Restate the Decision Using Simple and Nontechnical Terms
Confidence Intervals for Hypothesis Tests
Equivalent Methods
Resampling Methods (See Section 8-5)
Part 2 Type I and Type II Errors
Part 3 Power of a Hypothesis Test
Power and the Design of Experiments
8-1 Basic Skills and Concepts
Statistical Literacy and Critical Thinking
8-1 Beyond the Basics
8-2 Testing a Claim About a Proportion
Claim: Most Internet Users Utilize Two-Factor Authentication to Protect Their Online Data
Solution: P-Value Method
Solution: Critical Value Method
Solution: Confidence Interval Method
Alternative Methods: Resampling Methods of Bootstrapping and Randomization
8-2 Basic Skills and Concepts
Statistical Literacy and Critical Thinking
8-2 Beyond the Basics
8-3 Testing a Claim About a Mean
Testing a Claim About μ with σ Not Known
Equivalent Methods
Requirement of “Normality or n>30”
Important Properties of the Student t Distribution
P-Value Method with Technology
P-Value Method Without Technology
Critical Value Method
Confidence Interval Method
Alternative Methods Used When Population Is Not Normal and n≤30
Two-Tailed Test
Testing a Claim About μ When σ Is Known
8-3 Basic Skills and Concepts
Statistical Literacy and Critical Thinking
8-3 Beyond the Basics
8-4 Testing a Claim About a Standard Deviation or Variance
8-4 Basic Skills and Concepts
Statistical Literacy and Critical Thinking
8-4 Beyond the Basics
8-5 Resampling: Using Technology for Hypothesis Testing
8-5 Basic Skills and Concepts
Statistical Literacy and Critical Thinking
8-5 Beyond the Basics
Chapter Quick Quiz
Review Exercises
Cumulative Review Exercises
Technology Project
Big (or Very Large) Data Project
Critical Thinking: Did the Official Cheat?
Analyzing the Results
Cooperative Group Activities
9 Inferences from Two Samples
Chapter Problem To Stop Smoking, Which is Better: E-Cigarettes or Nicotine Replacement?
Chapter Objectives
9-1 Two Proportions
Hypothesis Tests
P-Value Method
Critical Value Method
Confidence Intervals
Alternative Methods: Resampling Methods of Bootstrapping and Randomization
Rationale: Why Do the Procedures of This Section Work?
9-1 Basic Skills and Concepts
Statistical Literacy and Critical Thinking
9-1 Beyond the Basics
9-2 Two Means: Independent Samples
P-Value Method
Critical Value Method
Confidence Intervals
Alternative Methods: Resampling Methods of Bootstrapping and Randomization
Alternative Method: Assume That σ1=σ2 and Pool the Sample Variances
Alternative Method Used When σ1 and σ2 Are Known
Recommended Strategy for Two Independent Means
9-2 Basic Skills and Concepts
Statistical Literacy and Critical Thinking
Larger Data Sets
9-2 Beyond the Basics
9-3 Matched Pairs
Good Experimental Design
Procedures for Inferences with Matched Pairs
Equivalent Methods
Alternative Methods: Resampling Methods of Bootstrapping and Randomization
9-3 Basic Skills and Concepts
Statistical Literacy and Critical Thinking
Larger Data Sets
9-3 Beyond the Basics
9-4 Two Variances or Standard Deviations
F Distribution
Interpreting the Value of the F Test Statistic
Count Five
Levene-Brown-Forsythe Test
9-4 Basic Skills and Concepts
Statistical Literacy and Critical Thinking
9-4 Beyond the Basics
9-5 Resampling: Using Technology for Inferences
9-5 Basic Skills and Concepts
Statistical Literacy and Critical Thinking
Two Proportions
Two Means
Matched Pairs
9-5 Beyond the Basics
Chapter Quick Quiz
Review Exercises
Cumulative Review Exercises
Technology Project
Big (or Very Large) Data Project
What Is the Effect of the NFL Overtime Rule Change?
Analysis
Cooperative Group Activities
10 Correlation and Regression
Chapter Problem Are Powerball Ticket Lines Longer When the Jackpot is Higher?
Chapter Objectives
10-1 Correlation
Explore!
Interpreting Scatterplots
Measure the Strength of the Linear Correlation with r
Properties of the Linear Correlation Coefficient r
Calculating the Linear Correlation Coefficient r
Is There a Linear Correlation?
Interpreting r: Explained Variation
Interpreting r with Causation: Don’t Go There!
Common Errors Involving Correlation
One-Tailed Tests
Rationale for Methods of This Section
Formula 10-1
Formula 10-2
Part 3 Randomization Test
10-1 Basic Skills and Concepts
Statistical Literacy and Critical Thinking
10-1 Beyond the Basics
Randomization
10-2 Regression
Making Predictions
Interpreting the Regression Equation: Marginal Change
Outliers and Influential Points
Residuals and the Least-Squares Property
Residual Plots
10-2 Basic Skills and Concepts
Statistical Literacy and Critical Thinking
10-2 Beyond the Basics
10-3 Prediction Intervals and Variation
Explained and Unexplained Variation
Coefficient of Determination
10-3 Basic Skills and Concepts
Statistical Literacy and Critical Thinking
10-3 Beyond the Basics
10-4 Multiple Regression
R2 and Adjusted R2
P-Value
Finding the Best Multiple Regression Equation
Guidelines for Finding the Best Multiple Regression Equation
Tests of Regression Coefficients
Predictions With Multiple Regression
Dummy Variable as a Predictor Variable
Logistic Regression
10-4 Basic Skills and Concepts
Statistical Literacy and Critical Thinking
10-4 Beyond the Basics
10-5 Nonlinear Regression
10-5 Basic Skills and Concepts
Statistical Literacy and Critical Thinking
10-5 Beyond the Basics
Chapter Quick Quiz
Review Exercises
Cumulative Review Exercises
Technology Project
Big (or Very Large) Data Project
Critical Thinking: Do we report body measurements that are different from the actual measurements?
Cooperative Group Activities
11 Goodness-of-Fit and Contingency Tables
Chapter Problem Is There a Link Between the Measles Vaccine and Autism?
Chapter Objectives
11-1 Goodness-of-Fit
11-1 Basic Skills and Concepts
Statistical Literacy and Critical Thinking
11-1 Beyond the Basics
11-2 Contingency Tables
Test of Homogeneity
Fisher’s Exact Test
McNemar’s Test for Matched Pairs
11-2 Basic Skills and Concepts
Statistical Literacy and Critical Thinking
11-2 Beyond the Basics
Chapter Quick Quiz
Review Exercises
Cumulative Review Exercises
Technology Project
Big (or Very Large) Data Project
Critical Thinking: Was Allstate wrong?
Analyzing the Results
Cooperative Group Activities
12 Analysis of Variance
Chapter Problem Are Larger Cars Safer in Crashes?
Chapter Objectives
12-1 One-Way ANOVA
F Distribution
Calculating the Test Statistic F with Equal Sample Sizes n
Finding the Critical Value
Understanding the Effect of a Mean on the F Test Statistic
Calculations with Unequal Sample Sizes
Designing Experiments
Identifying Which Means Are Significantly Different
Bonferroni Multiple Comparison Test
12-1 Basic Skills and Concepts
Statistical Literacy and Critical Thinking
12-1 Beyond the Basics
12-2 Two-Way ANOVA
Explore Data with Means and an Interaction Graph
12-2 Basic Skills and Concepts
Statistical Literacy and Critical Thinking
12-2 Beyond the Basics
Chapter Quick Quiz
Review Exercises
Cumulative Review Exercises
Technology Project
Big (or Very Large) Data Project
Critical Thinking: Does Exposure to Lead Affect IQ Scores of Children?
Cooperative Group Activities
13 Nonparametric Tests
Chapter Problem Do Better Smartphones Cost More?
Chapter Objectives
13-1 Basics of Nonparametric Tests
13-2 Sign Test
Claims About Matched Pairs
Claims Involving Nominal Data with Two Categories
Claims About the Median of a Single Population
13-2 Basic Skills and Concepts
Statistical Literacy and Critical Thinking
Matched Pairs
Nominal Data
Appendix B Data Sets
13-2 Beyond the Basics
13-3 Wilcoxon Signed-Ranks Test for Matched Pairs
Claims Involving Matched Pairs
Claims About the Median of a Single Population
13-3 Basic Skills and Concepts
Statistical Literacy and Critical Thinking
Using the Wilcoxon Signed-Ranks Test
13-3 Beyond the Basics
13-4 Wilcoxon Rank-Sum Test for Two Independent Samples
13-4 Basic Skills and Concepts
Statistical Literacy and Critical Thinking
Wilcoxon Rank-Sum Test
Appendix B Data Sets
13-4 Beyond the Basics
13-5 Kruskal-Wallis Test for Three or More Samples
13-5 Basic Skills and Concepts
Statistical Literacy and Critical Thinking
Using the Kruskal-Wallis Test
Appendix B Data Sets
13-5 Beyond the Basics
13-6 Rank Correlation
13-6 Basic Skills and Concepts
Statistical Literacy and Critical Thinking
Testing for Rank Correlation
Appendix B Data Sets
13-6 Beyond the Basics
13-7 Runs Test for Randomness
Fundamental Principle of the Runs Test
Testing for Randomness Above and Below the Mean or Median
13-7 Basic Skills and Concepts
Statistical Literacy and Critical Thinking
Using the Runs Test for Randomness
Runs Test with Large Samples
13-7 Beyond the Basics
Chapter Quick Quiz
Review Exercises
Using Nonparametric Tests
Cumulative Review Exercises
Hershey’s Kisses
Technology Project
Big (or Very Large) Data Project
Critical Thinking: Was the draft lottery random?
Analyzing the Results
Cooperative Group Activities
14 Statistical Process Control
Chapter Problem Global Warming: Is It Real?
Chapter Objectives
14-1 Control Charts for Variation and Mean
Process Data
Run Chart
Interpreting Run Charts
Out of Control Criteria
Causes of Variation
Control Charts
Interpreting Control Charts
Out-of-Control-Criteria
Control Chart for Monitoring Variation: The R Chart
Control Chart for Monitoring Means: The x¯ Chart
14-1 Basic Skills and Concepts
Statistical Literacy and Critical Thinking
14-1 Beyond the Basics
14-2 Control Charts for Attributes
14-2 Basic Skills and Concepts
Statistical Literacy and Critical Thinking
14-2 Beyond the Basics
Chapter Quick Quiz
Review Exercises
Cumulative Review Exercises
Technology Project
Big (or Very Large) Data Project
Critical Thinking: Are the axial loads within statistical control? Is the process of manufacturing cans proceeding as it should?
Analyzing the Results
Cooperative Group Activities
15 Holistic Statistics
Chapter Problem Is the Body Temperature of 98.6°F a Myth?
Chapter Objectives
Is the Body Temperature of 98.6°F a Myth?
Prepare
Context
Source
Sampling Method
Analyze
Graph the Data
Explore the Data
Apply Statistical Methods
Conclusion
Statistical and Practical Significance
There’s More to the Story
Key Takeaways
Holistic Exercises
Appendix A Tables and Formulas
Negative z Scores
Positive z Scores
Formulas by Mario F. Triola Copyright 2022 Pearson Education, Inc.
Ch. 3: Descriptive Statistics
Ch. 4: Probability
Ch. 5: Probability Distributions
Ch. 6: Normal Distribution
Ch. 7: Confidence Intervals (one population)
Ch. 7: Sample Size Determination
Ch. 8: Test Statistics (one population)
Ch. 9: Confidence Intervals (two populations)
Ch. 9: Test Statistics (two populations)
Ch. 10: Linear Correlation/Regression
Ch. 11: Goodness-of-Fit and Contingency Tables
Ch. 12: One-Way Analysis of Variance
Ch. 12: Two-Way Analysis of Variance
Ch. 13: Nonparametric Tests
Ch. 14: Control Charts
Procedure for Hypothesis Tests
Hypothesis Tests: Wording of Final Conclusion
Finding P-Values
Appendix B Data Sets
Data Set 1: Body Data
Data Set 2: ANSUR I 1988
Data Set 3: ANSUR II 2012
Data Set 4: Measured and Reported
Data Set 5: Body Temperatures
Data Set 6: Births
Data Set 7: Audiometry
Data Set 8: Vision
Data Set 9: Foot and Height
Data Set 10: Family Heights
Data Set 11: IQ and Lead
Data Set 12: IQ and Brain Size
Data Set 13: Freshman 15
Data Set 14: Word Counts
Data Set 15: Passive and Active Smoke
Data Set 16: Cigarette Contents
Data Set 17: Arsenic in Rice
Data Set 18: Bear Measurements
Data Set 19: Manatee Boat Deaths
Data Set 20: Alcohol and Tobacco in Movies
Data Set 21: Oscar Winner Age
Data Set 22: Presidents
Data Set 23: Nobel Laureates and Chocolate
Data Set 24: Earthquakes
Data Set 25: Tornadoes
Data Set 26: Old Faithful
Data Set 27: Internet Traffic
Data Set 28: Course Evaluations
Data Set 29: Speed Dating
Data Set 30: Queues
Data Set 31: Commute Times
Data Set 32: Taxis
Data Set 33: Disney World Wait Times
Data Set 34: Airport Data Speeds
Data Set 35: Car Data
Data Set 36: Fast Food
Data Set 37: Cola Weights and Volumes
Data Set 38: Candies
Data Set 39: Chocolate Chip Cookies
Data Set 40: Coin Weights
Data Set 41: Aluminum Cans
Data Set 42: Garbage Weight
Data Set 43: Draft Lottery
Data Set 44: Weights of Minted Quarters
Data Set 45: Births in New York
Data Set 46: Dow Jones Industrial Average (DJIA)
Appendix C Websites and Bibliography of Books
Websites
Books
Appendix D
Credits
[Show More]
![Preview of Elementary Statistics, 14th Edition By Mario Triola [PDF] [eBook]](https://scholarfriends.com/storage/eBook for Elementary Statistics, 14th Edition By Mario Triola.png)


![Preview of eBook [PDF] Mind on Statistics 6th Edition By Utts Heckard](https://browseimages.nyc3.digitaloceanspaces.com/paper-images/2026/04/29/YJskuJXm2026-04-29-08-2869f1970eda885.png)


.png)