Macro Topic 1.2
The Production Possibilities Curve
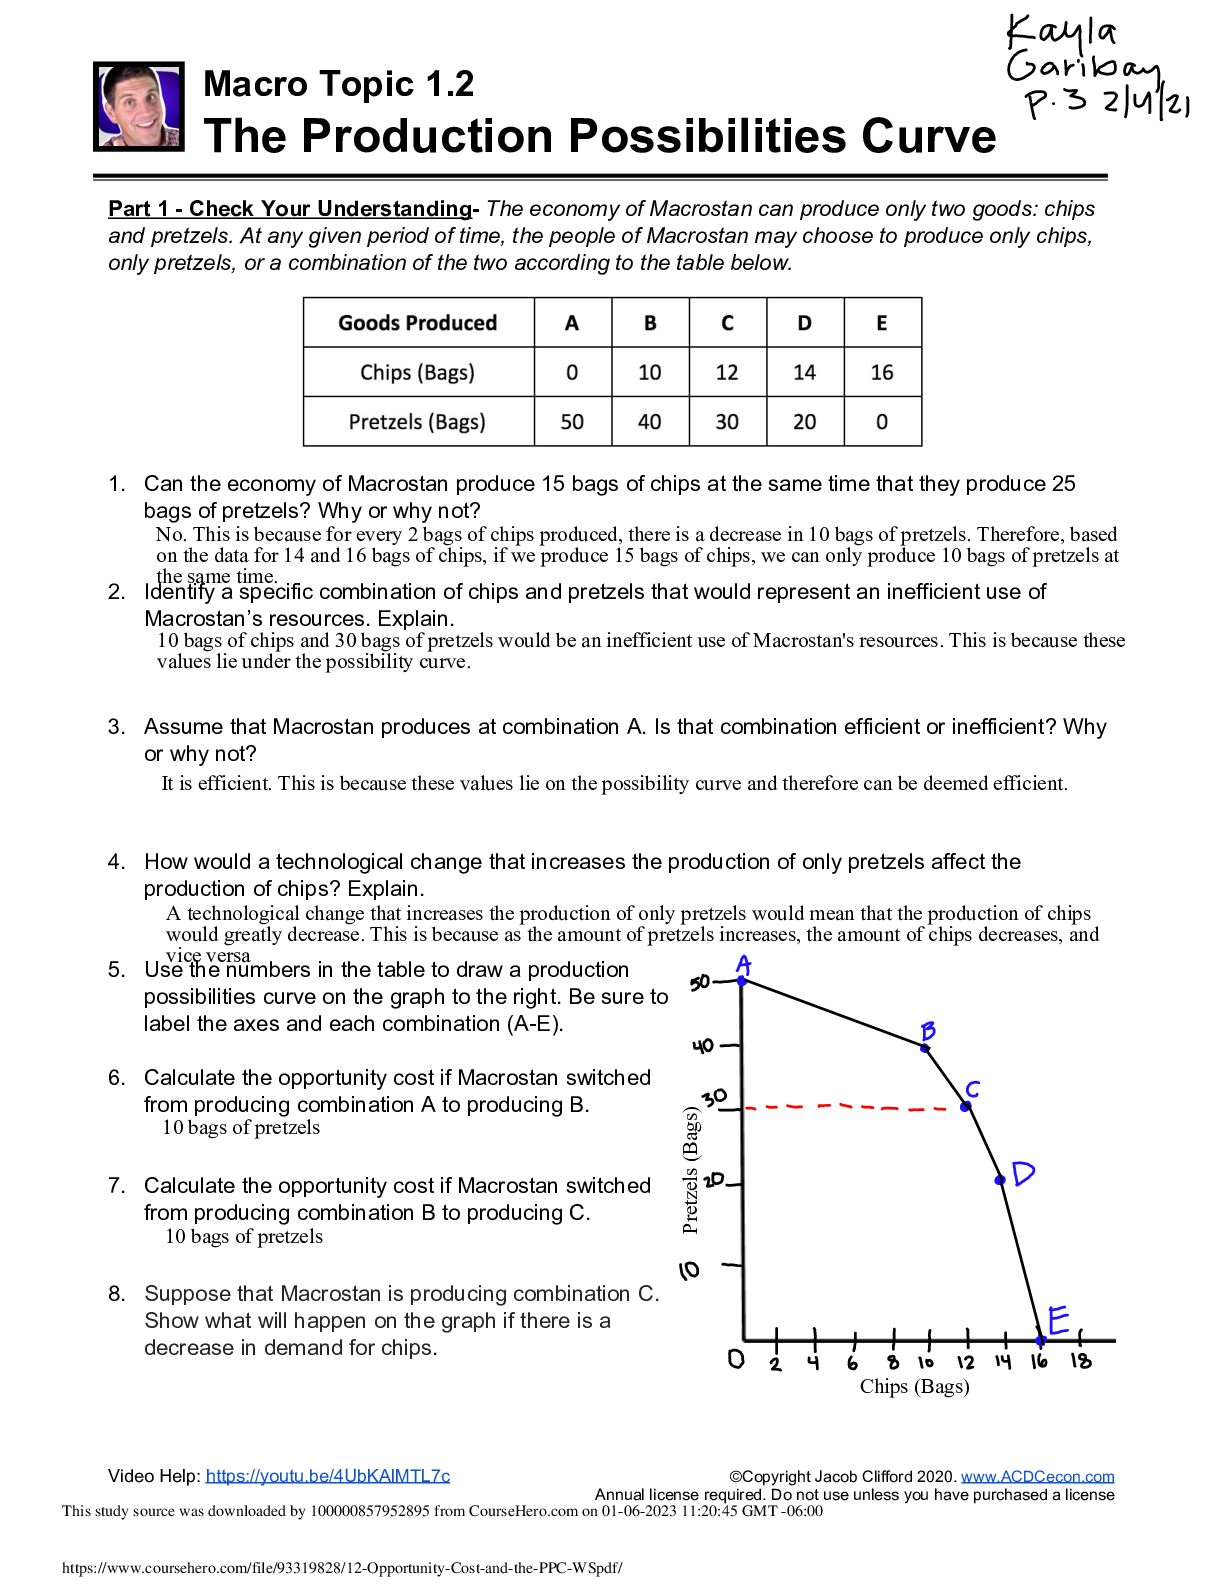
Part 1 - Check Your Understanding- The economy of Macrostan can produce only two goods: chips
and pretzels. At any given period of time, the people of Macrostan may c
...
Macro Topic 1.2
The Production Possibilities Curve
Part 1 - Check Your Understanding- The economy of Macrostan can produce only two goods: chips
and pretzels. At any given period of time, the people of Macrostan may choose to produce only chips,
only pretzels, or a combination of the two according to the table below.
1. Can the economy of Macrostan produce 15 bags of chips at the same time that they produce 25
bags of pretzels? Why or why not?
2. Identify a specific combination of chips and pretzels that would represent an inefficient use of
Macrostan’s resources. Explain.
Annual license required. Do not use unless you have purchased a license
No. This is because for every 2 bags of chips produced, there is a decrease in 10 bags of pretzels. Therefore, based
on the data for 14 and 16 bags of chips, if we produce 15 bags of chips, we can only produce 10 bags of pretzels at
the same time.
Macro Topic 1.2
The Production Possibilities Curve
Part 2 - Practice- Assume that the economy of Econland can produce robots (capital goods) and toy
drones (consumer goods). Use the table below to answer the questions.
9. Use the numbers in the table to draw a production possibilities curve on the graph to the right. Be sure
to label the axes and each combination (A-E).
10. Calculate the opportunity cost if Econland
switched from producing combination A to
producing combination B.
11. Assume that robots are capital goods. On your
graph, show the long-term effect of a
technological improvement that increases the
production of robots. Explain.
12. Assume the economy of Econland intentionally
decides to produce combination D rather than
combination B. What is the short term result and
long-run trade-off of this decision? Explain.
Part 3 - Making Connections- Compare the production possibilities of Macrostan and Econland to
answer the following questions.
13. Which of the two economies represents the idea of constant opportunity cost? Explain.
14. Which of the two economies represents the idea of increasing opportunity cost? Explain.
15. Assume that your classmate suggested that both graphs represent constant opportunity costs
because movement from combinations A to B, B to C, and C to D stays the same for each
economy. Explain why this is incorrect.
Video Help: https://youtu.be/4UbKAlMTL7c www.ACDCecon.com
[Show More]


.png)
.png)