NMLS,NMLS Practice Test Hard Questions, Test Prep, final exam, SAFE EXAM, study guide Bundle with Complete Solutions
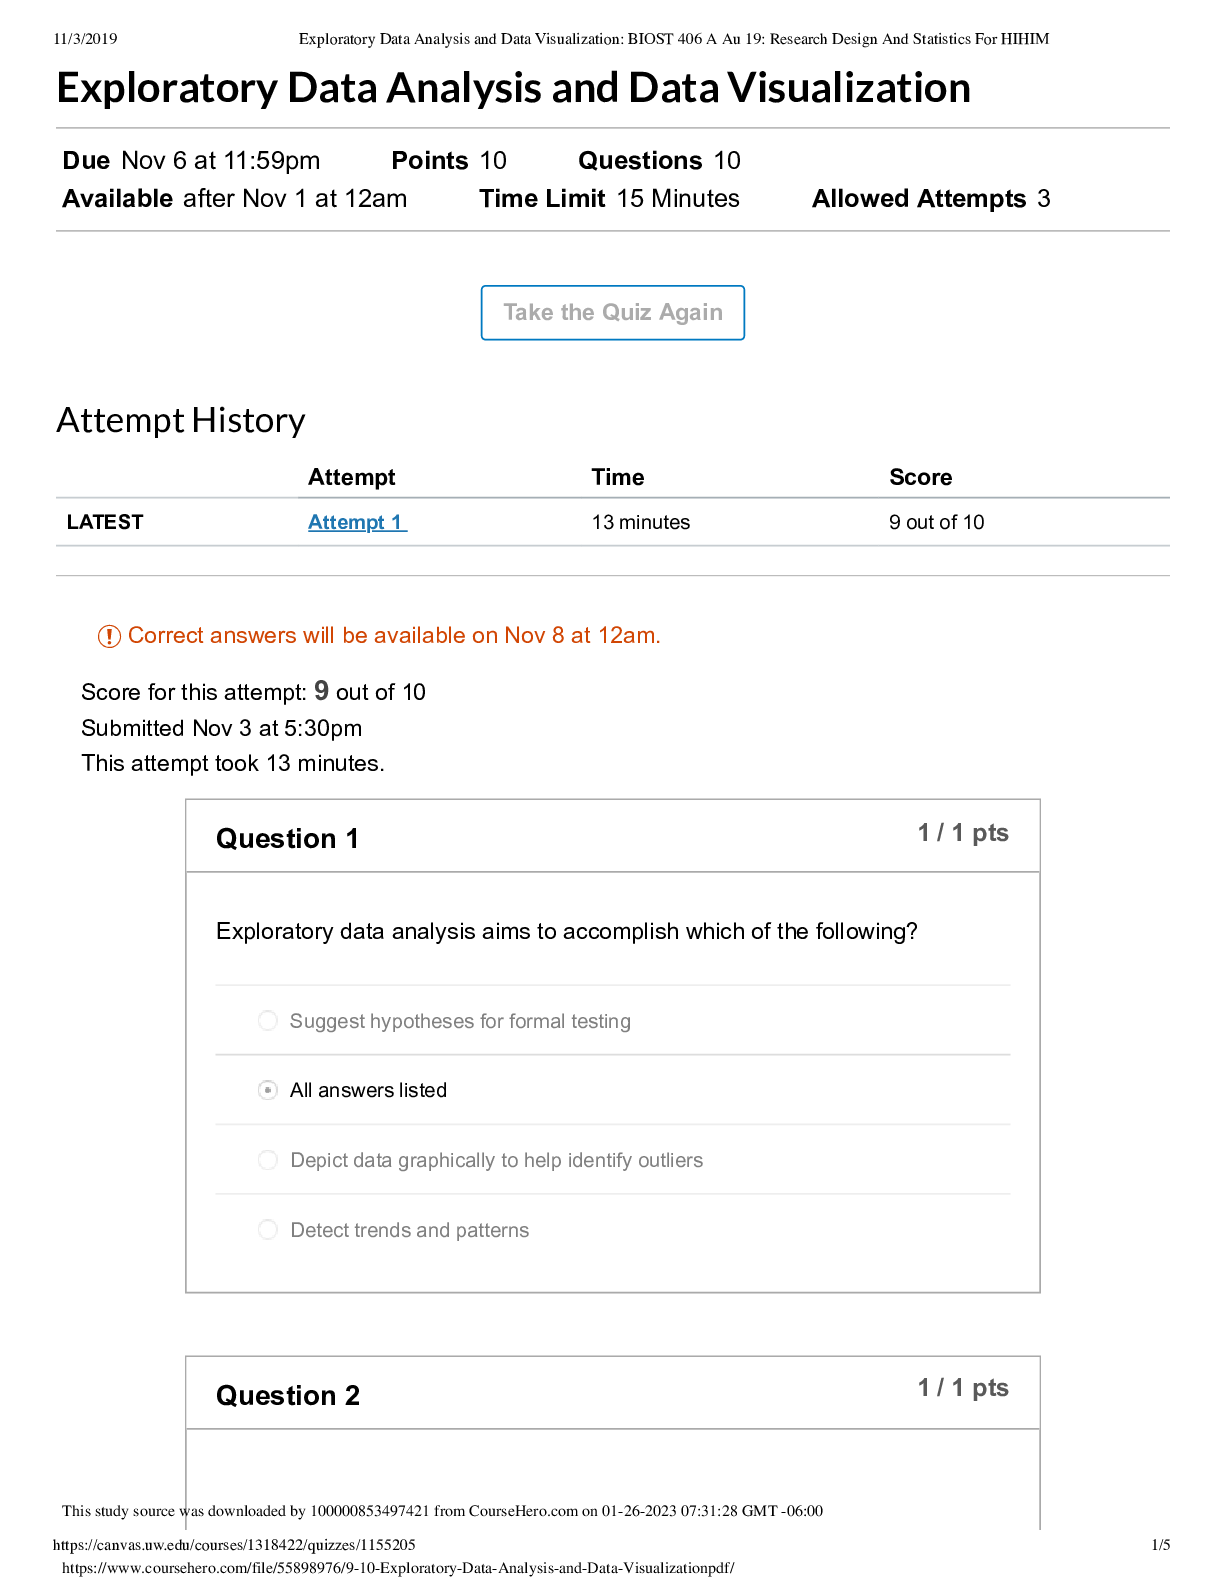
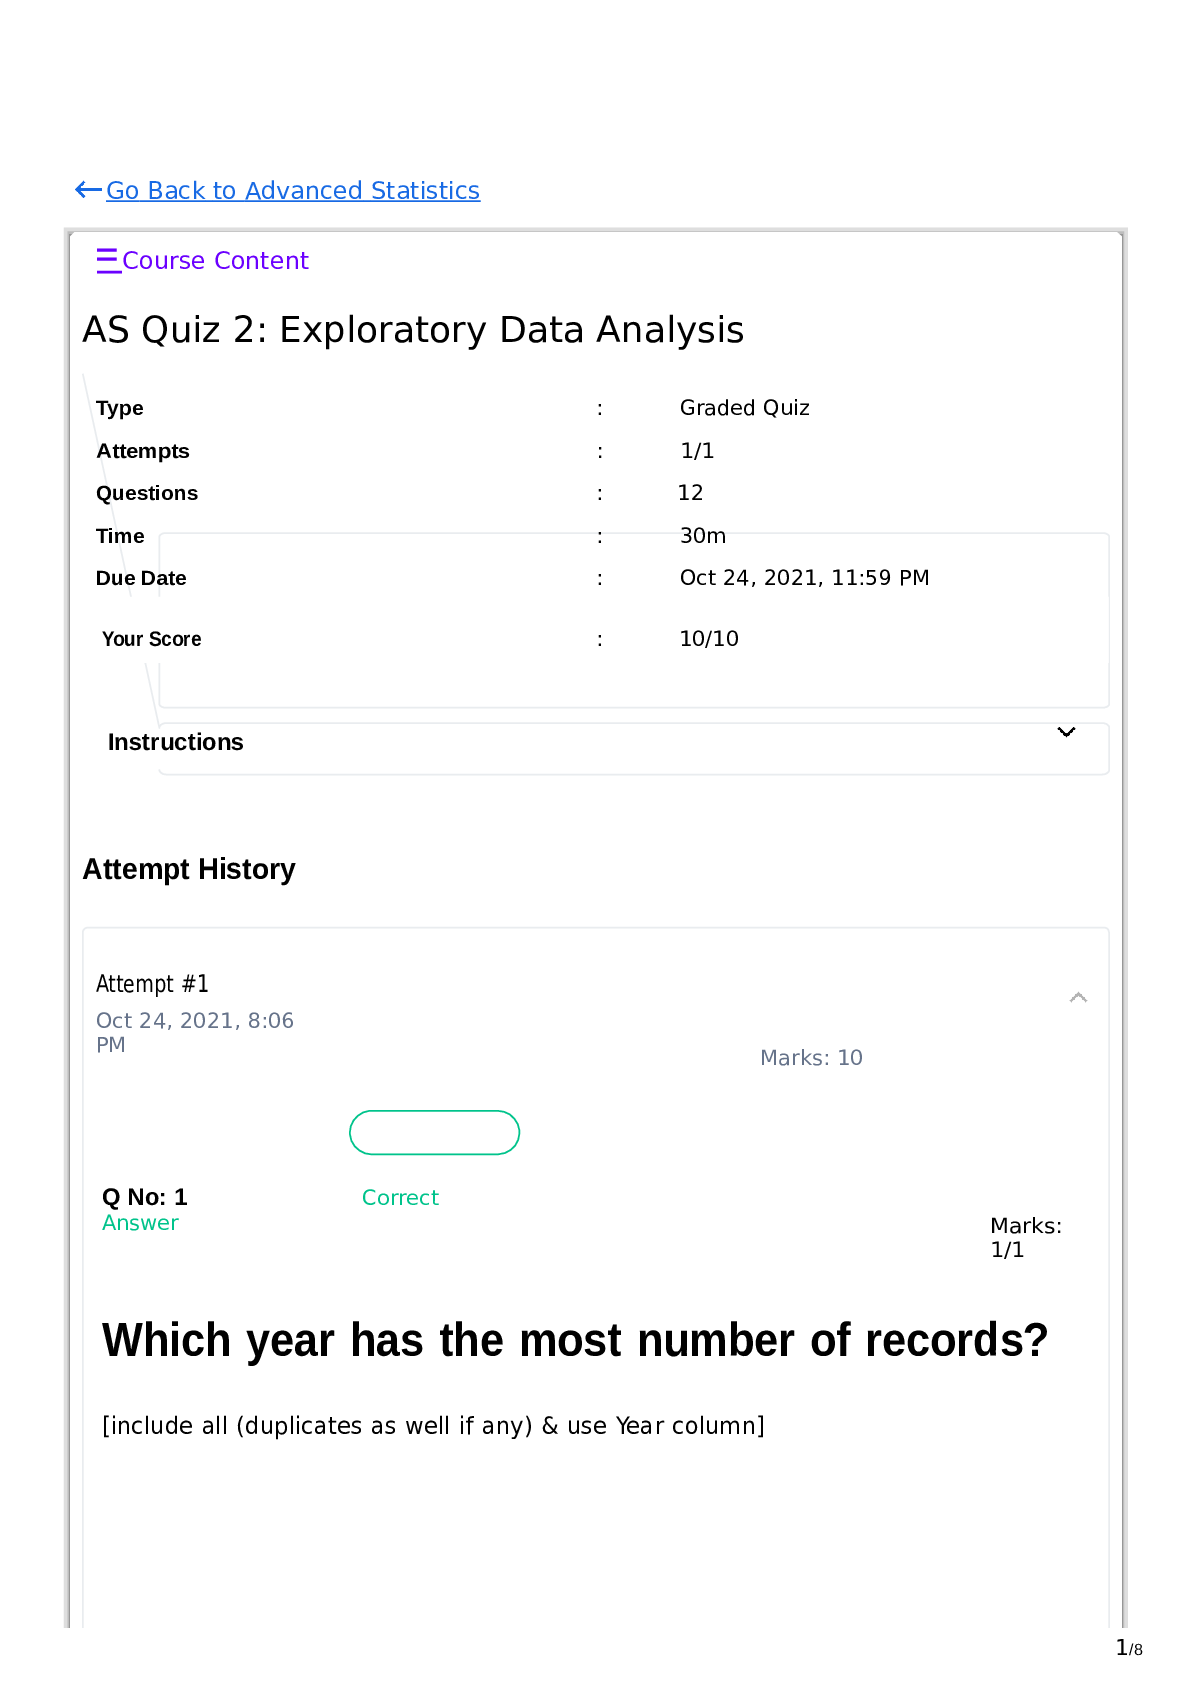
DATA ANALYSIS > Quiz > Exploratory Data Analysis and Data Visualization Exploratory (All)
Last updated: 3 years ago
Preview 1 out of 5 pages
Instant download
Buy this Document to get the Full Access Instantly
Provided by Students Who Aced it
We Verify Document Content to Gurantee Accuracy
Connected school, study & course
About the document
Uploaded On
Jan 26, 2023
Number of pages
5
Written in
All
This document has been written for:
Uploaded
Jan 26, 2023
Downloads
0
Views
174


.png)
Scholarfriends.com Online Platform by Browsegrades Inc. 651N South Broad St, Middletown DE. United States.
We're available through e-mail, Twitter, and live chat.
FAQ
Questions? Leave a message!
Copyright © Scholarfriends · High quality services·