Psychology > QUESTION PAPER & MARK SCHEME > Psychology Making Sense of Data 1010 (All)
Psychology Making Sense of Data 1010
Document Content and Description Below
Last updated: 3 years ago
Preview 1 out of 25 pages
Instant download

Buy this Document to get the Full Access Instantly
Provided by Students Who Aced it
We Verify Document Content to Gurantee Accuracy
Reviews( 0 )
Document information
Connected school, study & course
About the document
Uploaded On
Feb 01, 2023
Number of pages
25
Written in
All

Additional information
This document has been written for:
Uploaded
Feb 01, 2023
Downloads
0
Views
151
Topic Tags
Recommended For You
Get more on QUESTION PAPER & MARK SCHEME »
Social Psychology, Canadian Edition, 7th Canadian Edition, 7e...

Test Bank for Engineering Psychology and Human Performance, 5t...
Health Psychology: A Biopsychosocial Approach 6th Edition by R...

Test Bank for The Principles of Learning and Behavior, 7th Edi...
Introduction to Psychology Gateways to Mind and Behavior with...
Introduction to Psychology v. 2.1 Charles Stangor (Test Bank)
Introduction to Political Psychology 3rd Edition By Martha Cot...
Psychology Around Us, 4th Canadian Edition 4th Edition By Nanc...
Test Bank for Health Psychology, 10th Edition by Shelley E. Ta...

Health Psychology An Introduction to Behavior and Health, 9e L...

Health Psychology 1st Canadian Edition 1e Edward Sarafino, Tim...

Health Psychology 1st Canadian Edition 1e Edward Sarafino, Tim...


Exploring Psychology, 12e David Myers, Nathan DeWall (Test Ban...
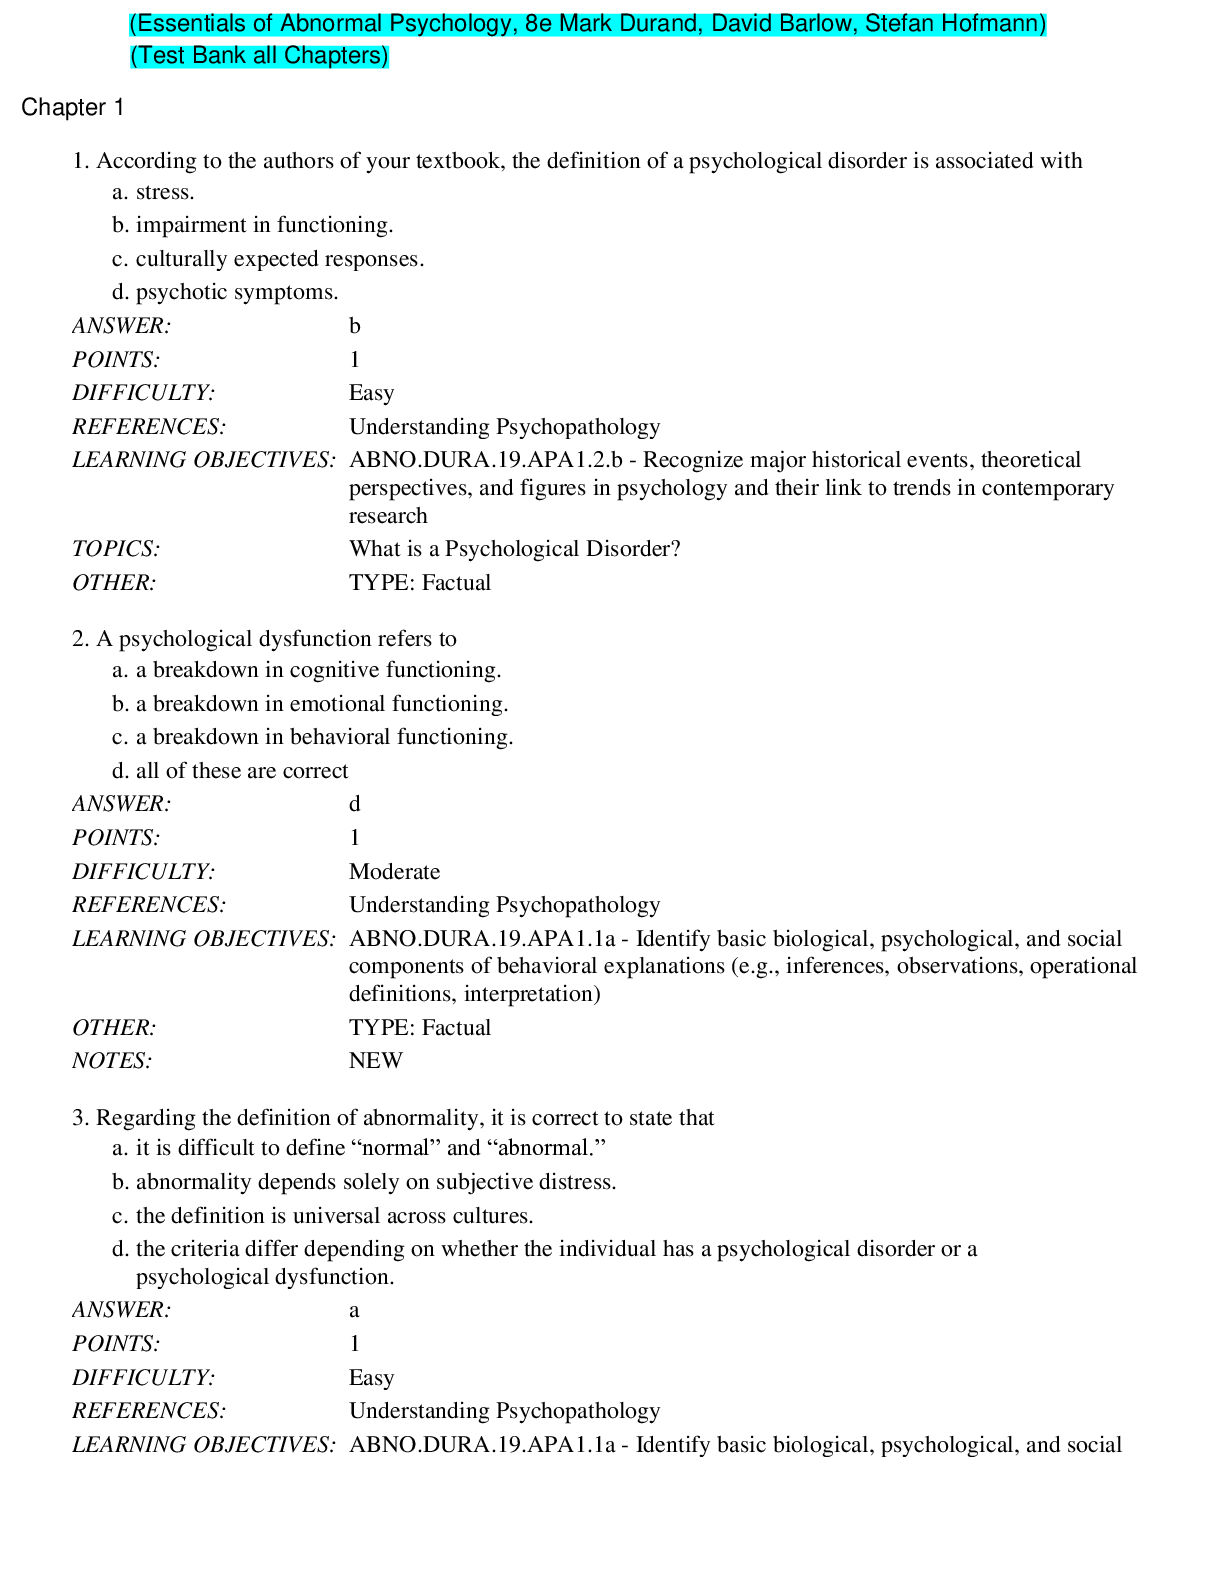
TEST BANK for Essentials of Abnormal Psychology, 8th Edition D...
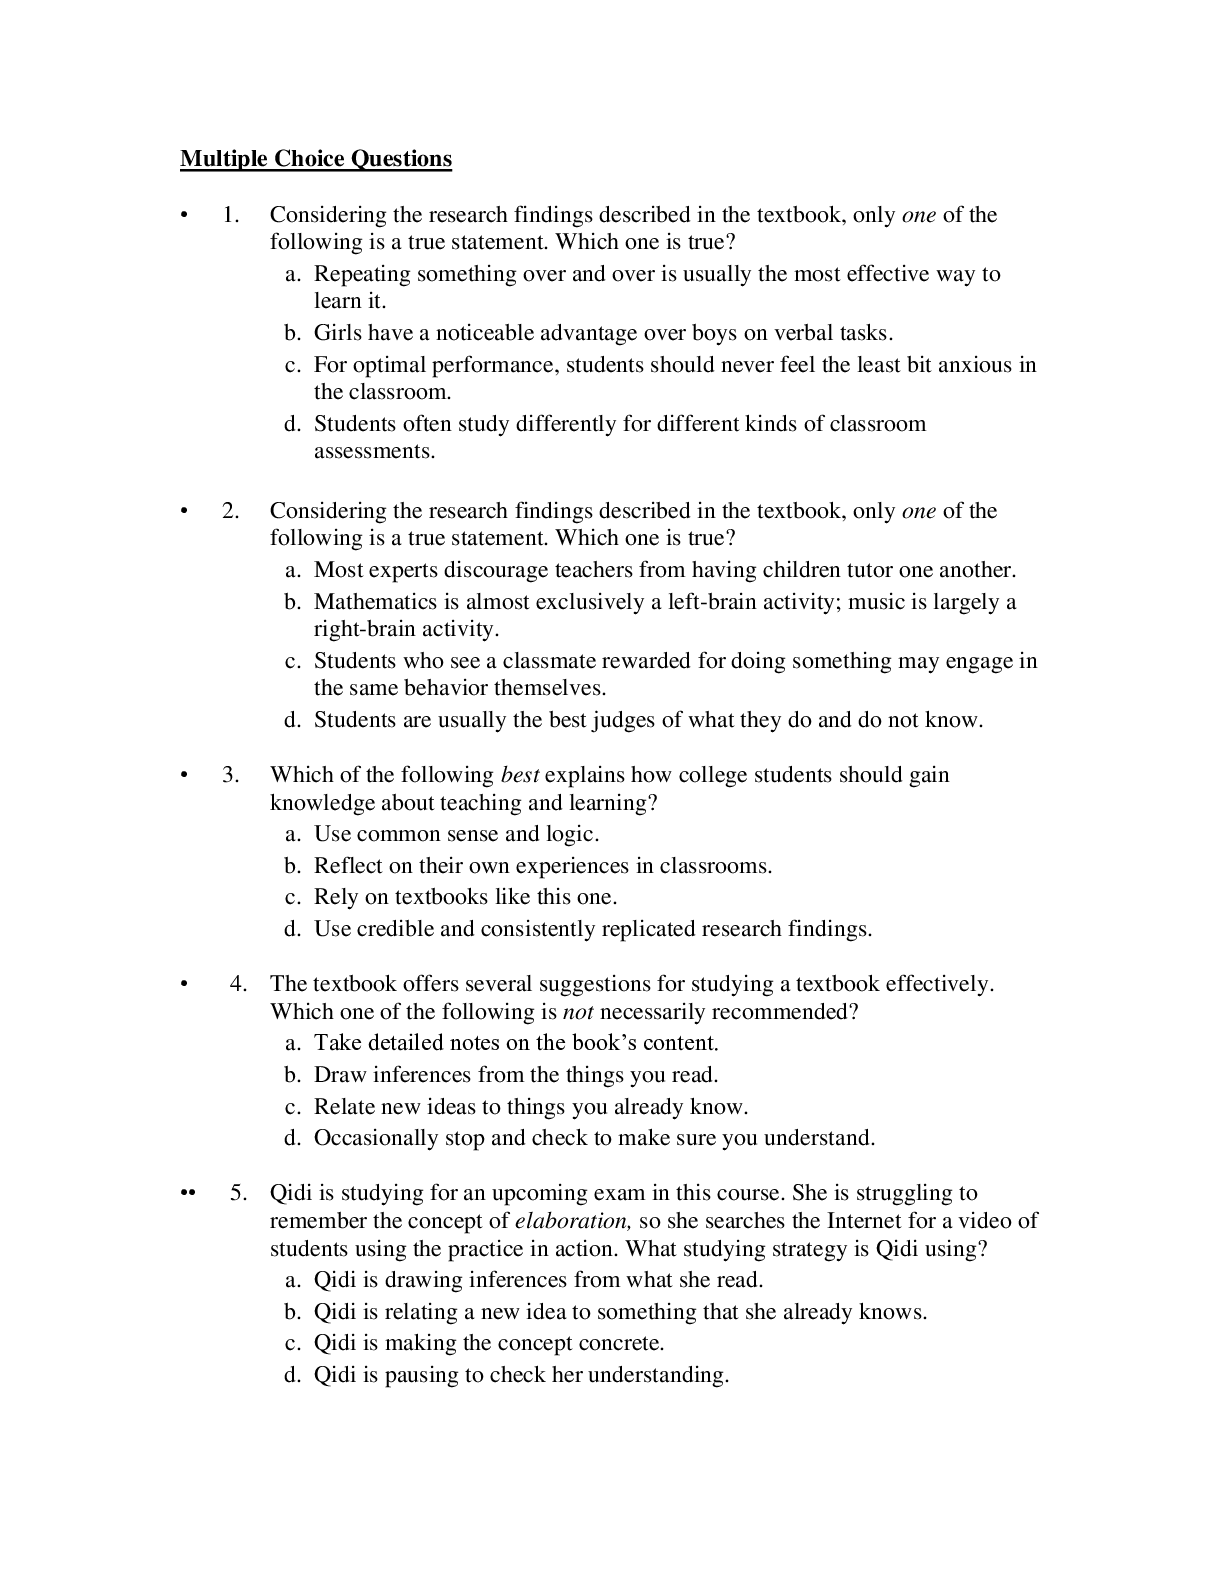
Educational Psychology Developing Learners, 10e Jeanne Ellis O...
Social Psychology, Canadian Edition, 7th Canadian Edition, 7e...

Development Through Life A Psychosocial Approach, 13e Barbara...


