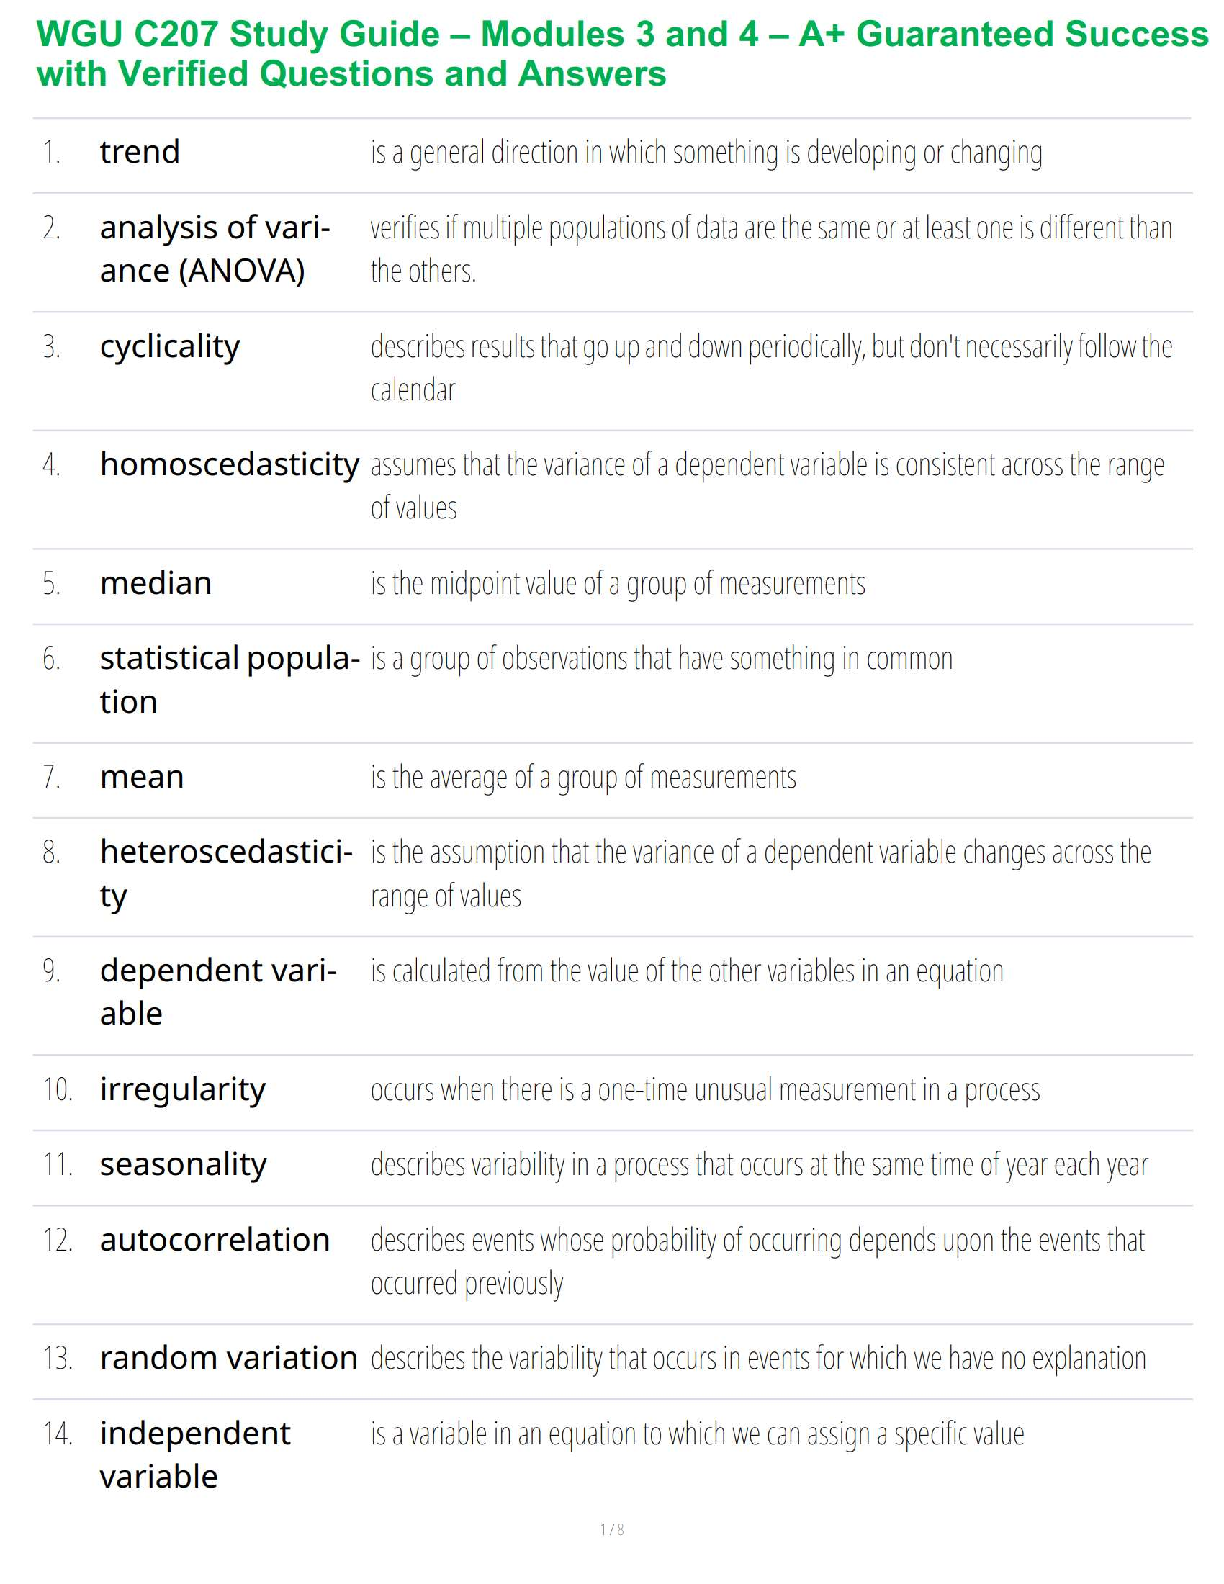
WGU C207 Data Driven Decision Making
Already Passed
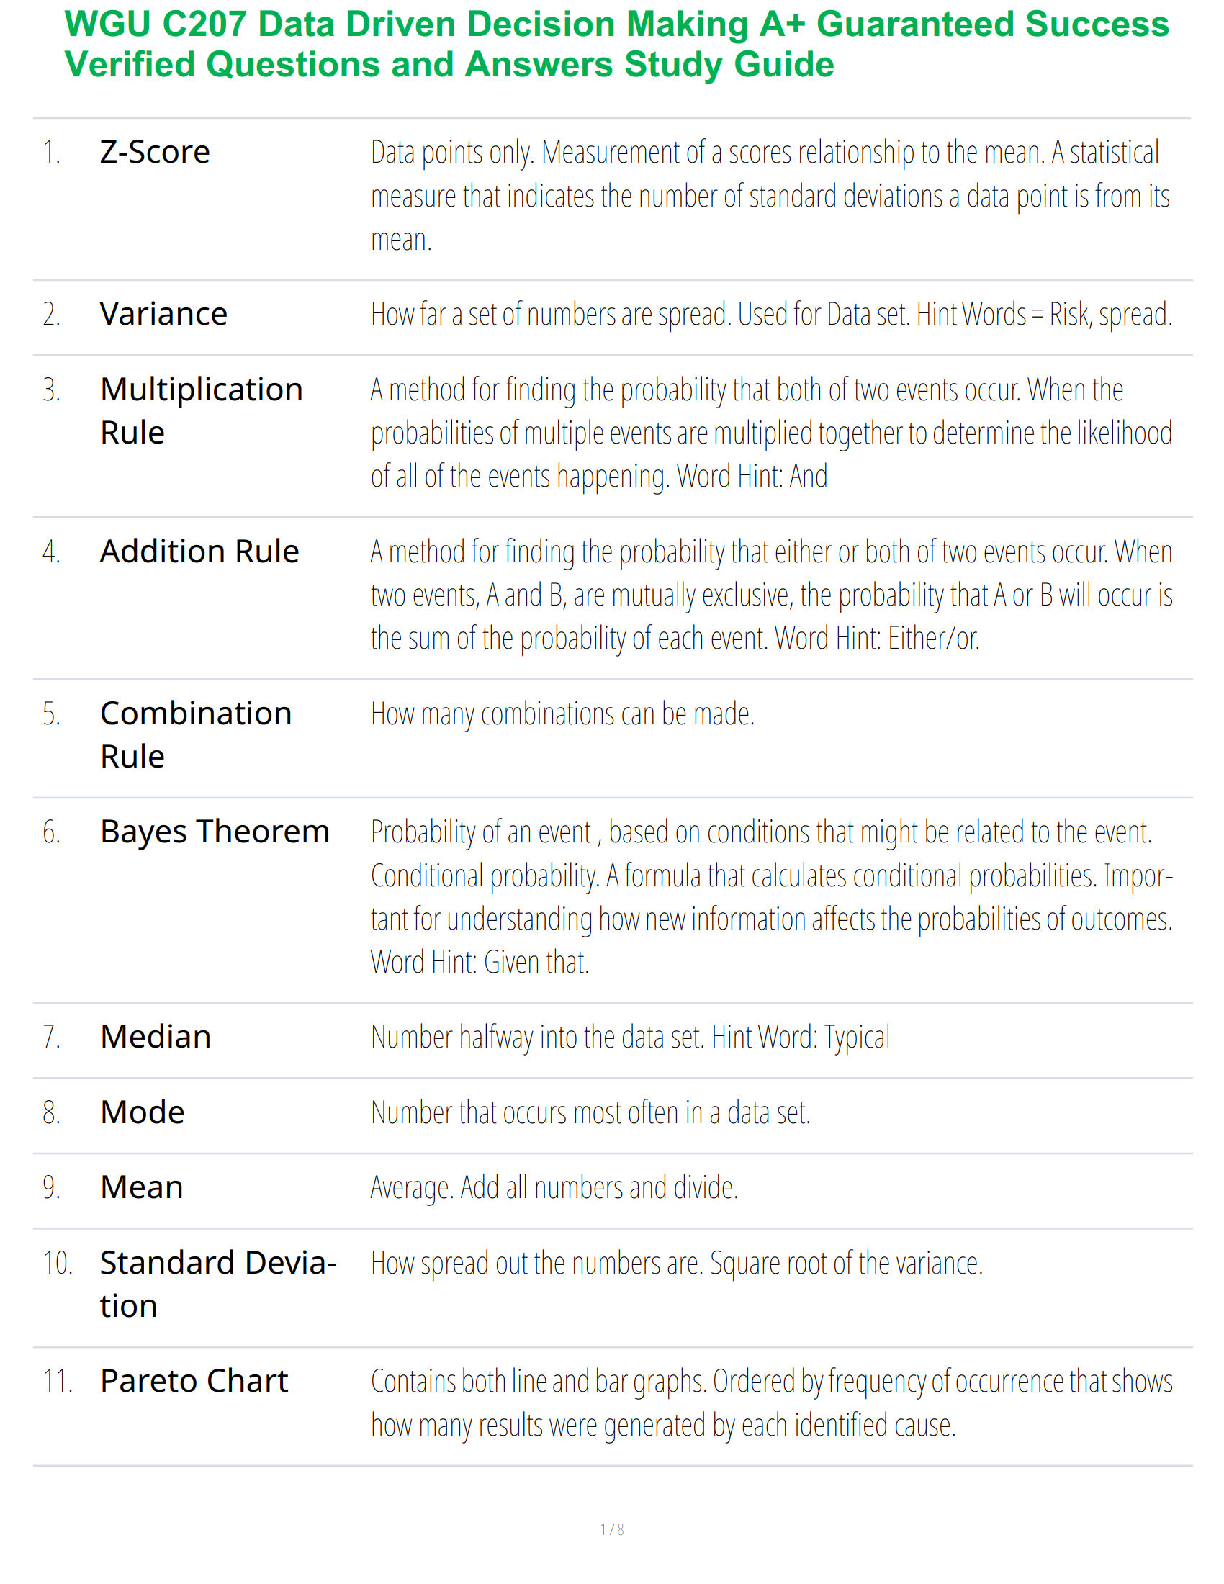
Z-Score ✔✔Data points only. Measurement of a scores relationship to the mean. A statistical
measure that indicates the number of standard deviations a data point is
...
WGU C207 Data Driven Decision Making
Already Passed
Z-Score ✔✔Data points only. Measurement of a scores relationship to the mean. A statistical
measure that indicates the number of standard deviations a data point is from its mean.
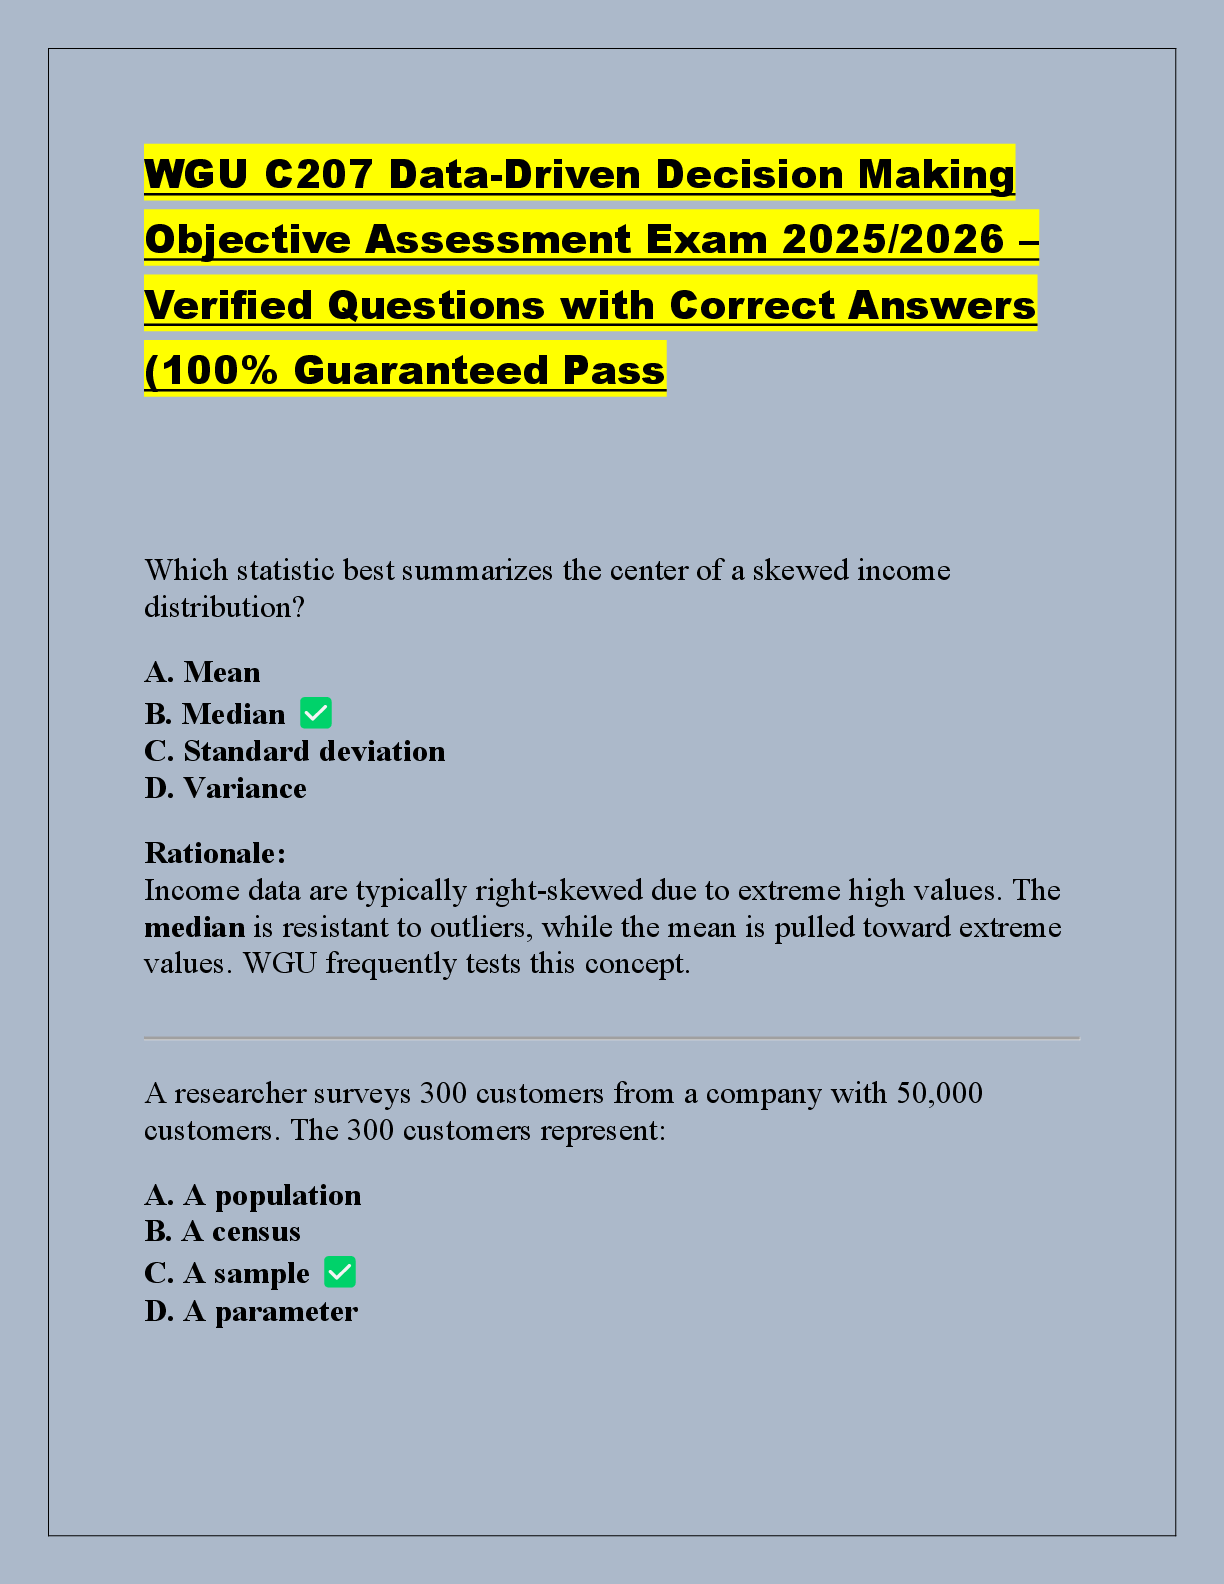
Variance ✔✔How far a set of numbers are spread. Used for Data set. Hint Words = Risk, spread.
Multiplication Rule ✔✔A method for finding the probability that both of two events occur.
When the probabilities of multiple events are multiplied together to determine the likelihood of
all of the events happening. Word Hint: And
Addition Rule ✔✔A method for finding the probability that either or both of two events occur.
When two events, A and B, are mutually exclusive, the probability that A or B will occur is the
sum of the probability of each event. Word Hint: Either/or.
Combination Rule ✔✔How many combinations can be made.
Bayes Theorem ✔✔Probability of an event , based on conditions that might be related to the
event. Conditional probability. A formula that calculates conditional probabilities. Important for
understanding how new information affects the probabilities of outcomes. Word Hint: Given
that.
Median ✔✔Number halfway into the data set. Hint Word: Typical
Mode ✔✔Number that occurs most often in a data set.
Mean ✔✔Average. Add all numbers and divide.
Standard Deviation ✔✔How spread out the numbers are. Square root of the variance.
Pareto Chart ✔✔Contains both line and bar graphs. Ordered by frequency of occurrence that
shows how many results were generated by each identified cause.
Cause and Effect Diagram ✔✔Shows the causes of a specific event.
Check Sheet ✔✔Collect data in real time.
Control Chart ✔✔Determines whether a process should undergo a formal exam for quality.
Histogram ✔✔Graph representing the distribution of numeric data. Measures how continuous
data is distributed over various ranges. Example: Displays how many people fall in various
ranges of height.
Scatter Diagram ✔✔A graphic that uses dots to show relationships or correlations between
variables
Flow/Run Chart ✔✔Shows the workflow process
Bar Chart ✔✔Graph of schedule-related info. Example: Measures how many people are from
each state.
Box - Plot ✔✔Used while studying the composition of a data set to examine the distribution (non
- parametric data) uses median and percentiles rather than averages. (Look for Spread and
Median.)
Dependent Variable ✔✔Dependent upon the Independent variable
Independent Variable ✔✔Variable the drives the dependent variable
Range ✔✔Difference between the lowest and highest number in a data set. Example: 4,6,9,3,7
Range = 9-3 =6
T-Statistic ✔✔Statistic (derived from a sample) used in hypothesis testing. Determines if 2
sample means are significantly different from each other.
Central Limit Theorem ✔✔Distribution of average of a large number of independent, identical,
variables will be approximately normal. OR the idea that if a large enough number of samples is
taken, the means of those samples will be normally distributed around the population mean.
F-Statistic ✔✔Value you get when you run an ANOVA test or a regression analysis to find out if
the means between two populations are significantly different.
ANOVA ✔✔(Analysis of Variance) - Collection of statistical models used to analyze the
differences among group means, (Three or more groups) Compares samples over different times.
Uses same software as regression, but takes multiple sets of data and tries to find the difference
between the groups. At least three groups of data and sees if there is any statistical value. Used to
determine if there is a significant difference among three or more means.
Linear Regression ✔✔Describes data and explains the relationship between one dependent
variable and one more independent variables. Predictive analysis. Linear relationship between
two variables can be measured by its strength
Strong Linear ✔✔Bunch around a straight line
Weak Linear ✔✔Scattered
Negative Linear ✔✔When one values decreases as the other increases
Positive ✔✔When both values increase together.
Correlation Coefficient ✔✔The strength of a linear relationship.
A number between -1 and 1
Close to 0 means a weak linear relationship
Closer to -1 or 1 means strong linear relationship
Equal to exactly -1 or 1 considered perfectly linear
Negative linear relationships have correlations less than 0
Strong linear relationships have correlations great than 0
Correlation ✔✔A and B may happen at the same time, but may not be related.
R - Squared ✔✔The term "R-squared" or "R2" provides a measure of "goodness of fit."
Chi - Squared ✔✔Assess the goodness of fit between observed values and those expected
theoretically. A chi-squared test is commonly used in statistics to draw inferences about a
population, by testing sample data. A chi-squared test is employed for categorical data.
Linear Programming ✔✔Used to achieve best outcomes such as maximum profit or lowest cost.
Give key points.
Cross over Analysis ✔✔Usually doesn't have revenue. Finds the intersection of two lines and
shows which option is cheapest.
Interval Data ✔✔(Integer) Data this is ordered within a range with each data point being an
equal interval apart. Example: Level of happiness, degrees in Fahrenheit.
Nominal Data ✔✔Called "Categorical Data" or "Qualitative Data", data type is used to label
subjects by order of name. Breaks results into categories, like days of the week, or states of the
United States of America.
Valid Data ✔✔Data from a test that accurately measures what it is intended to measure.
Reliable Data ✔✔Data that is consistent and repeatable.
Ration Data ✔✔Data that is ordered within a range with each data point being an equal interval
apart, also has a natural zero point which indicates none of the given quality. Example: Height,
Age.
Ordinal Data ✔✔Data that is set into some kind of order on a scale. Example: Athletes on the
podium during the Olympic games.
Continuous Data ✔✔Data that can lay along any point. Example: Height, Run Times
Discrete Data ✔✔Data that can only take on whole values and has clear boundaries. Example:
Number of students in a class room.
Inferential Statistics ✔✔Used to make predictions about a population from a sample.
IQR (Inter-quartile Range) ✔✔The difference in value between the bottom and the top 25% of
the sample.
Cumulative Distribution ✔✔The probability that a random variable will be found at a value less
than or equal to a given number.
Confidence Interval ✔✔An internal estimate used to indicate reliability.
Complement ✔✔The occurrence of an event not happening, the opposite.
Descriptive Statistics ✔✔Statistics that are used to describe a population from observations of
that whole population.
Standard Error of the Mean ✔✔An estimate of the distance between the sample mean and the
population mean.
Experience Curve ✔✔Shows the decline in cost per unit in various business functions of the
value chain as the amount of these activities increases.
Standard Error of the Mean ✔✔Average deviations of the data point from the regression line or
curve.
Multicollinearity ✔✔A multiple regression is flawed because two variables thought to be
independent are actually correlated to be independent.
Logistic Regression ✔✔Analysis that predicts the result of a binary, categorical dependent
variable.
Tree Diagram ✔✔Tool that uses steps to break a topic down into its components.
Regression Analysis ✔✔Used to predict future data values. A Statistical process for estimating
the relationships among variables. It includes many techniques for modeling and analyzing
several variables, when the focus is on the relationship between a dependent variable and one or
more independent variables.
Control Limits ✔✔Area composed of three standard deviations on either side of the center line.
Lean ✔✔A method for when a manager seeks to maximize customer value while minimizing
waste.
Network Diagram ✔✔Graphic representation of the schedule that shows the sequence of project
activities.
Process Decision Program Chart ✔✔A Tree Diagram designed to help uncover counter measures
or contingency plans so problems can be solved quickly or avoided.
SIPOC ✔✔Suppliers, Inputs, Processes, Outputs, and Customers
Variable Data ✔✔Data that shows how well a result meets a requirement, often shown on a scale
or as a rating.
Affinity Diagram ✔✔Tool that helps teams sort verbal data or ideas into categories for further
investigation or evaluation.
Data Mining ✔✔Process of discovering patterns in large data sets.
Consumer Price Index ✔✔A measure of the price level of a defined "Basket" of consumer items
purchased by households.
Simple Price Index ✔✔A measure that shows the relative change in a price or quantity of a
single good with respect to time.
Simple Composite Index ✔✔Created when a researcher gathers data from many different
sources without weighting any data more than the other.
Weighted Composite Index ✔✔Created when a researcher applies more weight to certain goods
or services.
Cost - Effective Analysis ✔✔A goal is determined and the cost of achieving said goal is
analyzed.
KPI - Key Performance Indicators ✔✔Key Performance Indicators - Dashboard featuring charts
and graphs.
Advantages:
Able to educate management
Can be used for the entire organization
Data - driven, quantifies performance
Can be used for benchmarking over time
Disadvantages:
Expensive and time consuming
Requires ongoing maintenance
Small changes may seem significant, but in reality may not have an impact
Provides only a rough guide
Difficult to change
Balanced Scorecard ✔✔Include in a company guide some objections that may not affect the
company's current financial performance but do affect the company's long term performance.
Advantages:
Improves organization alignment
Improves internal and external communication
Links company operations with its strategy
Emphasizes strategy and organizational results
Disadvantages:
Requires time and effort to establish a meaningful scorecard
Does not illustrate a full picture of the company performance, particularly financial data
Sometimes difficult to maintain momentum
Requires a wide cross-section of the organization departments in developing the system
May not encourage desired behavior changes
Decision Analysis or Decision Tree ✔✔Plots decisions that we can make and states of nature
(What we don't control, like market) Assigns probability based on research. What are the
outcomes of the decisions.
Cluster Analysis ✔✔Plot dots, look for nature groups.
Bell Curve - Normal Distribution. ✔✔A bell curve follows the 68-95-99.7 rule, which provides a
convenient way to carry out estimated calculations:
- Approximately 68% of all of the data lies within one standard deviation of the mean.
- Approximately 95% of all the data is within two standard deviations of the mean.
- Approximately 99.7% of the data is within three standard deviations of the mean.
[Show More]
.png)

.png)
.png)
.png)


![Preview of [SOLVED] EDCO 740 / EDCO740 Quiz 1 (LATES 2021/2022 Graded A)](https://scholarfriends.com/storage/EDCO_740_Quiz_1.png)
