Computer Science > EXAM > CS 412 Introduction To Data Mining - University of Illinois_Mining Take-Home Final (All)
CS 412 Introduction To Data Mining - University of Illinois_Mining Take-Home Final
Document Content and Description Below
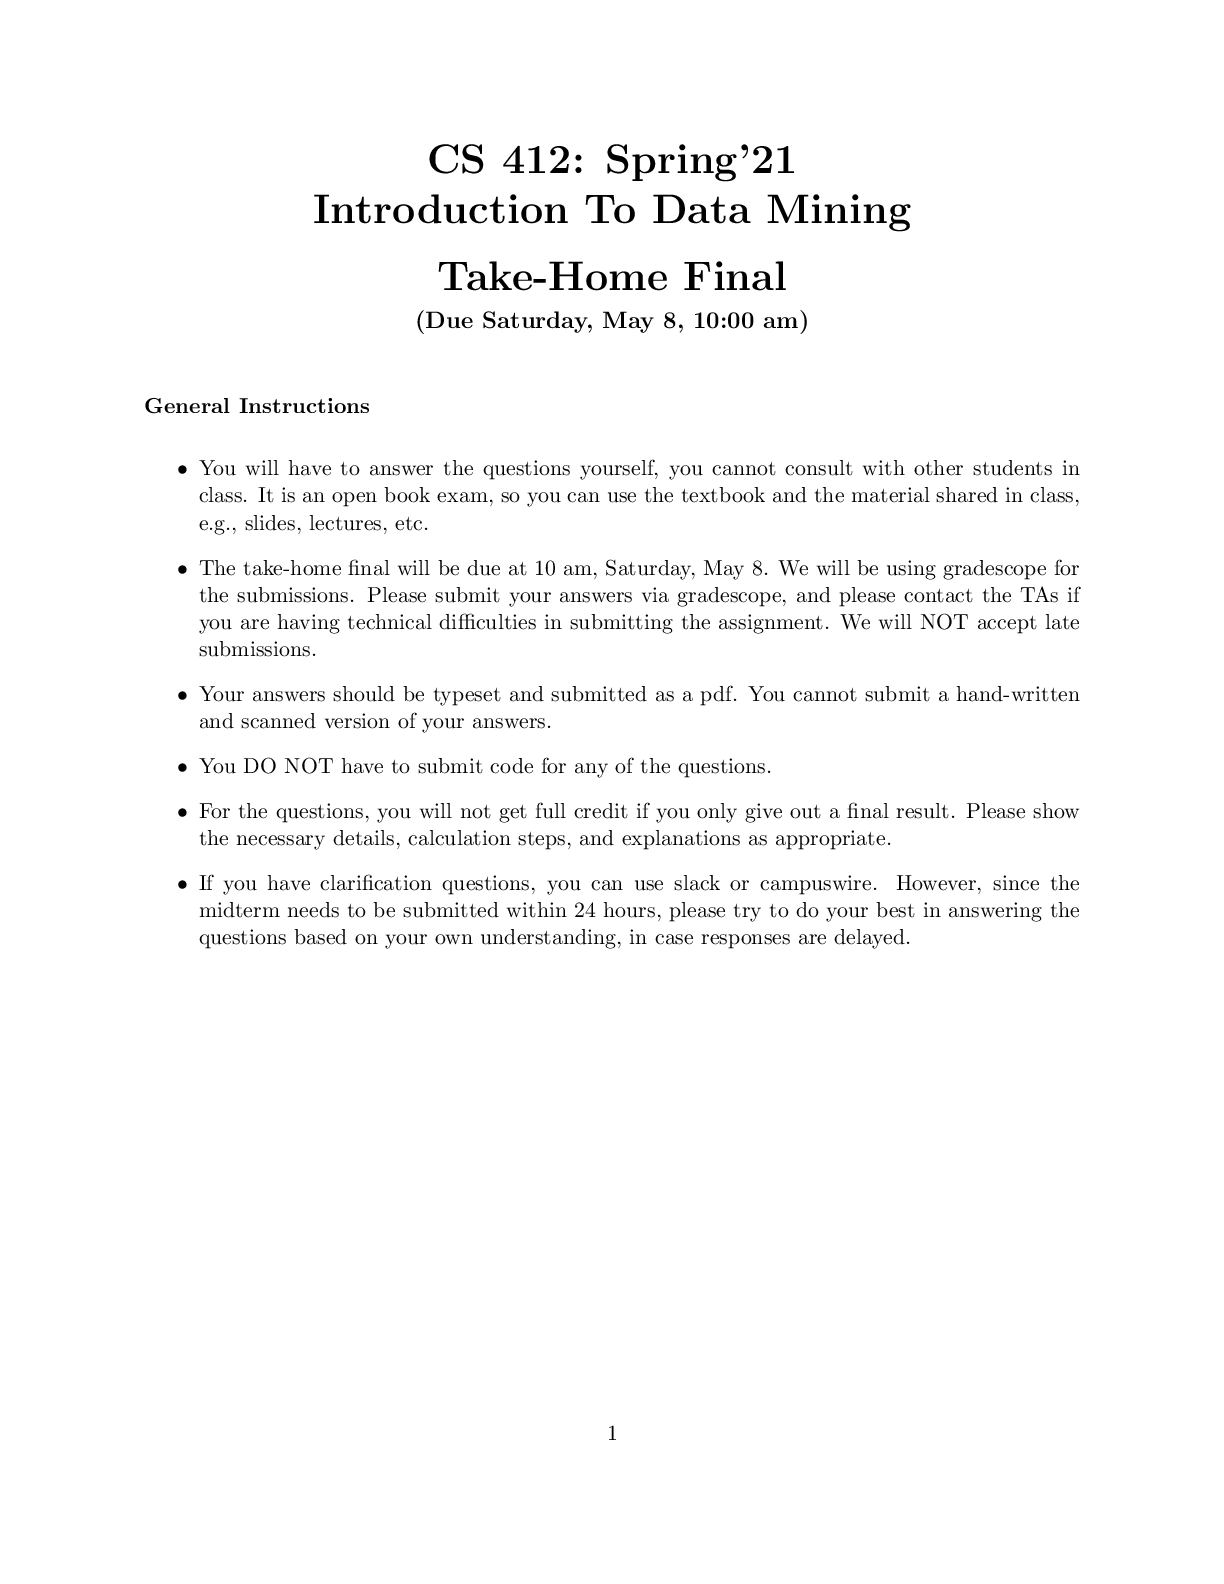
CS 412: Spring’21 Introduction To Data Mining Take-Home Final (Due Saturday, May 8, 10:00 am) General Instructions • You will have to answer the questions yourself, you cannot consult with oth... er students in class. It is an open book exam, so you can use the textbook and the material shared in class, e.g., slides, lectures, etc. • The take-home final will be due at 10 am, Saturday, May 8. We will be using gradescope for the submissions. Please submit your answers via gradescope, and please contact the TAs if you are having technical difficulties in submitting the assignment. We will NOT accept late submissions. • Your answers should be typeset and submitted as a pdf. You cannot submit a hand-written and scanned version of your answers. • You DO NOT have to submit code for any of the questions. • For the questions, you will not get full credit if you only give out a final result. Please show the necessary details, calculation steps, and explanations as appropriate. • If you have clarification questions, you can use slack or campuswire. However, since the midterm needs to be submitted within 24 hours, please try to do your best in answering the questions based on your own understanding, in case responses are delayed. 1 1. (25 points) Consider the following dataset for 2-class classification (Figure 1), where the blue points belong to one class and the orange points belong to another class. Each data point has two features x = (x1; x2). We will consider learning support vector machine (SVM) classifiers on the dataset. Figure 1: 2-class classification dataset. (a) (7 points) Can we train a hard margin linear SVM on the dataset? Clearly explain your answer. (b) (8 points) Can we train a soft margin linear SVM on the dataset? If yes, briefly describe how you will do it. If no, briefly explain why not. (c) (10 points) Professor Quadratic Kernel claims that mapping each feature vector xi = (xi 1; xi 2) to a 6-dimensional space given by φ(xi) = [1 xi 1 xi 2 xi 1xi 2 (xi 1)2 (xi 2)2]T and training a linear SVM in that mapped space would give a highly accurate predictor. Do you agree with Professor Kernel’s claim? Clearly explain your answer. 2. (25 points) We consider comparing the performance of two classification algorithms A1 and B1 based on k-fold cross-validation. The comparison will be based on a t-test to assess statistical significance with significance level α = 5%.1 (a) (5 points) We will assess the results for k = 10-fold cross-validation. What should be the degrees of freedom for the test? Briefly explain your answer. (b) (10 points) The accuracies for k = 10-fold cross-validation from algorithms A1 and B1 are given in Table 1. Is the performance of one of the algorithms significantly different than the other based a t-test at significance level α = 5%? Clearly explain your answer by showing details of (a) the computation of the t-statistic, and (b) the computation of the p-value. 1The relevant material for testing statistical significance is discussed in Chapter 7 of the text book. We will assume that the conditions needed for the validity of the test are satisfied. 2 1 2 3 4 5 6 7 8 9 10 A1 B1 0.908 0.449 0.962 0.585 0.878 0.381 0.956 0.433 0.939 0.475 0.955 0.430 0.944 0.520 0.933 0.590 0.881 0.565 0.9490.443 Table 1: Accuracies on 10-folds for Algorithms A1 and B1. Given the t-statistic t stat and degrees of freedom df, you should be able to compute the p-value using the following:2 from scipy.stats import t p val = (1-t.cdf(abs(t stat), df)) * 2 (c) (10 points) Suppose we have a better version of algorithm B1 called B2. The accuracies for k = 10-fold cross-validation from algorithms A1 and B2 are given in Table 2. 1 2 3 4 5 6 7 8 9 10 A1 B2 0.908 0.968 0.962 1.000 0.878 0.950 0.956 0.994 0.939 0.989 0.955 0.989 0.944 1.000 0.933 0.994 0.881 0.966 0.9490.966 Table 2: Accuracies on 10-folds for Algorithms A1 and B2. Is one of the algorithms significantly better than the other based a t-test at significance level α = 5%? Clearly explain your answer by showing details of (a) computation of the t-statistic, and (b) computation of the p-value. 3. (25 points) Let Z = f(x1; y1); : : : ; (xn; yn)g; xi 2 Rd; yi 2 f0; 1g; i = 1; : : : ; n be a set of n training samples. The input xi; i = 1; : : : ; n are d-dimensional features, and xi j denotes the j-th feature of the i-th data point xi. The output yi 2 f0; 1g; i = 1; : : : ; n; are the class labels. We consider training a single layer perceptron where for any input xi, the output is given by y^i = g(ai) = g(wT xi) = g 0 @Xj=1 d wjxi j1 A ; where g(a) = max(a; 0), i.e., the ReLU transfer function, and ai = wT xi is the input activation. Note that the parameters w = [w1 · · · wd]T are the unknown parameters of the model. Consider a learning algorithm which focuses on minimizing squared loss between the true and predicted outputs: L(wjZ) = 1 2 nX i =1 (yi - y^i)2 = 1 2 nX i =1 (yi - g(wT xi))2 : 2Alternatively, you can look a table for p-values for t-statistic, similar to how you had done it for the χ2-statistic earlier in the semester. [Show More]
Last updated: 2 years ago
Preview 1 out of 4 pages

Buy this document to get the full access instantly
Instant Download Access after purchase
Buy NowInstant download
We Accept:

Reviews( 0 )
$7.50
Can't find what you want? Try our AI powered Search
Document information
Connected school, study & course
About the document
Uploaded On
Apr 02, 2023
Number of pages
4
Written in
Additional information
This document has been written for:
Uploaded
Apr 02, 2023
Downloads
0
Views
108


.png)


.png)


