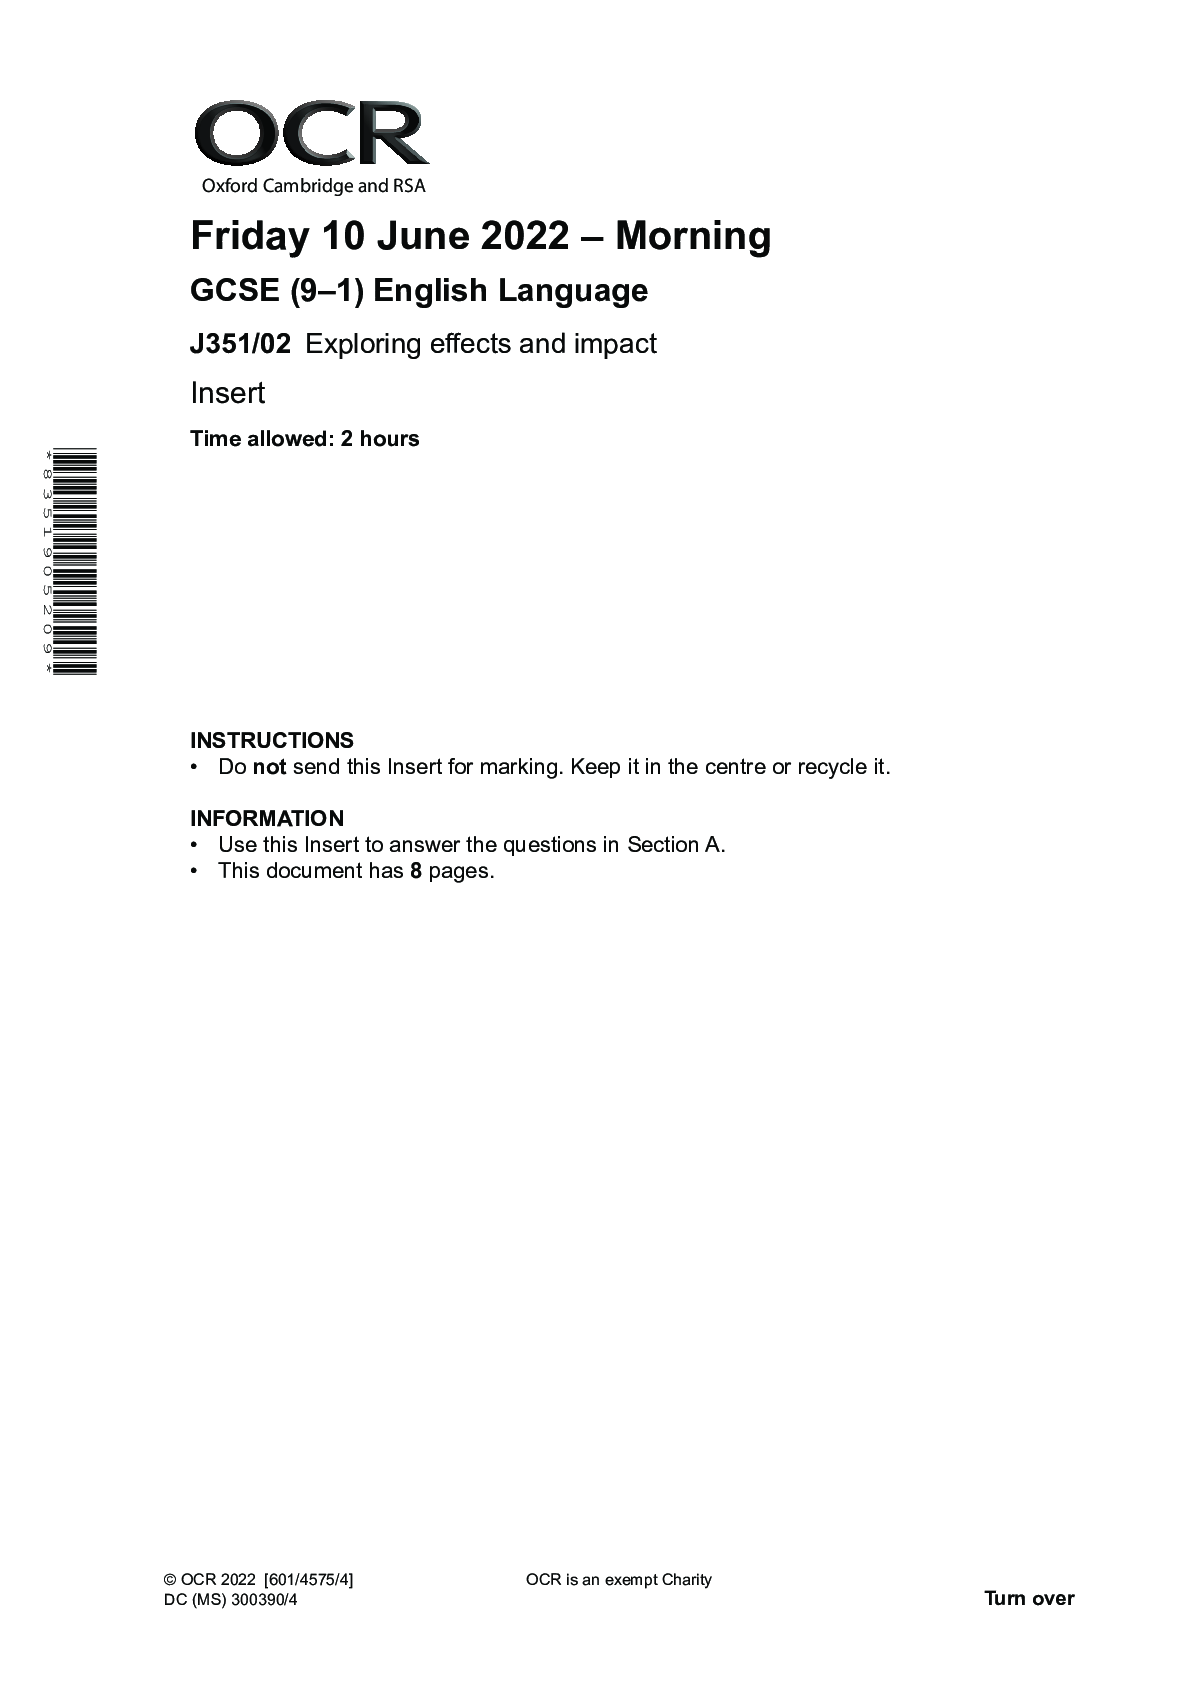
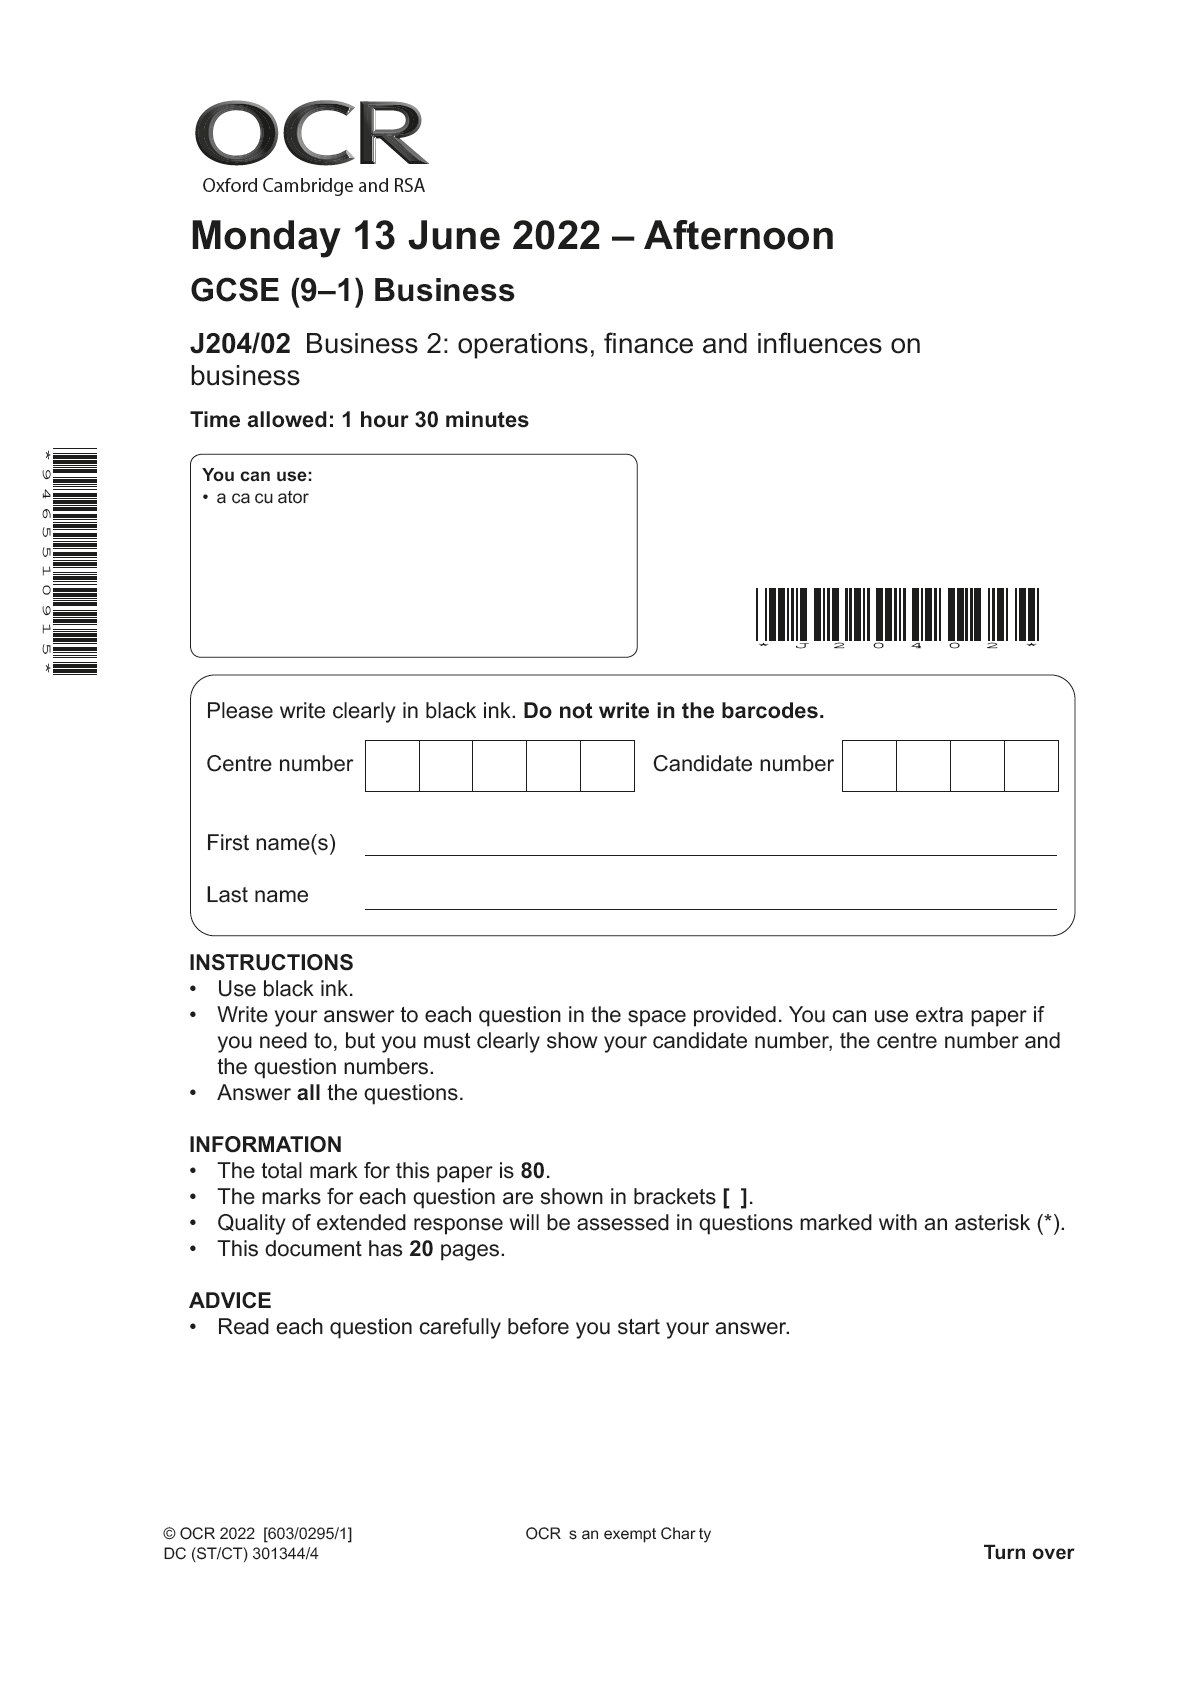
Combined Science: Synergy > QUESTION PAPER (QP) > OCR Oxford Cambridge and RSA Thursday 9 June 2022 — Afternoon GCSE (9—1) in Combined Science B ( (All)
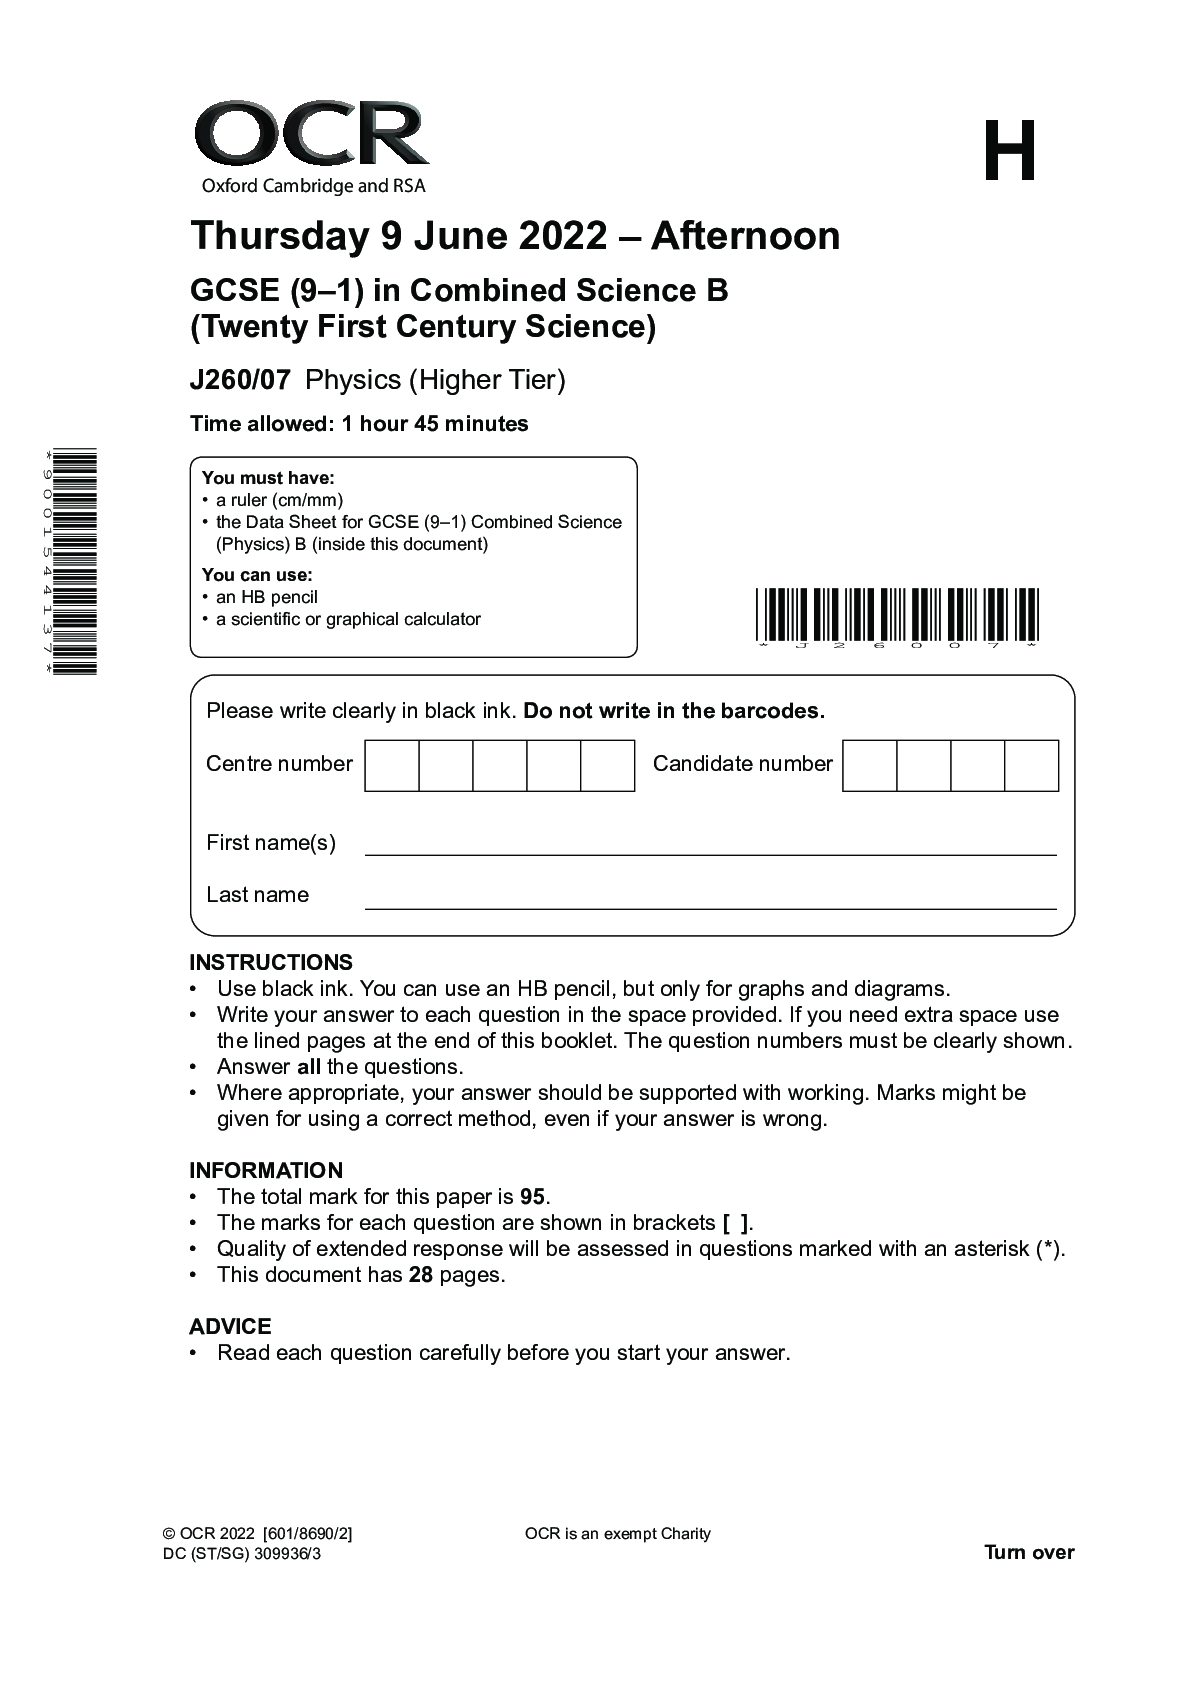
OCR Oxford Cambridge and RSA Thursday 9 June 2022 — Afternoon GCSE (9—1) in Combined Science B (Twenty First Century Science) J260/07 Physics (Higher Tier)
Document Content and Description Below
INSTRUCTIONS • Use black ink. You can use an HB pencil, but only for graphs and diagrams. • Write your answer to each question in the space provided. If you need extra space use the lined page... s at the end of this booklet. The question numbers must be clearly shown. • Answer all the questions. • Where appropriate, your answer should be supported with working. Marks might be given for using a correct method, even if your answer is wrong. INFORMATION • The total mark for this paper is 95. • The marks for each question are shown in brackets [ ]. • Quality of extended response will be assessed in questions marked with an asterisk (*). • This document has 28 pages. ADVICE • Read each question carefully before you start your answer. *9001544137* © OCR 2022 [601/8690/2] DC (ST/SG) 309936/3 2 © OCR 2022 Answer all the questions. 1 (a) Which of these statements about the domestic electricity supply in the UK is true? Tick (3) one box. The domestic electricity supply in the UK is d.c. The energy transferred = current × potential difference. The frequency of the supply is 230Hz. Transmitting power at higher voltages is more efficient. [1] (b) Sundip installs panels made of material with low thermal conductivity to the walls of a house. Describe how this will help to keep the house warm when it is cold outside. ................................................................................................................................................... .............................................................................................................................................. [1] (c) Sundip buys electricity from a company that uses energy from renewable energy resources. What is the difference between a renewable and non-renewable energy resource? ................................................................................................................................................... .............................................................................................................................................. [1] 3 © OCR 2022 Turn over (d)* The graph shows how some energy resources were used to generate electricity in the UK over 20 years. 0 50 100 150 200 250 300 350 400 450 1998 2002 2008 Year 2012 2018 Energy used for generating electricity (TWh) Coal Natural gas Wind & solar Explain how the use of these three energy resources changed between 1998 and 2018. ................................................................................................................................................... ................................................................................................................................................... ................................................................................................................................................... ................................................................................................................................................... ................................................................................................................................................... ................................................................................................................................................... ................................................................................................................................................... ................................................................................................................................................... ................................................................................................................................................... ................................................................................................................................................... ................................................................................................................................................... .............................................................................................................................................. [6] 4 © OCR 2022 BLANK PAGE PLEASE DO NOT WRITE ON THIS PAGE 5 © OCR 2022 Turn over 2 Alex is investigating the refraction of light in a rectangular glass block, using the equipment shown in the diagram. Ray box Glass block (a) This is Alex’s method. The sentences are not in the correct order. A. Repeat the experiment for different angles of incidence. B. Shine a ray of light into the block. C. Place the glass block on some paper. D. Measure the angle of incidence and angle of refraction. E. Mark the path of the rays on the paper with a pencil. F. Draw a line to show the path of the ray inside the glass block. G. Remove the glass block and ray box. Write the letters in the boxes to show the correct order of the method. The first one has been done for you. C [3] (b) Suggest two ways in which Alex could improve his method to get more accurate measurements of the angles. 1 ................................................................................................................................................ ................................................................................................................................................... 2 ................................................................................................................................................ ................................................................................................................................................... [2] 6 © OCR 2022 (c) Alex records his results in the table. Angle of incidence (°) Angle of refraction (°) 20 13 30 19 40 25 50 41 60 35 70 39 (i) Plot the results from the table on the graph. One point has already been plotted. [2] (ii) Put a ring around the outlier on the graph. [1] (iii) Draw a line of best fit. [1] 10 10 15 20 25 30 35 40 45 20 30 40 50 Angle of incidence (°) 60 70 Angle of refraction (°) 7 © OCR 2022 Turn over (iv) Describe the relationship between the angle of incidence and the angle of refraction for the rectangular glass block in Alex’s investigation. ........................................................................................................................................... ...................................................................................................................................... [1] 8 © OCR 2022 3 Waves can form on the surface of water. Fig. 3.1 is a diagram of a water wave on the surface of water. X Y Fig. 3.1 (a) Which two statements about the water wave are correct? Tick (3) two boxes. The amplitude of the wave is X. The wavelength of the wave is Y. The wave travels but the water does not. The water wave is a longitudinal wave. Water waves always travel at the same speed. [2] 9 © OCR 2022 Turn over (b) Mia is looking at a fish in a pond. The light waves from the fish are refracted as shown in Fig. 3.2. Fish Air Water Fig. 3.2 Explain why the light waves from the fish are refracted as they pass from water to air. ................................................................................................................................................... ................................................................................................................................................... ................................................................................................................................................... .............................................................................................................................................. [2] 10 © OCR 2022 4 A resistor X is connected to the terminals of a 12V battery. The energy transferred from the battery to the resistor is 1.2J per second. (a) What is the power transferred to the resistor? Use the Data Sheet. Explain your answer. Power = .................................... W Explanation ............................................................................................................................... ................................................................................................................................................... .............................................................................................................................................. [2] (b) Ali wants to determine the resistance of resistor X. X Fig. 4.1 Complete the circuit diagram in Fig. 4.1 to allow Ali to determine the resistance of resistor X. [2] 11 © OCR 2022 Turn over (c) Fig. 4.2 shows a second resistor Y connected in parallel with resistor X. The total current in this circuit is 1.0 A and the current through resistor X is 0.1 A. X Y Current in X = 0.1A Total current = 1.0A Fig. 4.2 (i) Explain why the resistance of Y is smaller than the resistance of X. ........................................................................................................................................... ........................................................................................................................................... ........................................................................................................................................... ........................................................................................................................................... ........................................................................................................................................... ...................................................................................................................................... [3] (ii) The potential difference across Y is 12V. Calculate the resistance of Y. Use the equation: potential difference = current × resistance Give your answer to 2 significant figures. State the unit. Resistance = ........................ Unit = ...................... [5] 12 © OCR 2022 Ali wants to measure the total current in the circuit, but his ammeter can only measure up to 0.2A. He connects the ammeter in the circuit as shown in Fig. 4.3. A X Y Fig. 4.3 (d) Fig. 4.4 shows a graph of the current through resistor X for different values of the total current in the circuit. 0 0.02 0.04 0.06 0.08 0.10 0.12 0.14 0.16 0.18 0.20 0.2 0.6 1.0 Total current (A) 0.4 0.8 1.2 1.4 1.6 1.8 2.0 Current through resistor X (A) Fig. 4.4 How does the graph show that Ali can determine higher total currents up to 2.0A in the circuit in Fig. 4.3? ................................................................................................................................................... ................................................................................................................................................... .............................................................................................................................................. [1] 13 © OCR 2022 Turn over 5 Kai watches as a metal bar is heated up. After some heating it starts to glow red. After more heating it appears orange and finally yellow. Kai tries to explain what happens. Cold objects do not emit radiation. When the bar has been heated for a long enough time it starts to emit red light. The longer it is heated the more colour changes happen. It stops emitting red wavelengths and gives out orange wavelengths. Finally, it changes to emit yellow wavelengths. Kai Explain what is wrong with Kai’s explanation. .......................................................................................................................................................... .......................................................................................................................................................... .......................................................................................................................................................... ..................................................................................................................................................... [2] 14 © OCR 2022 6 In 2019 the wall of the dam at the Toddbrook water reservoir was damaged. The wall of the dam was strengthened using large bags of rock. The image shows a helicopter carrying a large bag of rock. (a) Draw a free body force diagram for the bag of rock when the helicopter is stationary in the air above the dam. [3] 15 © OCR 2022 Turn over (b) The height of the water in the reservoir was reduced by removing 966000m3 of water. (i) Calculate the weight of this volume of water. Use the equation: density = mass ÷ volume Density of water = 1000kg/m3 Gravitational field strength = 10N/k [Show More]
Last updated: 2 years ago
Preview 1 out of 28 pages
Buy this document to get the full access instantly
Instant Download Access after purchase
Buy NowInstant download
We Accept:

Reviews( 0 )
$8.00
Can't find what you want? Try our AI powered Search
Document information
Connected school, study & course
About the document
Uploaded On
Apr 03, 2023
Number of pages
28
Written in
Additional information
This document has been written for:
Uploaded
Apr 03, 2023
Downloads
0
Views
112

