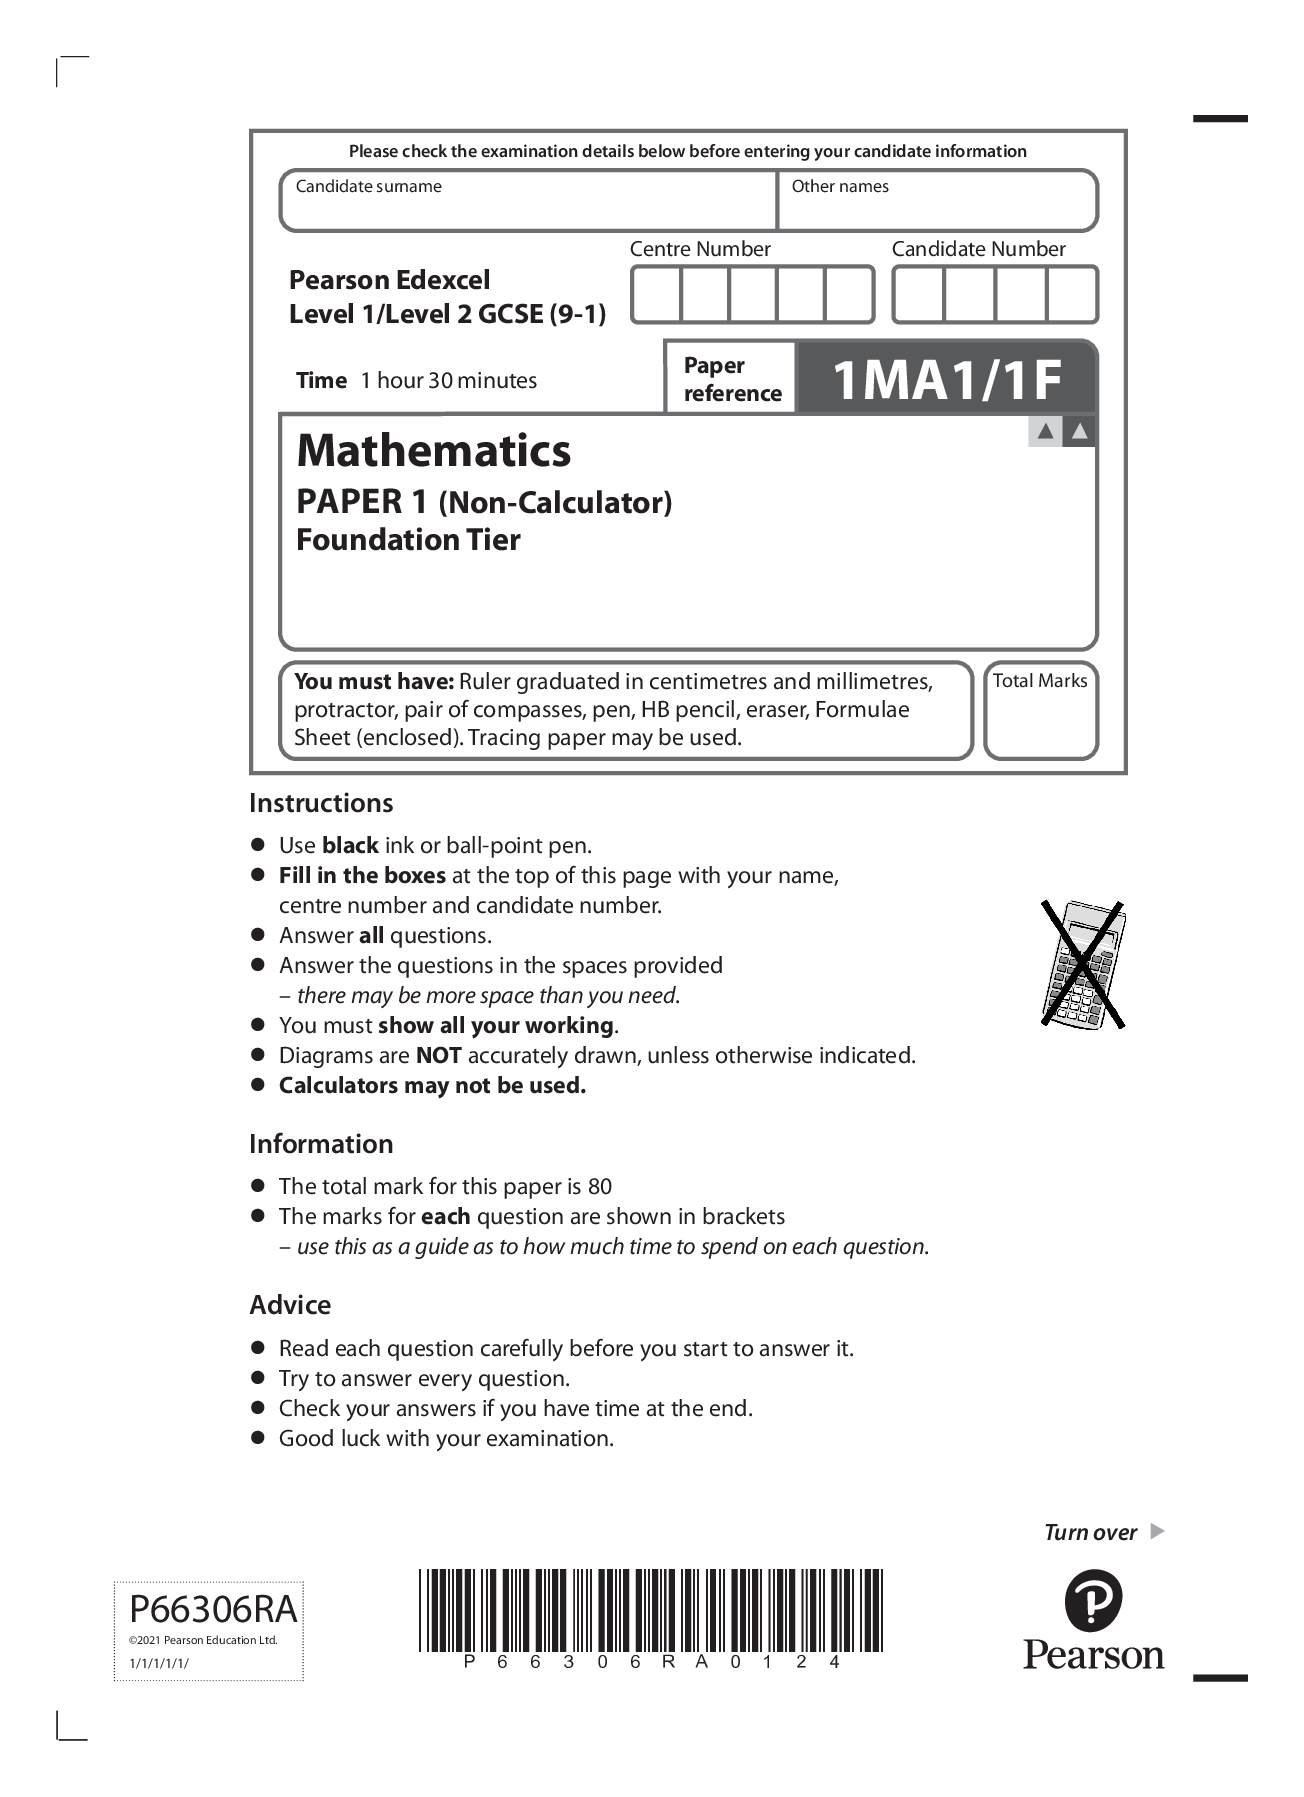
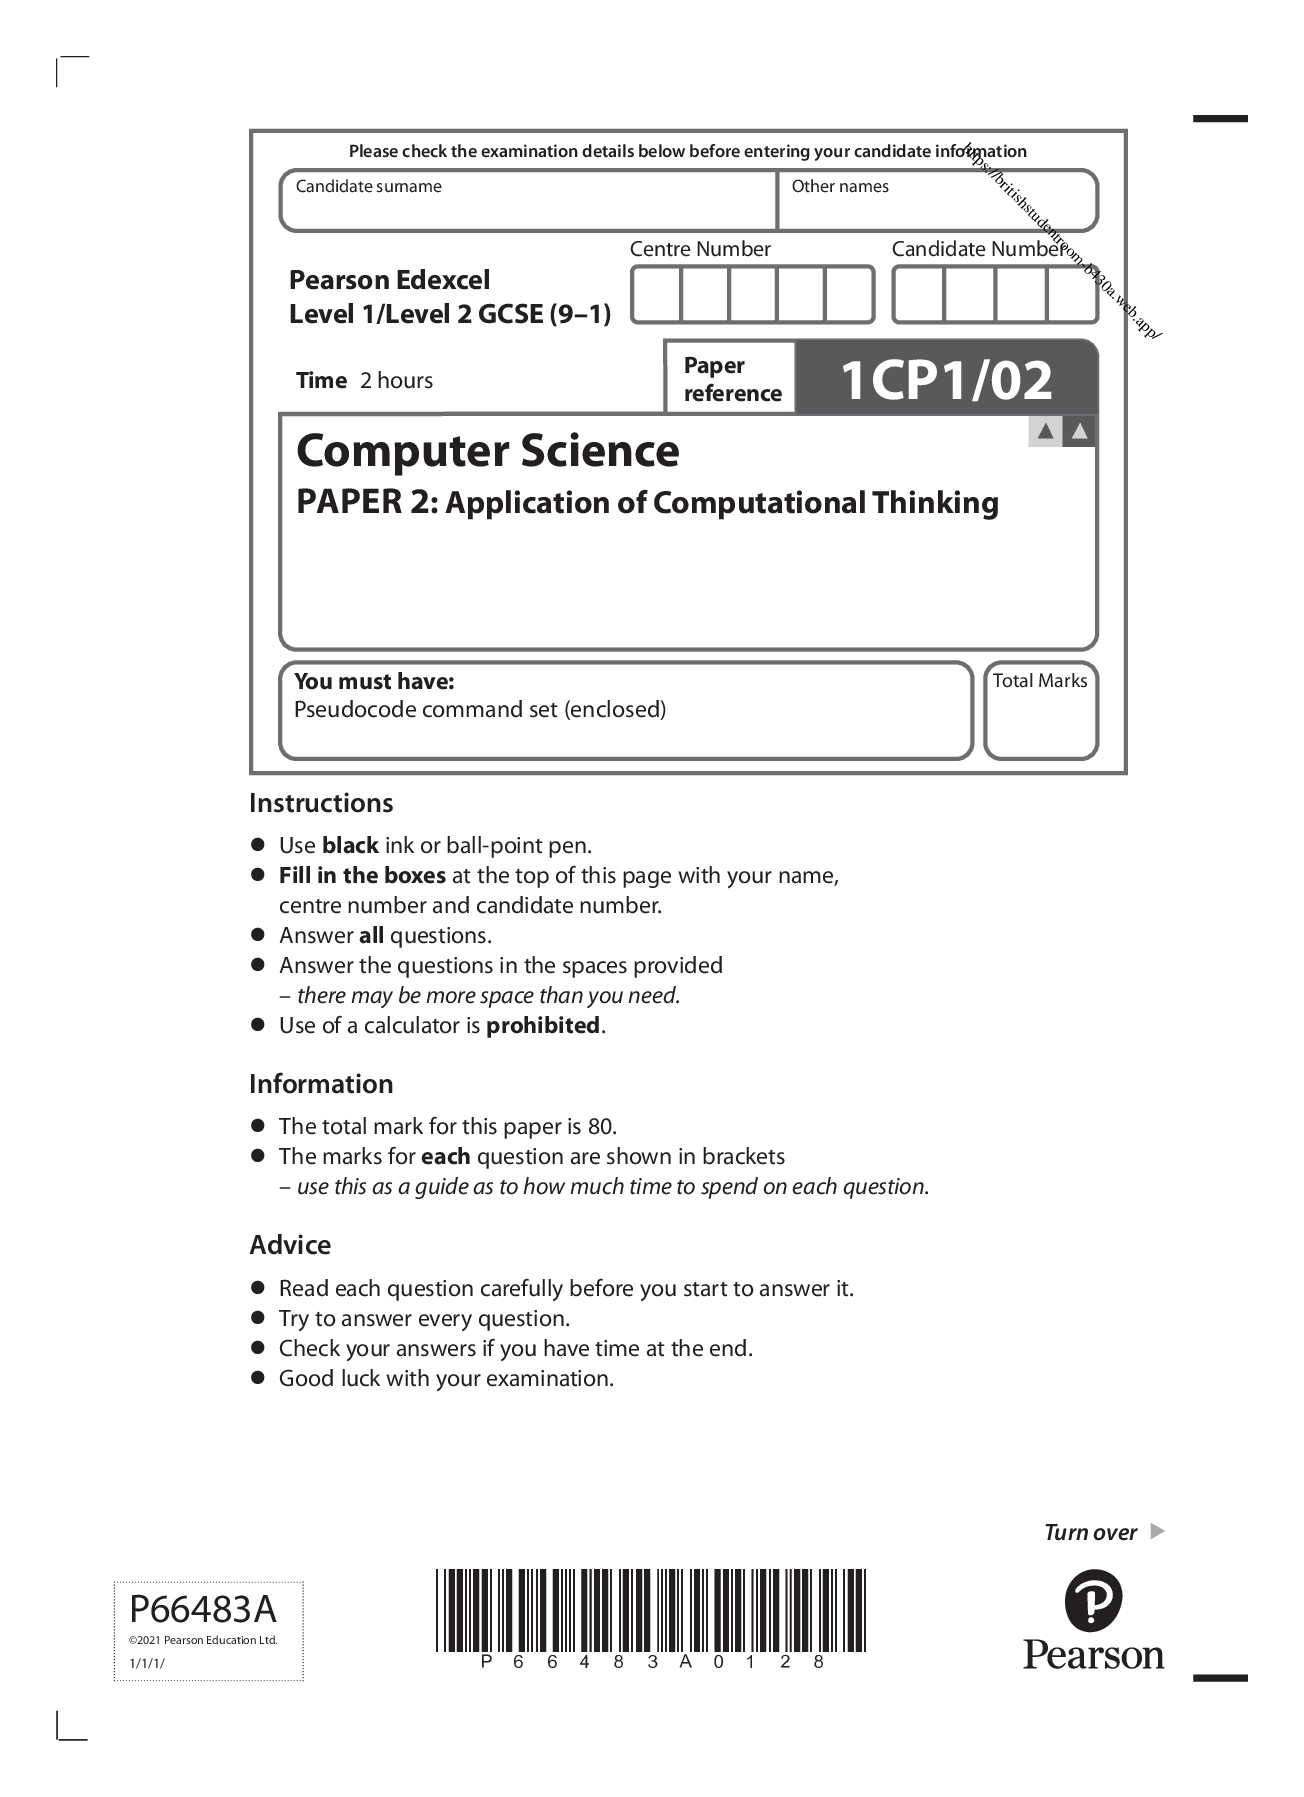
Combined Science: Synergy > QUESTION PAPER (QP) > Pearson Edexcel Level 1/Level 2 GCSE (9-1 ) Time 1 hour 10 minutes Paper 1 sco/l PH reference Combin (All)
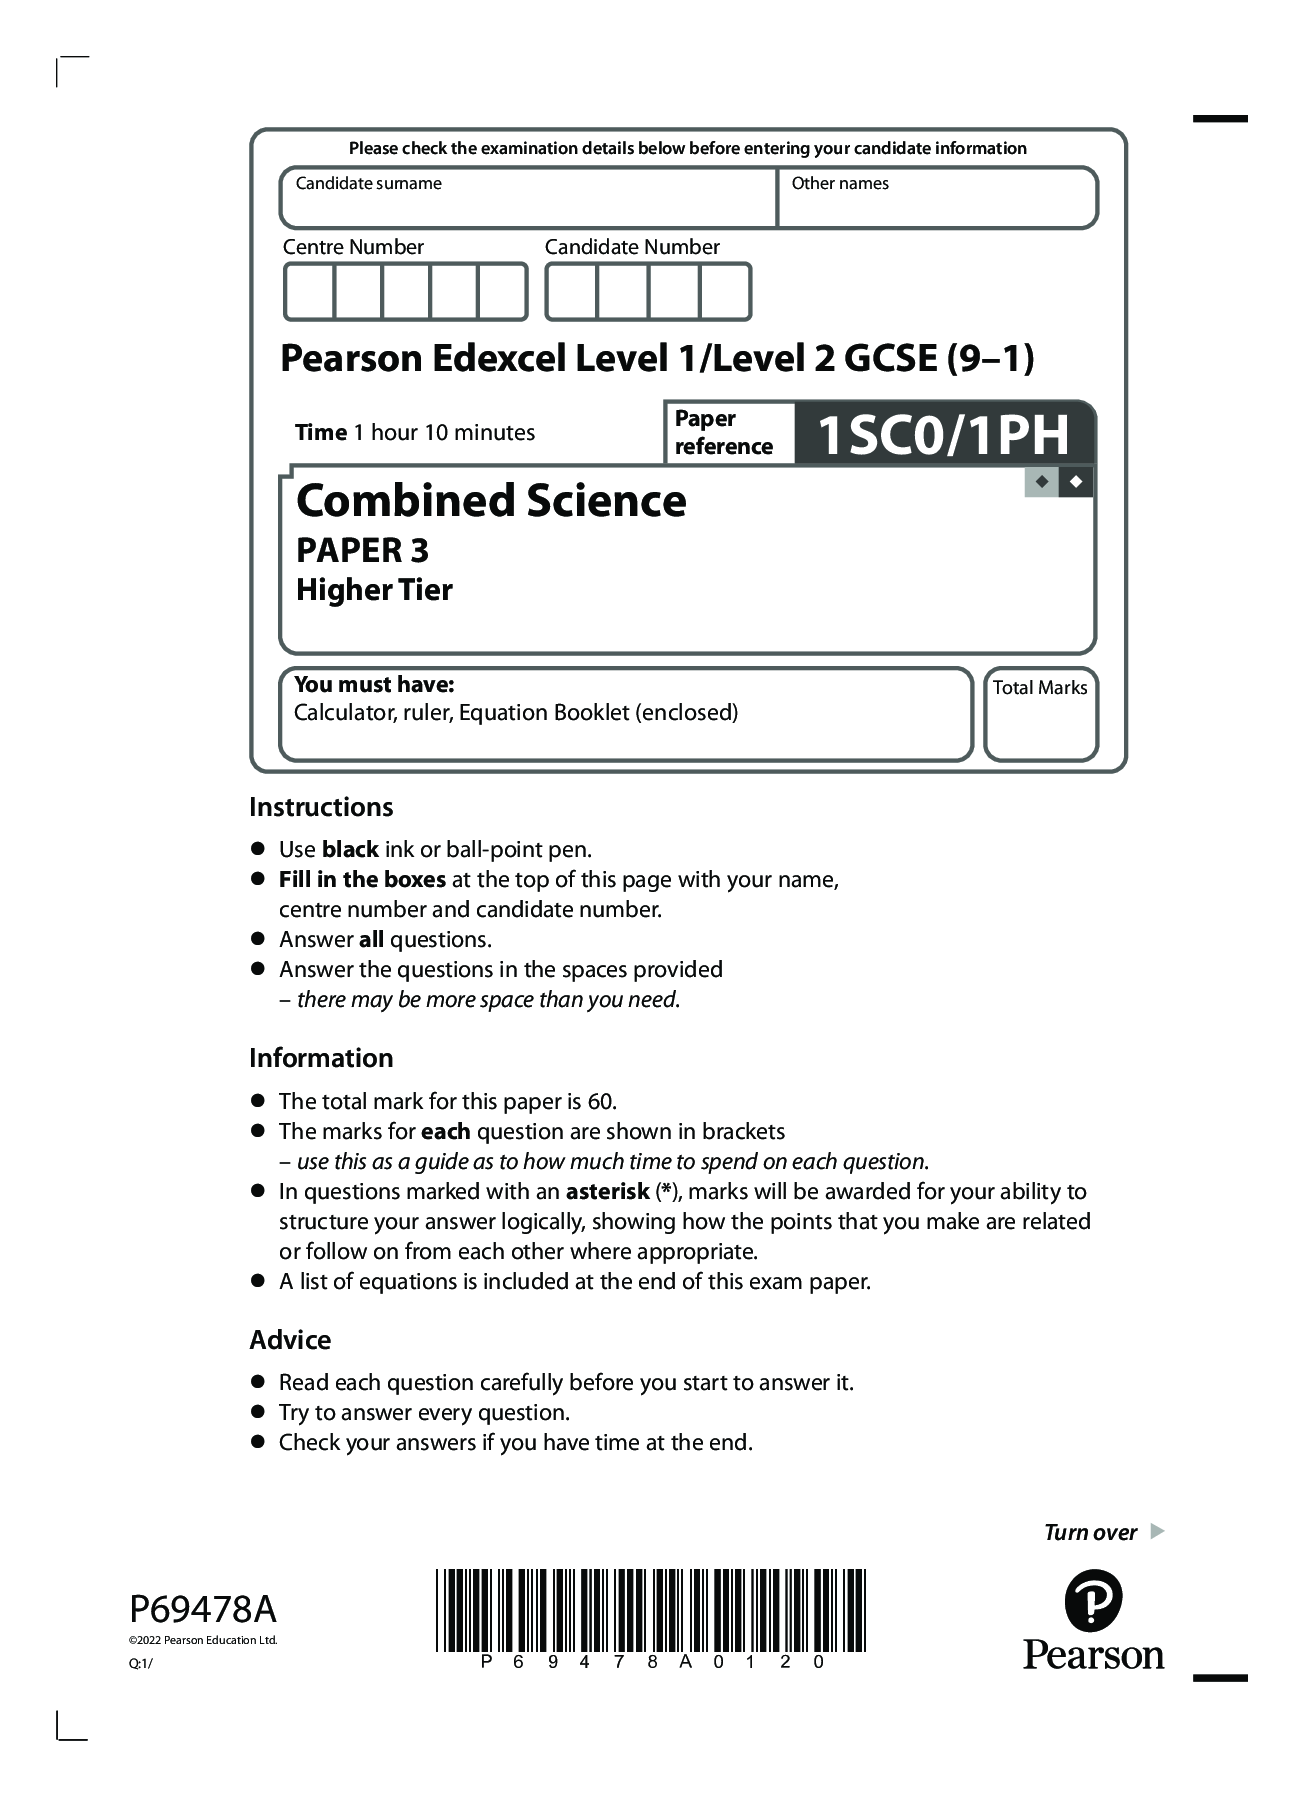
Pearson Edexcel Level 1/Level 2 GCSE (9-1 ) Time 1 hour 10 minutes Paper 1 sco/l PH reference Combined Science PAPER 3 Higher Tier
Document Content and Description Below
Instructions • Use black ink or ball‑point pen. • Fill in the boxes at the top of this page with your name, centre number and candidate number. • Answer all questions. • Answer the que... stions in the spaces provided – there may be more space than you need. Information • The total mark for this paper is 60. • The marks for each question are shown in brackets – use this as a guide as to how much time to spend on each question. • In questions marked with an asterisk (*), marks will be awarded for your ability to structure your answer logically, showing how the points that you make are related or follow on from each other where appropriate. • A list of equations is included at the end of this exam paper. Advice • Read each question carefully before you start to answer it. • Try to answer every question. • Check your answers if you have time at the end. You must have: Calculator, ruler, Equation Booklet (enclosed) Combined Science PAPER 3 Higher Tier Time 1 hour 10 minutes 1SC0/1PH Pearson Edexcel Level 1/Level 2 GCSE (9–1) P69478A ©2022 Pearson Education Ltd. Q:1/ *P69478A0220* 2 Answer ALL questions. Write your answers in the spaces provided. Some questions must be answered with a cross in a box . If you change your mind about an answer, put a line through the box and then mark your new answer with a cross . 1 (a) Which statement describes conservation of energy in a closed system? (1) A when there are energy transfers, the total energy reduces B when there are energy transfers, the total energy does not change C when there are no energy transfers, the total energy reduces D when there are no energy transfers, the total energy increases (b) A student uses the apparatus in Figure 1 to find out which of two materials, sand or sawdust, is the better insulator. small copper can large copper can sand sawdust Figure 1 The student also has a kettle to boil water, a thermometer and a stop clock. (i) Draw a labelled diagram to show how the student should set up the equipment to investigate which material is the better insulator. (3) *P69478A0320* Turn over 3 (ii) Give three factors that the student must control in this investigation. (3) 1................................................................................................................................................................................................................................................................................ .................................................................................................................................................................................................................................................................................... 2................................................................................................................................................................................................................................................................................ .................................................................................................................................................................................................................................................................................... 3................................................................................................................................................................................................................................................................................ .................................................................................................................................................................................................................................................................................... (c) Expanded polystyrene, used to insulate buildings, has different densities. Figure 2 shows how the thermal conductivity of expanded polystyrene changes with the density of expanded polystyrene. 45 40 35 30 thermal conductivity of expanded polystyrene in mW/m.K 10 15 20 25 30 35 40 density of expanded polystyrene in kg/m3 Figure 2 Using the graph in Figure 2, describe how the thermal conductivity of expanded polystyrene changes with the density of expanded polystyrene. (2) .................................................................................................................................................................................................................................................................................... .................................................................................................................................................................................................................................................................................... .................................................................................................................................................................................................................................................................................... .................................................................................................................................................................................................................................................................................... (Total for Question 1 = 9 marks) *P69478A0420* 4 2 (a) Figure 3 is a speed limit sign from a European motorway. The speeds shown are in km/h (kilometres per hour). 130 110 Figure 3 (i) The sign tells drivers to drive at a slower speed in wet weather. Explain why it is safer for drivers to drive at a slower speed in wet weather. (2) .................................................................................................................................................................................................................................................................................... .................................................................................................................................................................................................................................................................................... .................................................................................................................................................................................................................................................................................... .................................................................................................................................................................................................................................................................................... (ii) Show that a speed of 31m/s is less than a speed of 130 km/h. (2) *P69478A0520* Turn over 5 (iii) The driver’s reaction time is the time between the driver seeing an emergency and starting to brake. A car is travelling at a speed of 31m/s. The car travels 46m between the driver seeing an emergency and starting to brake. Calculate the driver’s reaction time. Give your answer to 2 significant figures. (3) driver’s reaction time .............................................................. s (Total for Question 2 = 7 marks) *P69478A0620* 6 3 (a) (i) An aircraft starts from rest and accelerates along the runway for 36s to reach take‑off velocity. Take‑off velocity for this aircraft is 82m/s. Show that the acceleration of the aircraft along the runway is about 2m/s2 . Assume the acceleration is constant. (2) (ii) Calculate the distance the aircraft travels along the runway before take‑off. Use the equation v2 – u2 = 2ax (3) distance = .............................................................. m *P69478A0720* Turn over 7 (iii) Suggest one reason why the length of the runway used is always much longer than the calculated distance that the aircraft travels along the runway before take-off. (1) .................................................................................................................................................................................................................................................................................... .................................................................................................................................................................................................................................................................................... (b) (i) The aircraft lands with a velocity of 71m/s. The mass of the aircraft is 3.6×10⁵ kg. Calculate the kinetic energy of the aircraft as it lands. (2) kinetic energy of aircraft = ..............................................................J (ii) When the aircraft has come to a stop, all the kinetic energy has been transferred to the surroundings. Give one way that the energy has been transferred to the surroundings. (1) .................................................................................................................................................................................................................................................................................... .................................................................................................................................................................................................................................................................................... (Total for Question 3 = 9 marks) *P69478A0820* 8 BLANK PAGE *P69478A0920* Turn over 9 4 (a) Which of these is a unit of momentum? (1) A kgm/s B kg/m/s C kgm/s2 D kg/m/s2 (b) Students investigate conservation of momentum using two identical trolleys. A card is then added to trolley A. Some of the apparatus is set up as shown in Figure 4. trolley A sticky pads runway trolley B books card Figure 4 (i) Describe an investigation the students could carry out to show that momentum is conserved when these two trolle [Show More]
Last updated: 2 years ago
Preview 1 out of 20 pages
Buy this document to get the full access instantly
Instant Download Access after purchase
Buy NowInstant download
We Accept:

Reviews( 0 )
$7.00
Can't find what you want? Try our AI powered Search
Document information
Connected school, study & course
About the document
Uploaded On
Apr 03, 2023
Number of pages
20
Written in
Additional information
This document has been written for:
Uploaded
Apr 03, 2023
Downloads
0
Views
126




.png)

