Data Systems > QUESTIONS & ANSWERS > STAT 361 Data Analysis - Yale University WORKSHEET 3.7: STATISTICAL THINKING IN PYTHON (All)
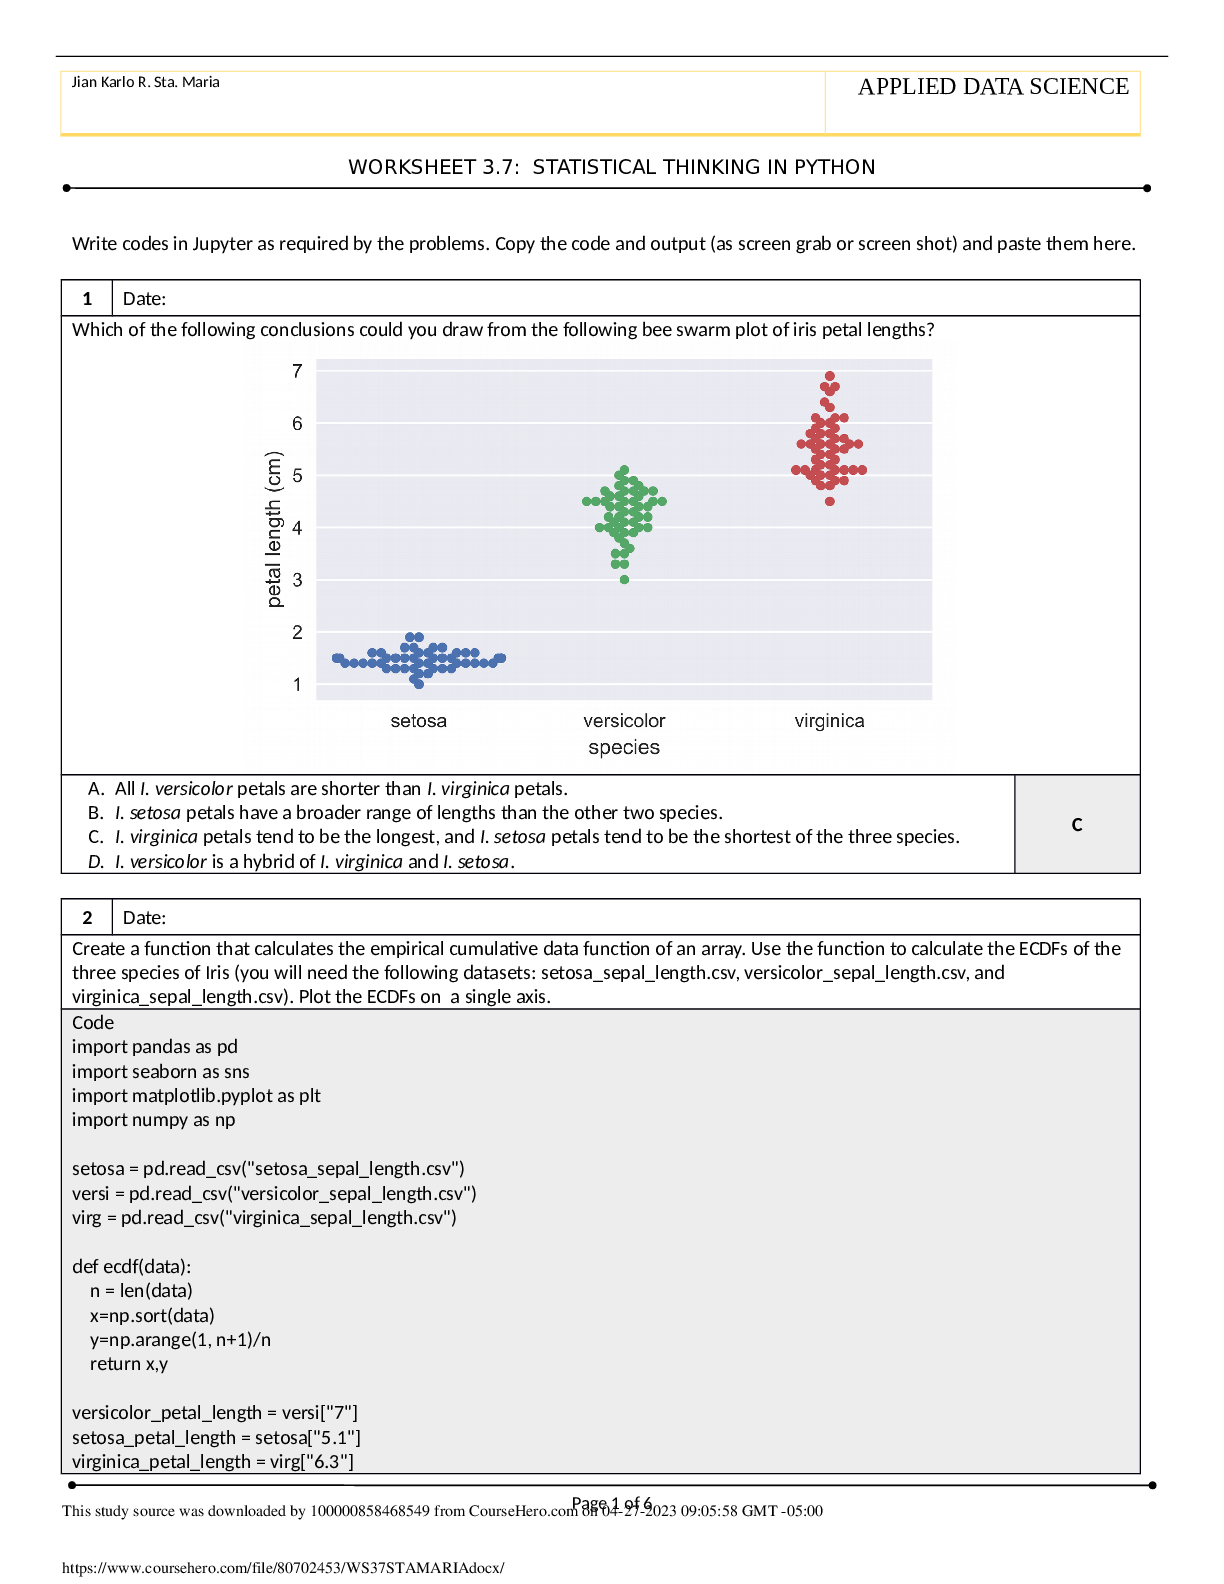
STAT 361 Data Analysis - Yale University WORKSHEET 3.7: STATISTICAL THINKING IN PYTHON
Document Content and Description Below
Last updated: 3 years ago
Preview 1 out of 6 pages
Instant download
Buy this Document to get the Full Access Instantly
Provided by Students Who Aced it
We Verify Document Content to Gurantee Accuracy
Reviews( 0 )
Document information
Connected school, study & course
About the document
Uploaded On
Apr 30, 2023
Number of pages
6
Written in
All

Additional information
This document has been written for:
Uploaded
Apr 30, 2023
Downloads
0
Views
141
Document Keyword Tags
Recommended For You
Get more on QUESTIONS & ANSWERS »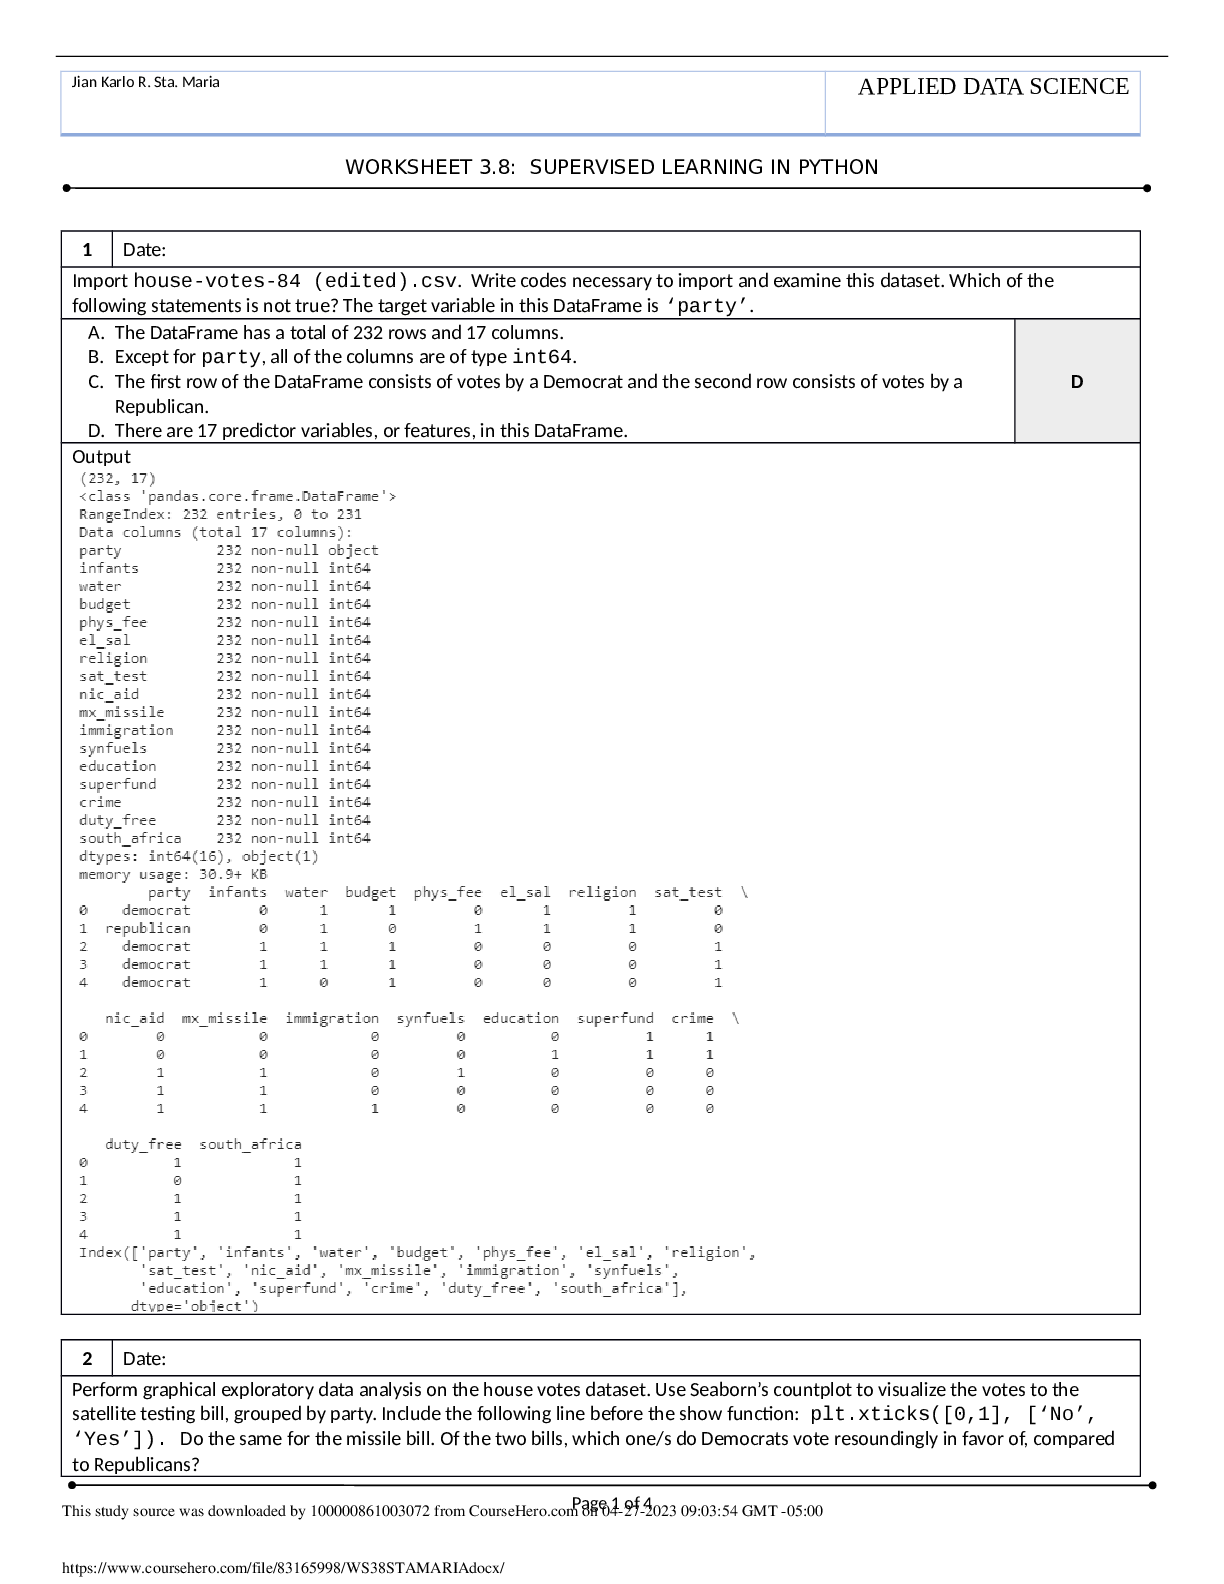
STAT 361 Data Analysis - Yale University WORKSHEET 3.8: SUPERV...

WGU C207 Module Quizzes Multi Choice Version Data-Driven Deci...

Solution Manual for Introduction to Data Science Data Analysis...
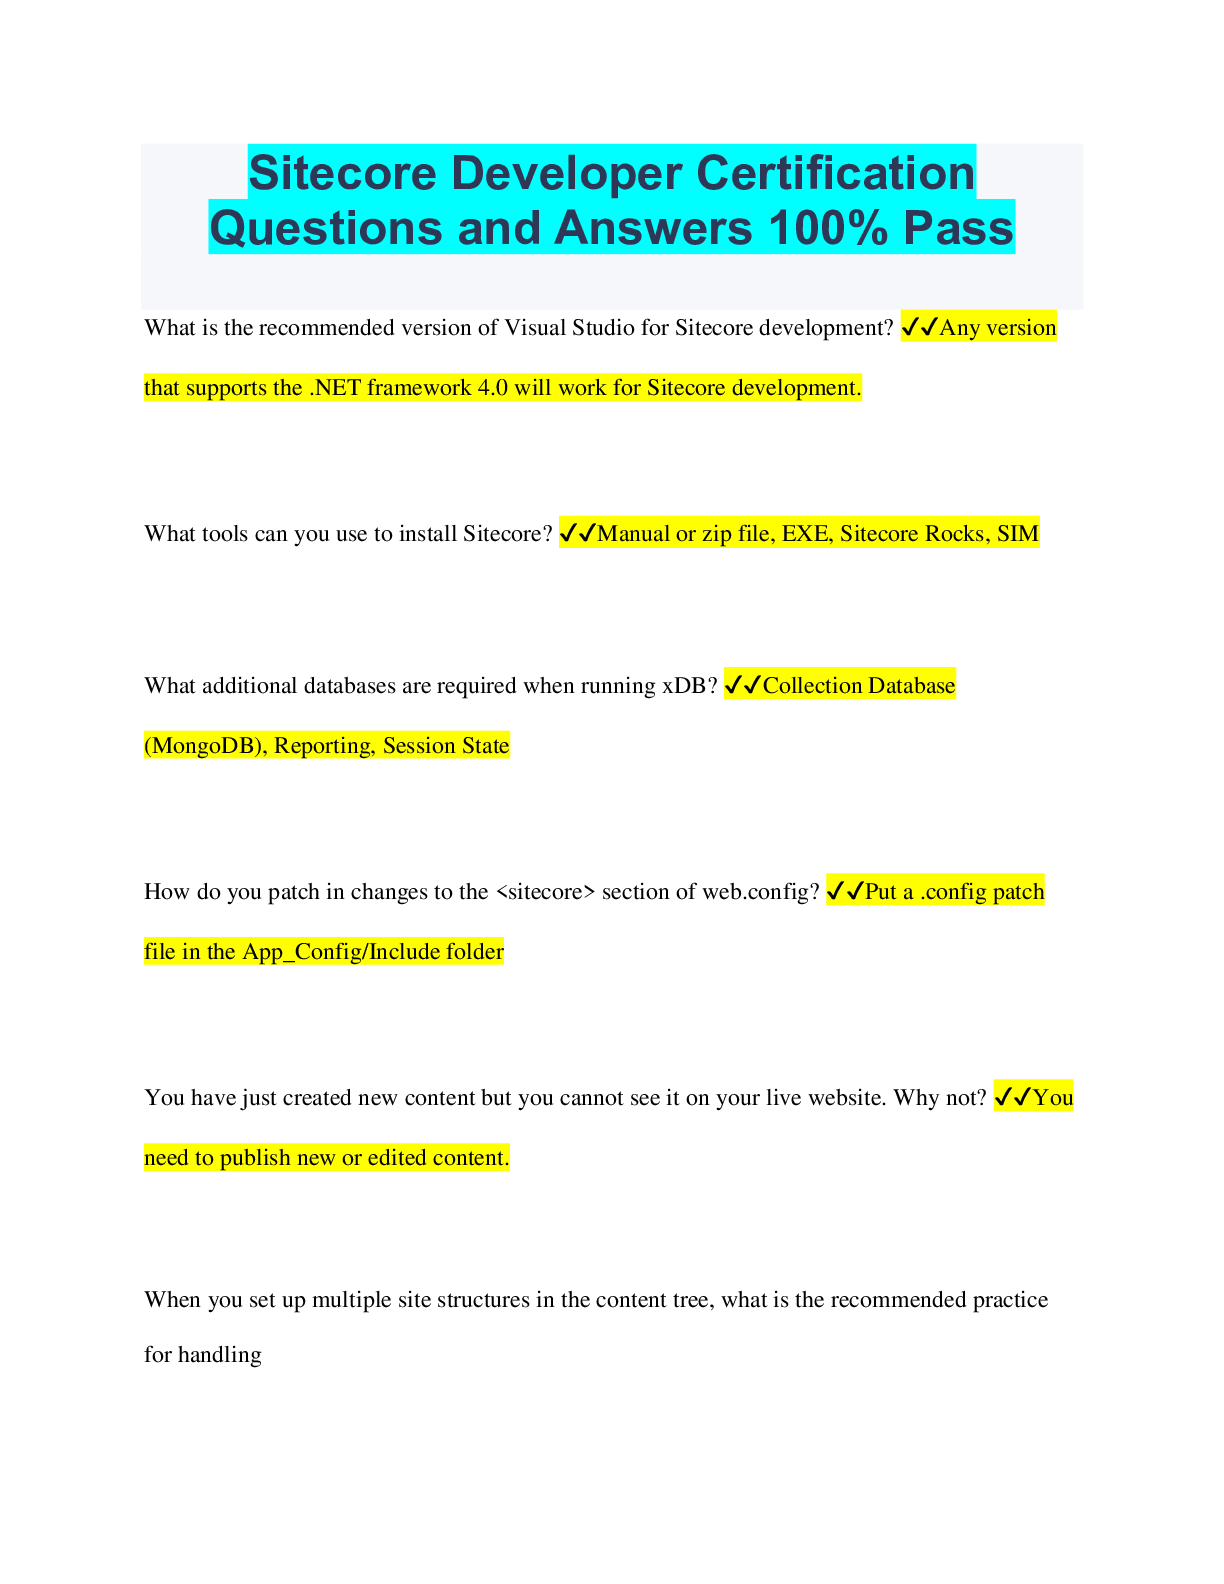
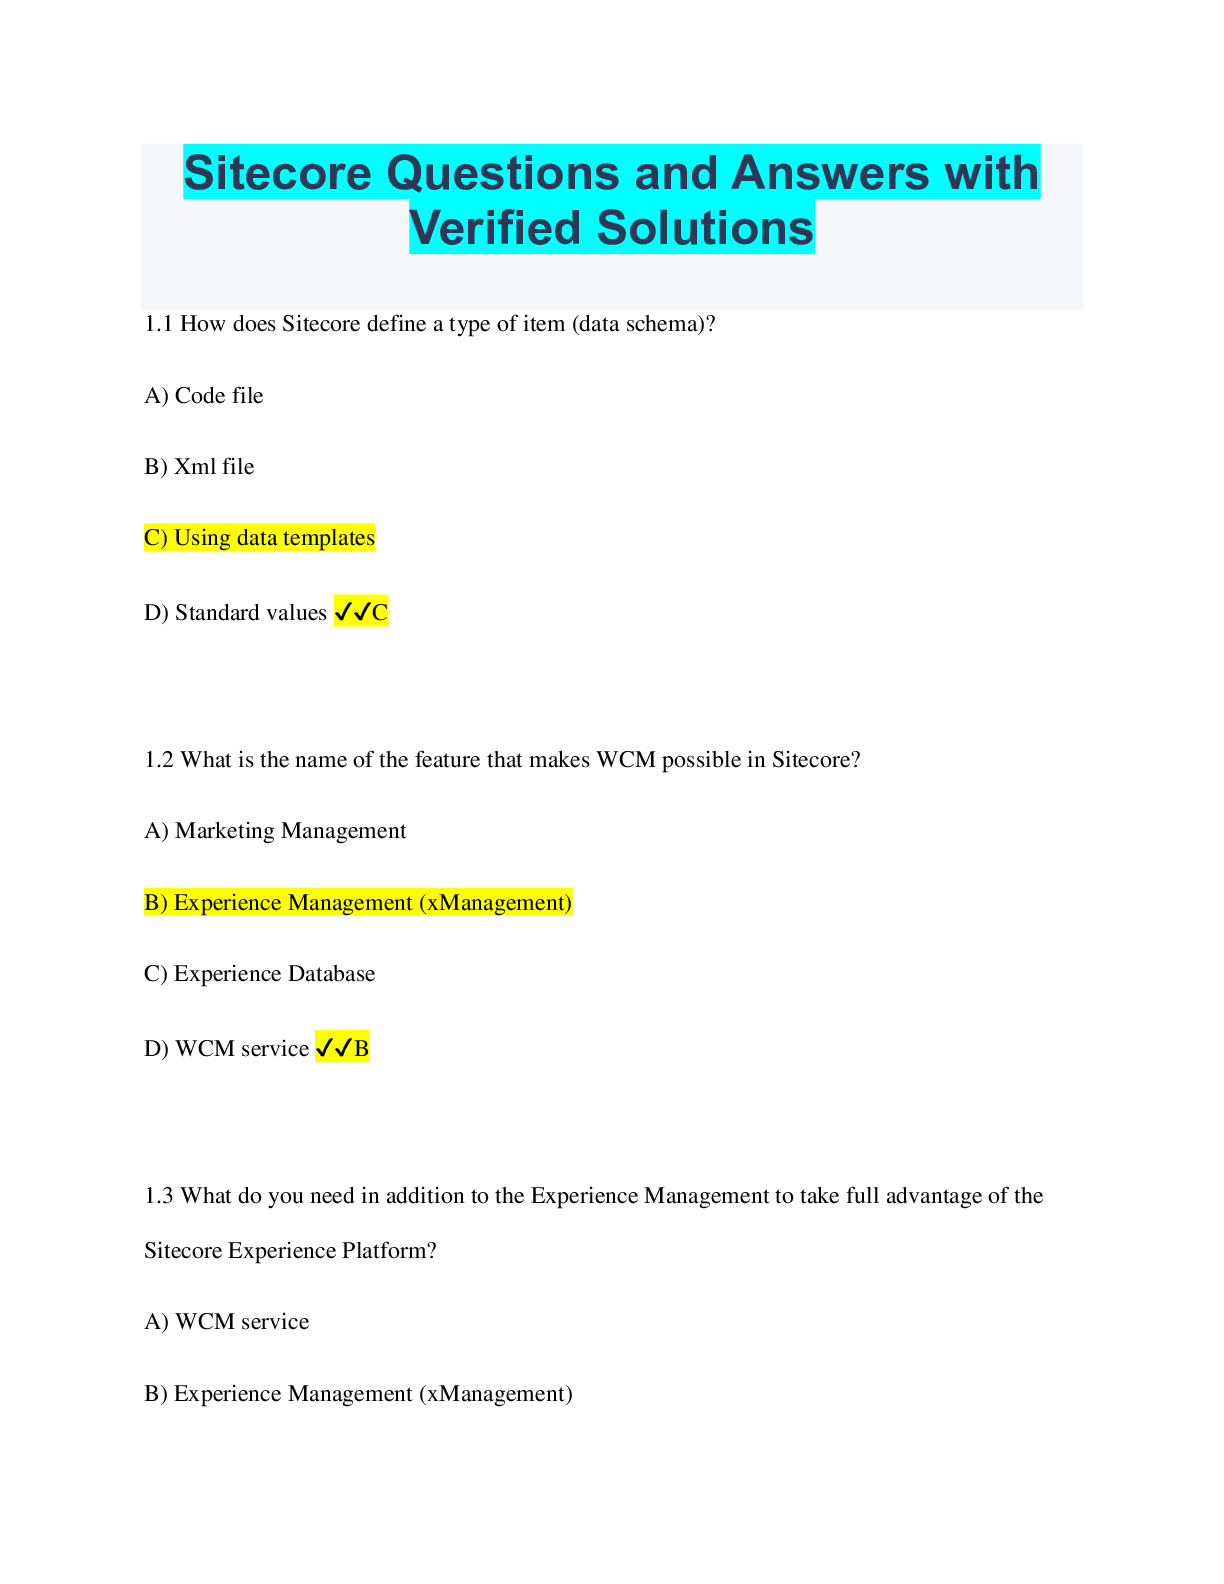
Sitecore Developer Certification Questions and Answers 100% Pa...
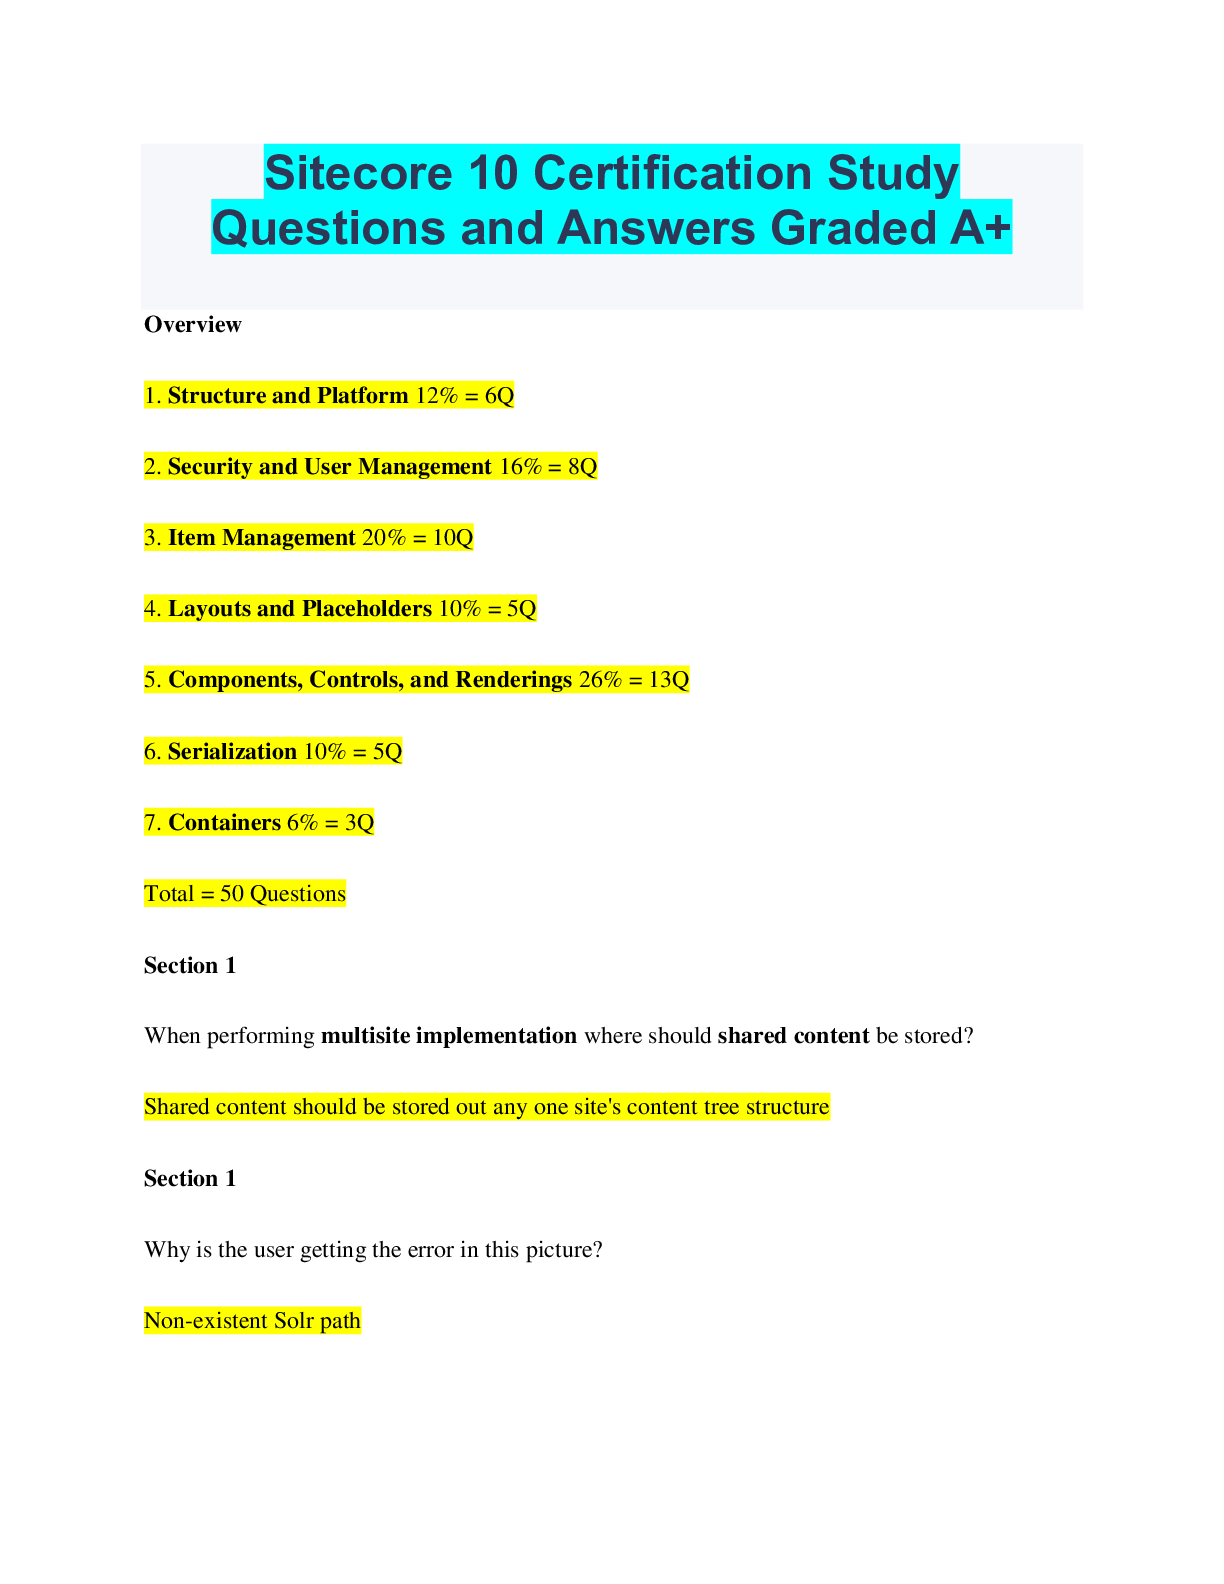
Sitecore 10 Certification Study Questions and Answers Graded A...

DOD MANDATORY CONTROLLED UNCLASSIFIED INFORMATION (CUI) TRAINI...

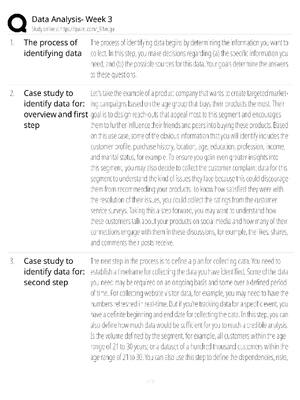
Data Analysis Week 3 Complete Study Guide & Practice Quiz Ban...

Data Structures and Algorithm Analysis in Java 3e Mark Weiss...

Data Structures and Algorithms in C++, 2e Michael Goodrich, Ro...
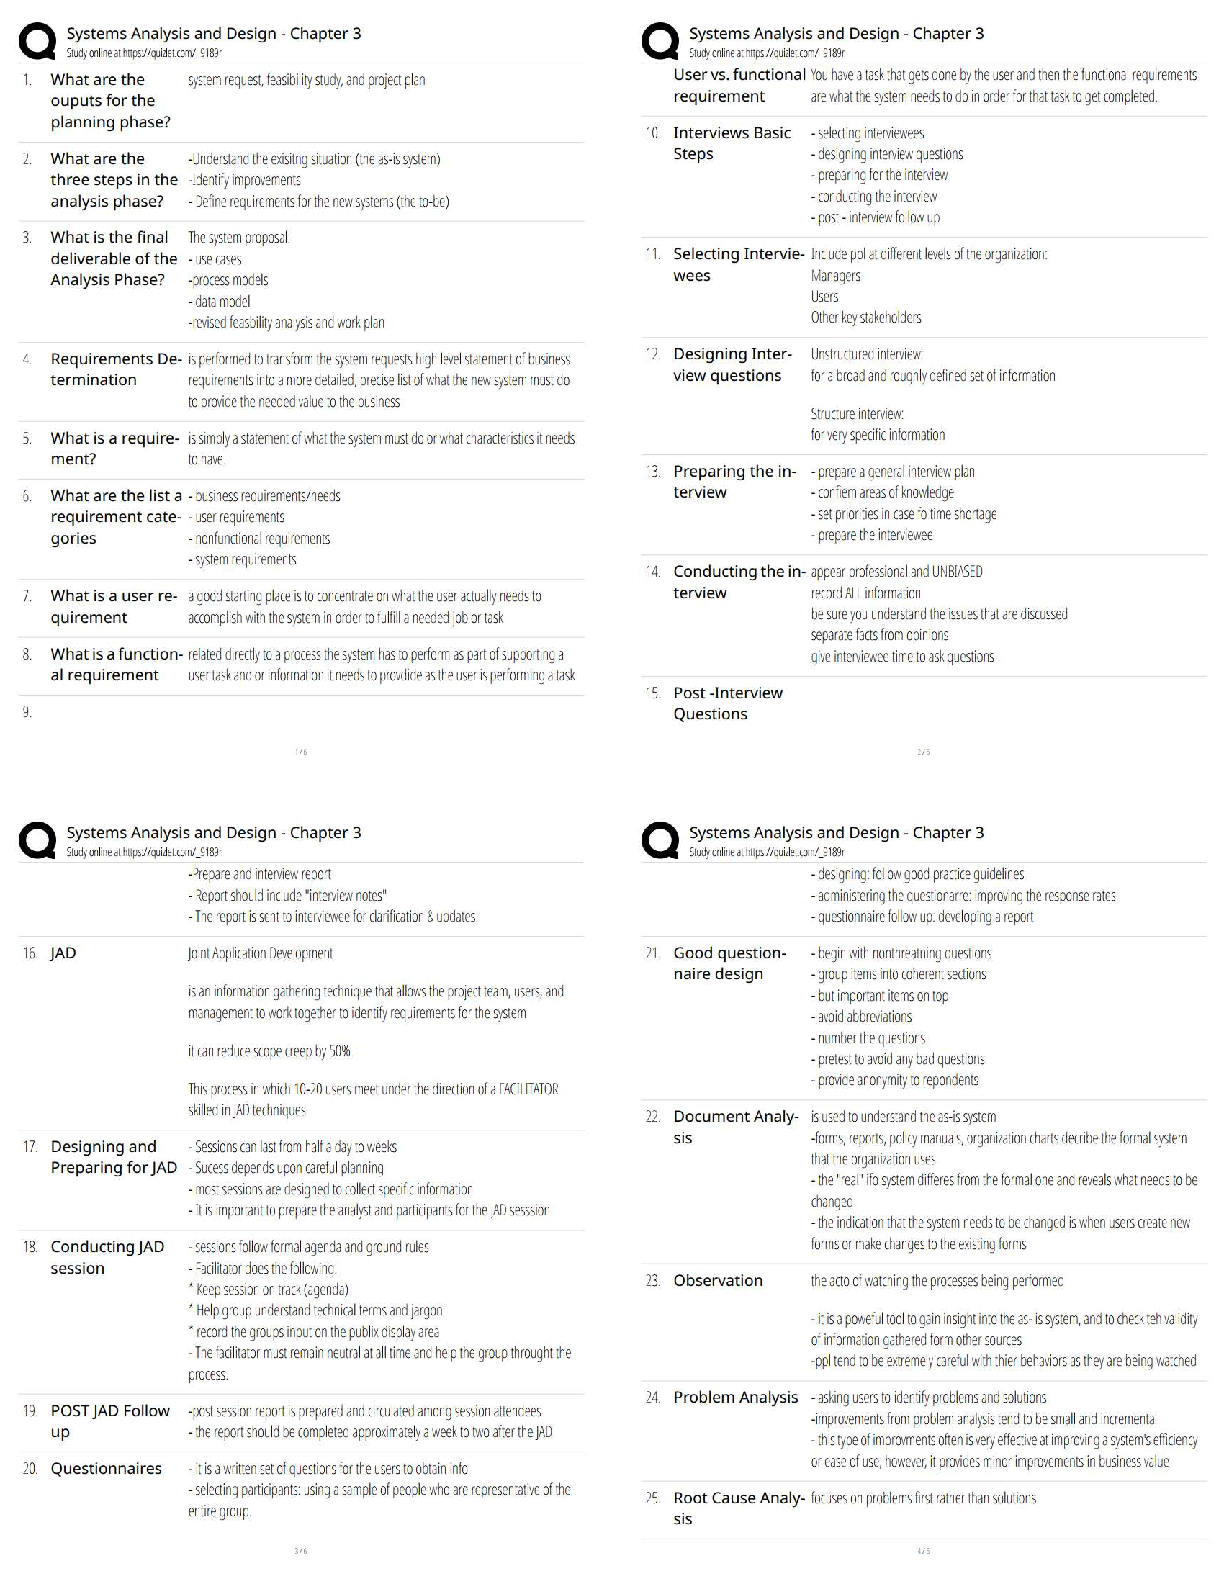
Systems Analysis and Design Chapter 3 Study Guide / New Vers...
Solution Manual for Introduction to Java Programming and Data...

Introduction to Data Science Midterm / Study & Practice Guide...
Introduction to Data Science Midterm / Study & Practice Guide...

Complete Test Bank for Database Systems Design, Implementation...

Test bank for Systems Analysis & Design 10th Edition by Kennet...