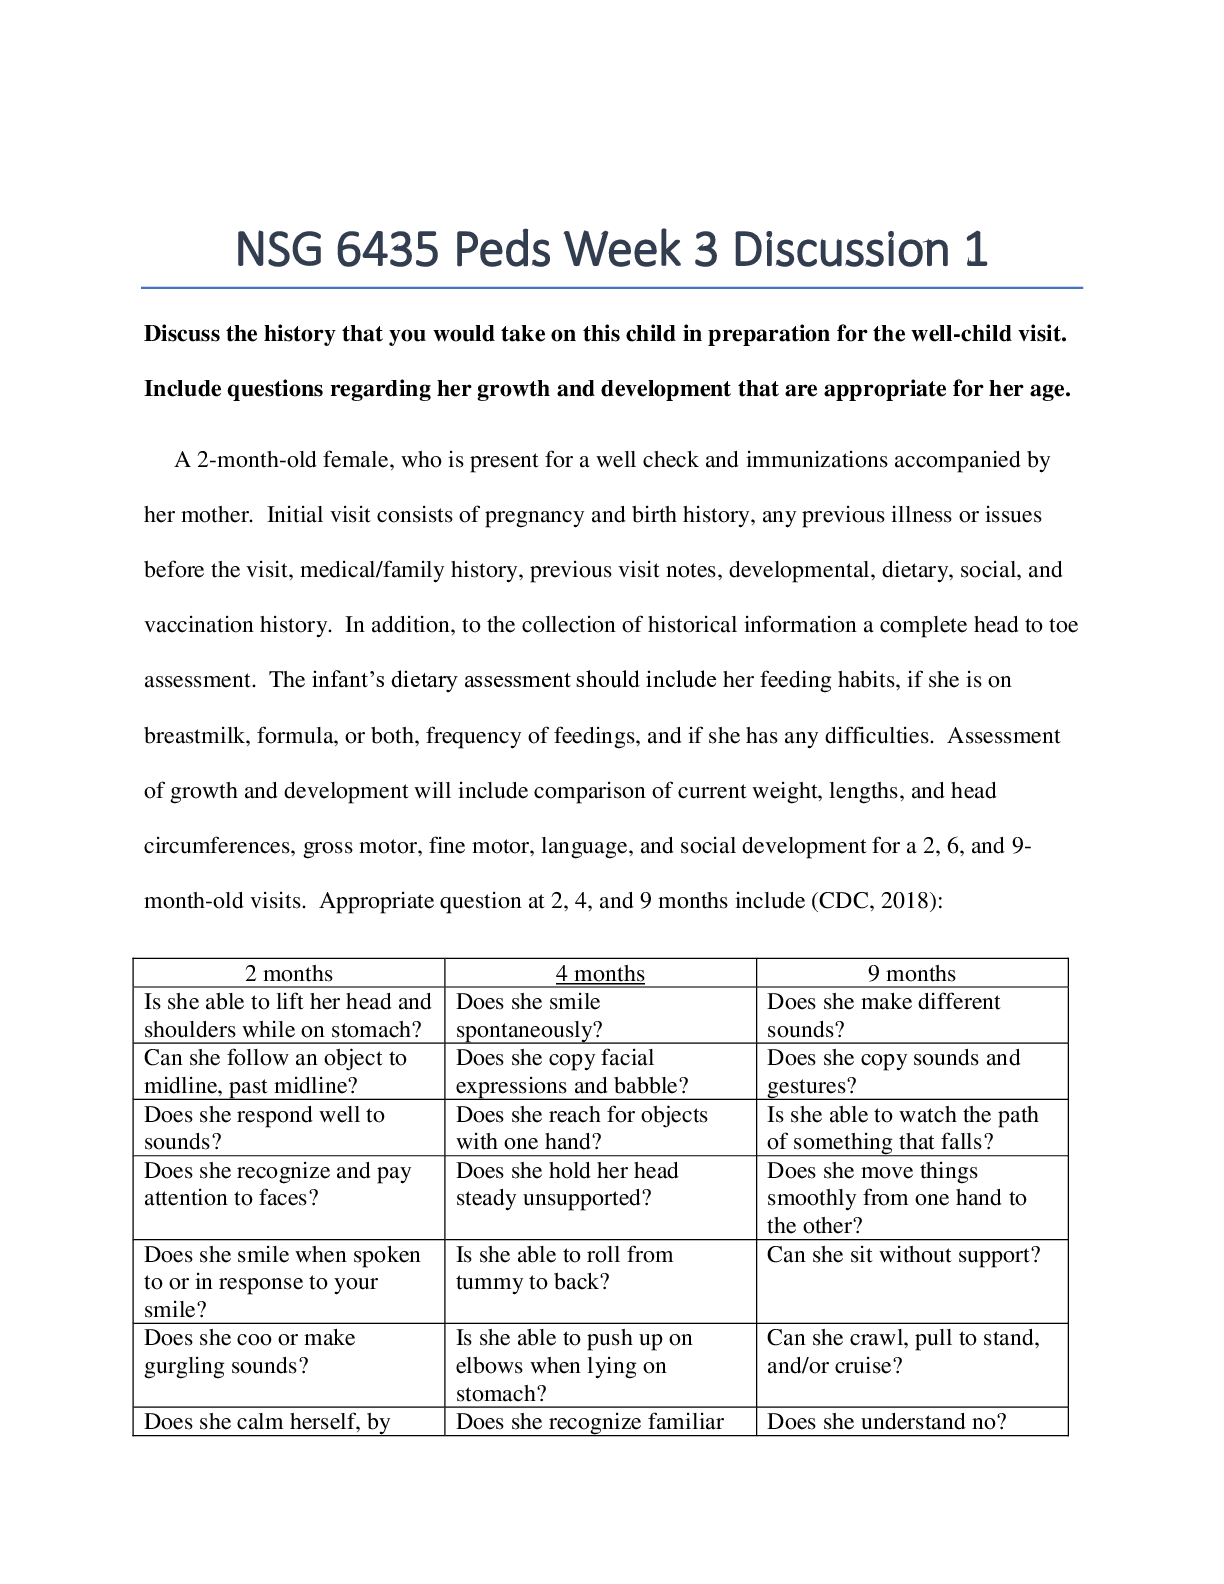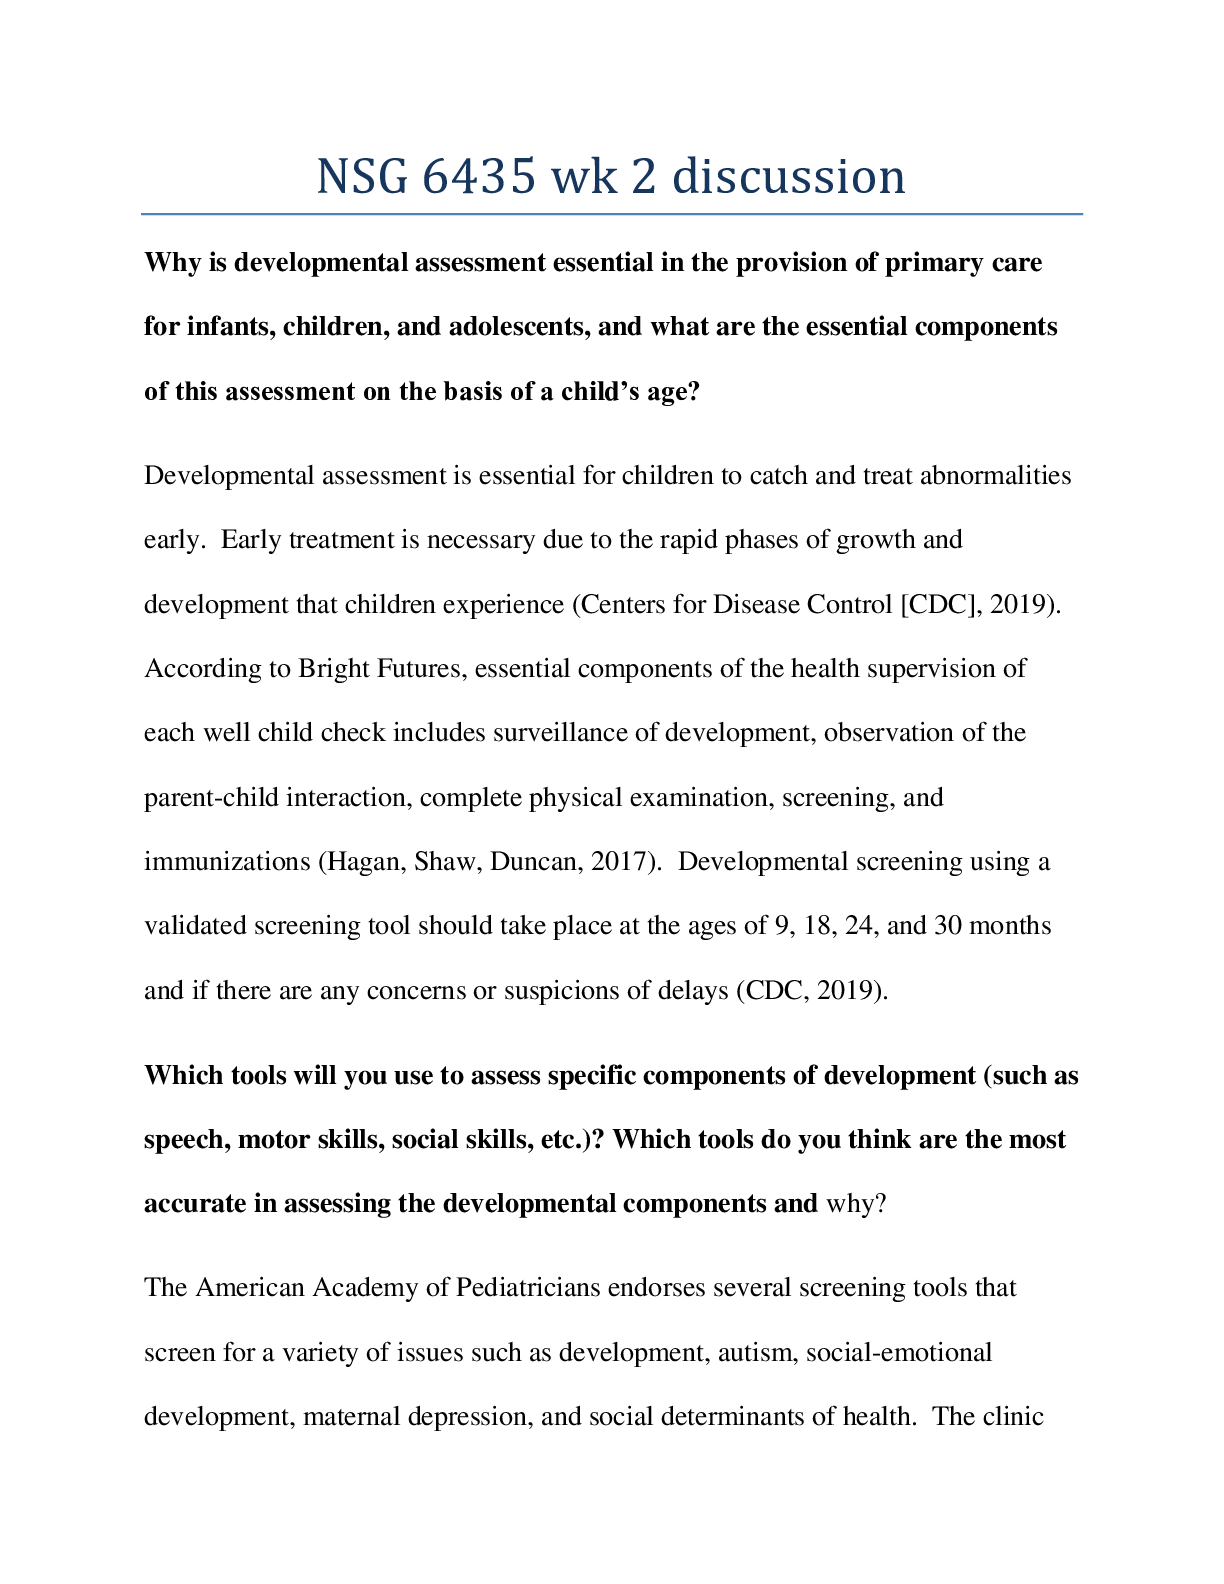
MENTAL HEALTH EXAM 1 2023/2024 CONCEPT GUIDE FOR MENTAL HEALTH QUESTIONS WITH CORRECT AND VERIFIED ANSWERS
$ 10

Data Structures and Algorithm Analysis in Java 3e Mark Weiss (Solution Manual)
$ 25

NSG 6020 MIDTERM EXAM QUESTION AND ANSWERS.
$ 14.5
eBook Extremum Problems for Eigenvalues of Elliptic Operators Frontiers in Mathematics 1st Edition by Antoine Henrot
$ 29
APES Final Review Vocabulary, All Definitions, 100% examinable. Rated A+
$ 10
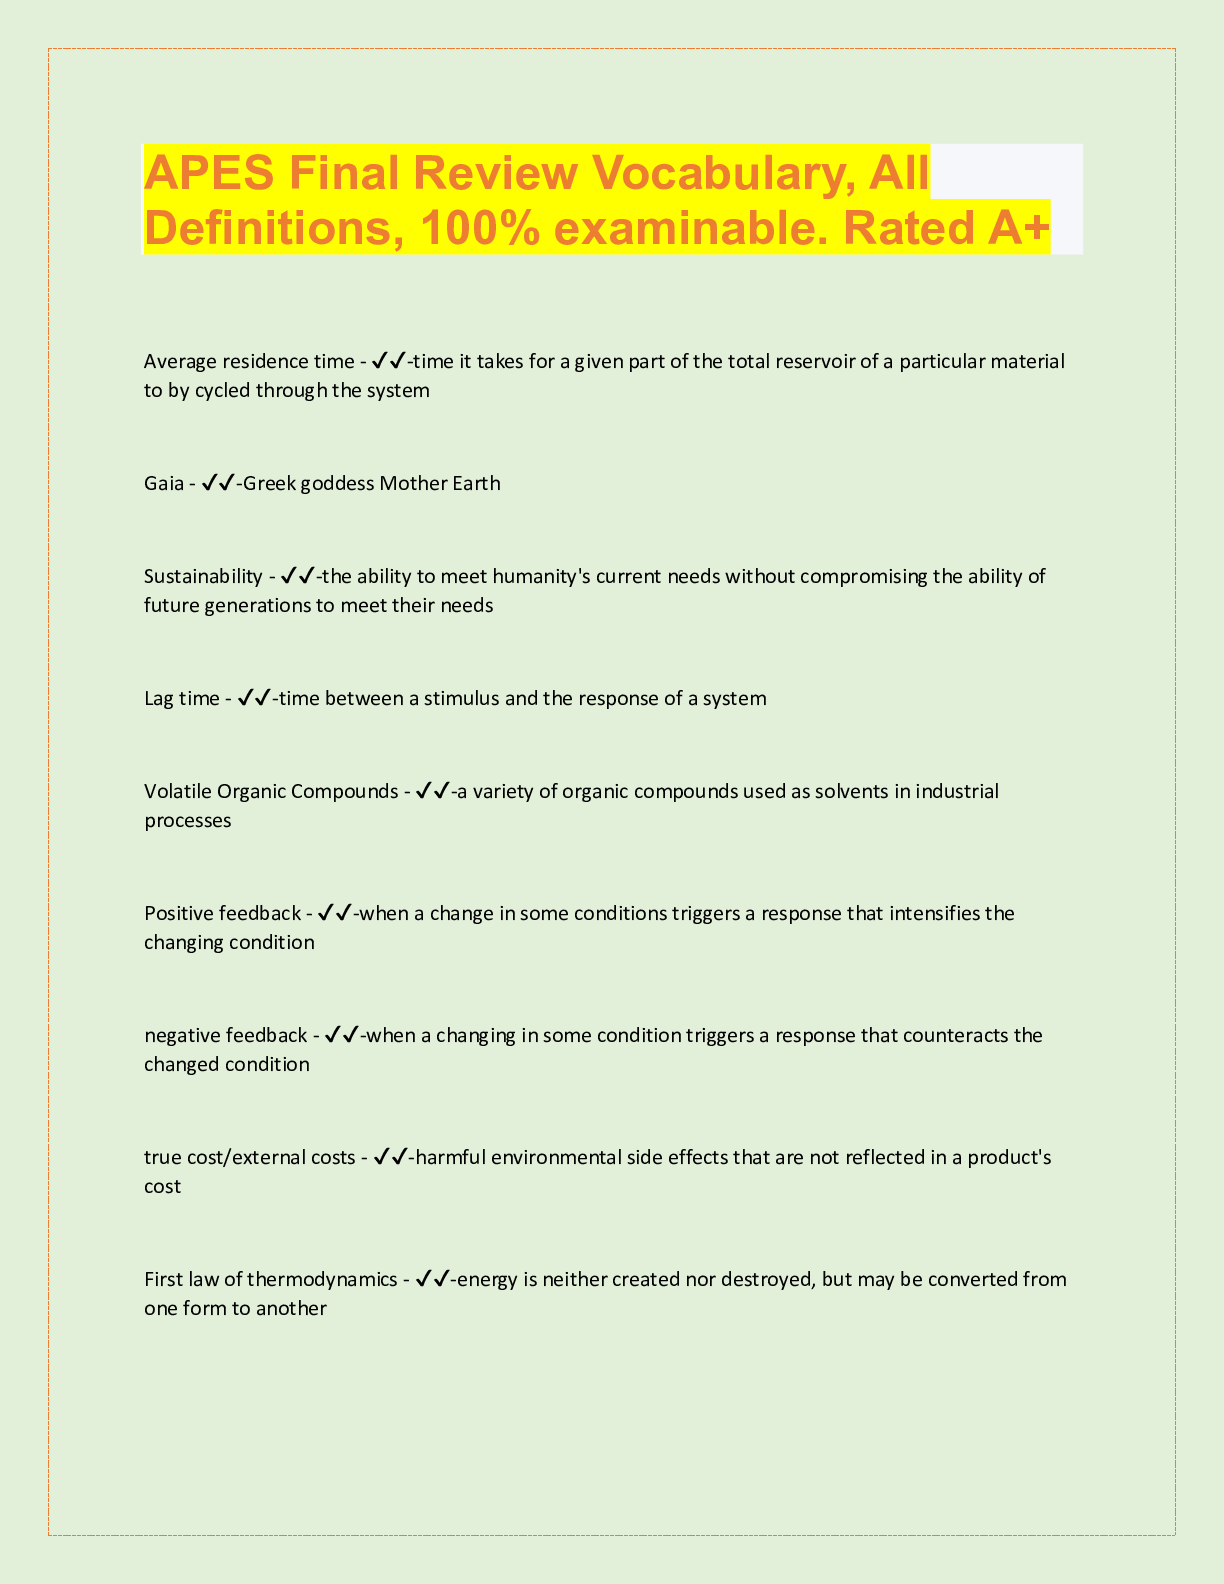
BIO201L LAB_V3_Lab 9 The Endocrine System (QUESTIONS AND ANSWERS)
$ 5.5

HUMN 303N Week 7 Assignment Essay – Controversial Art and Censorship Latest 2023
$ 11

A Level Physics B {ADVANCING PHYSICS}_H557/02 Question Paper Nov 2020 | Scientific Literacy in Physics
$ 7
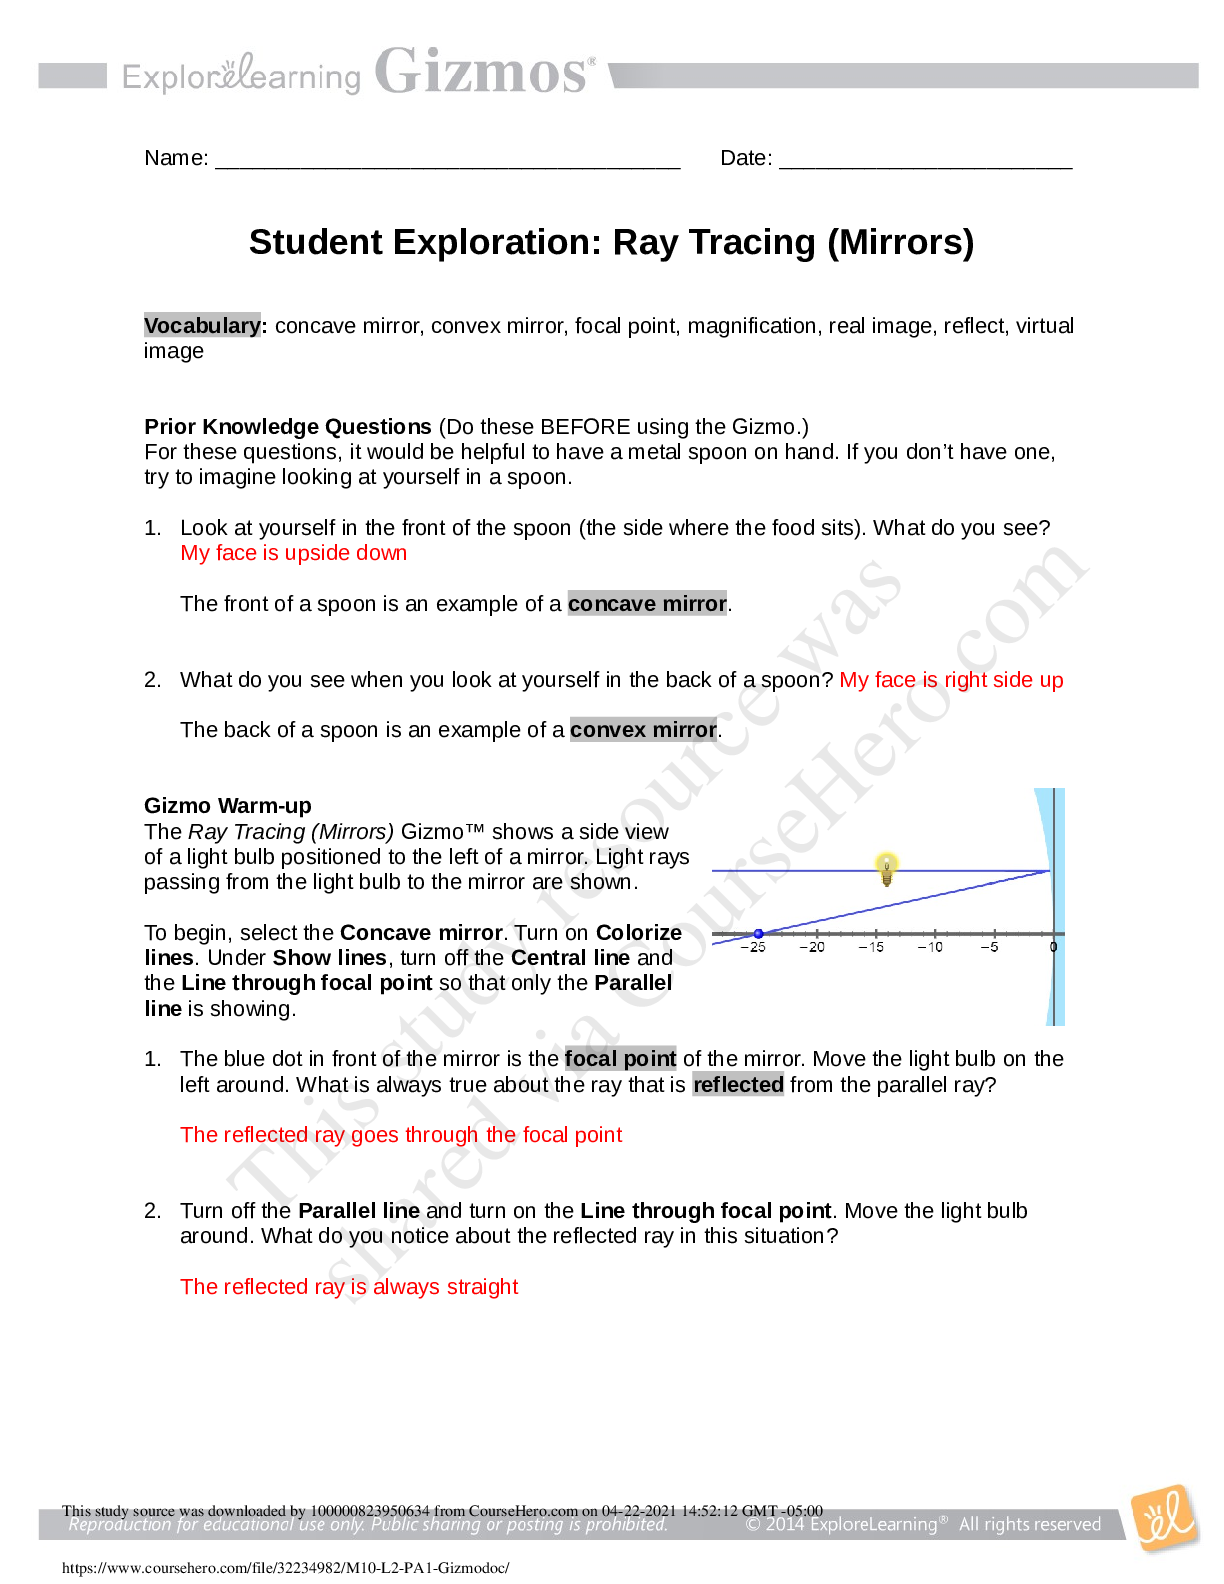
Ray Tracing (Mirrors) GIZMO
$ 7
.png)
EDEXCEL Mark Scheme (Results) November 2021 Pearson Edexcel GCE In Biology Spec A (8BN0) /;
$ 13.5
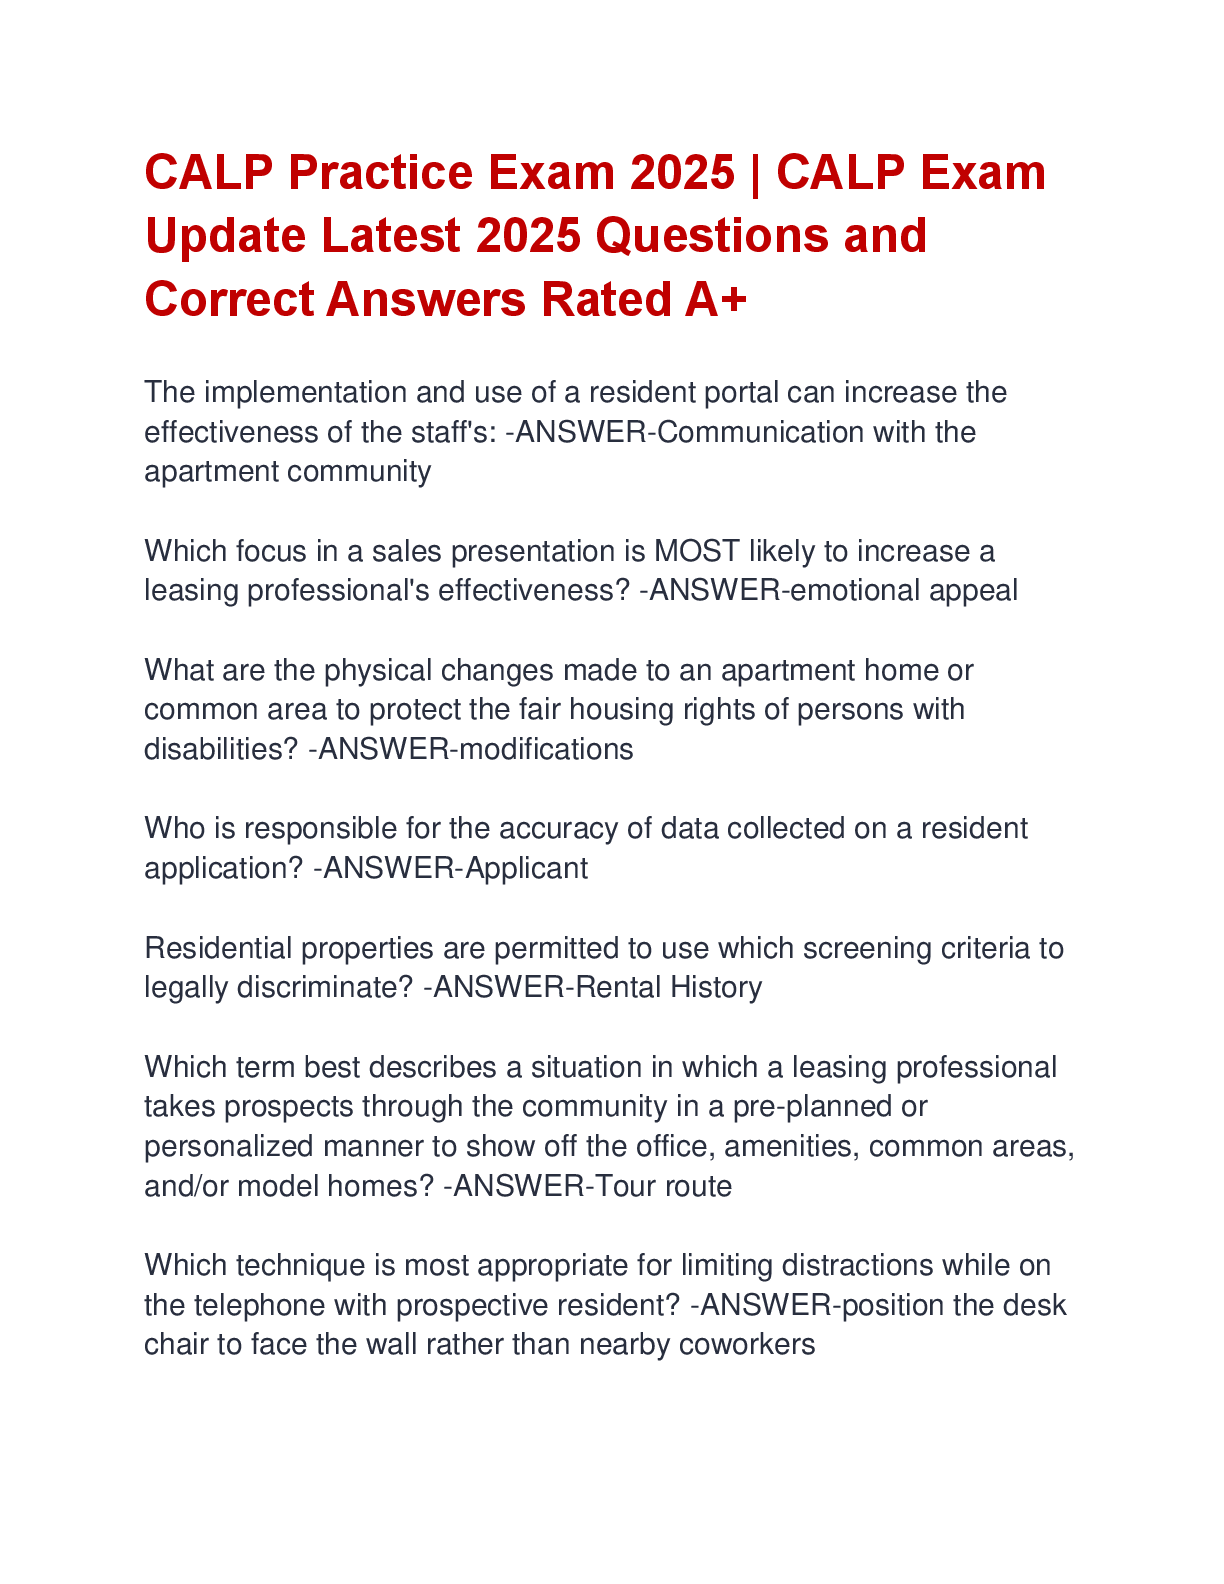
CALP Practice Exam 2025 | CALP Exam Update Latest 2025 Questions and Correct Answers Rated A+
$ 16
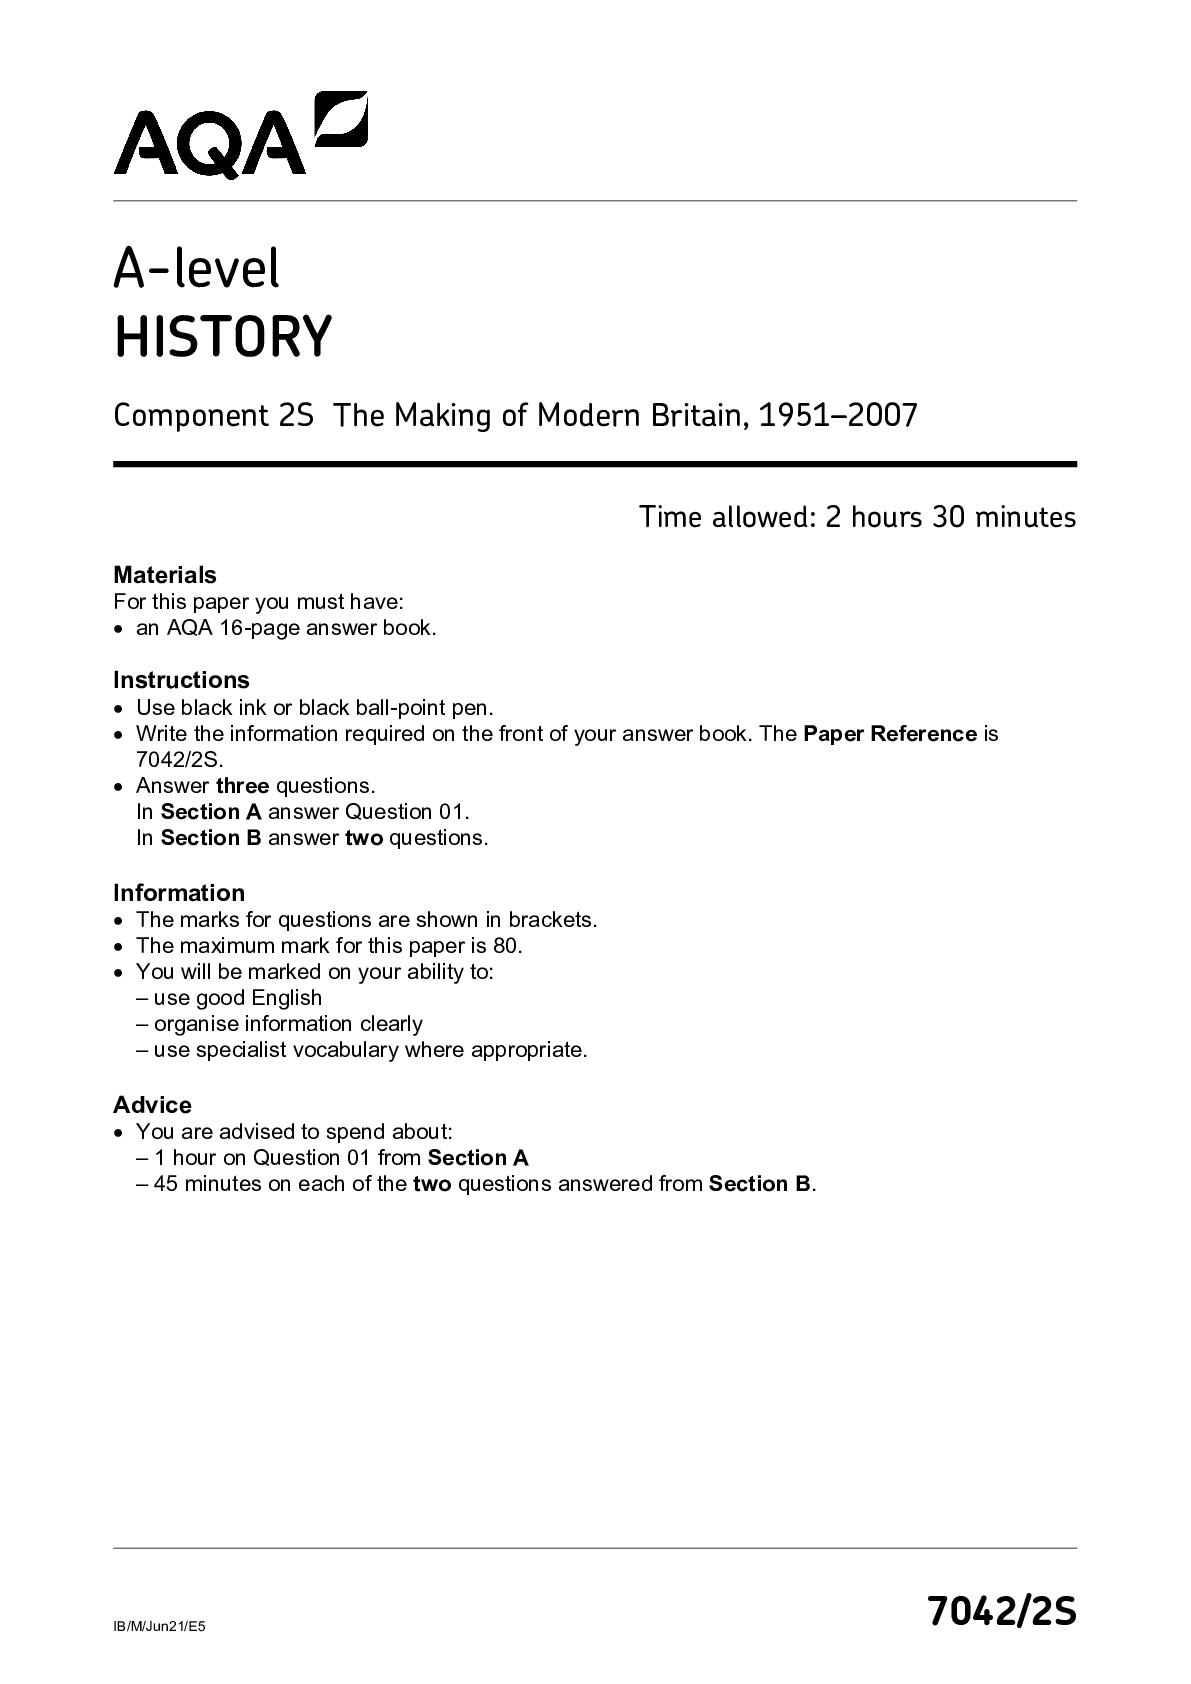
AQA A-level HISTORY 7042 Component 2S The Making of Modern Britain, 1951–2007 June 2021, QP.
$ 5

HIEU 202 History of Western Civilization II: All Quizzes (answered fall 2022) Ace in your studies in one attempt.
$ 20
NCLEX-PN Test Prep Questions and Answers with Explanations V2 PRACTICE EXAM 1 (2020/2021)(STUDY MODE)
$ 12

Digital Design Principles and Practices, 4e John Wakerly (Solution Manual)
$ 25
NSG 6420 Midterm Exam 3 (Questions and Answers)
$ 12.5
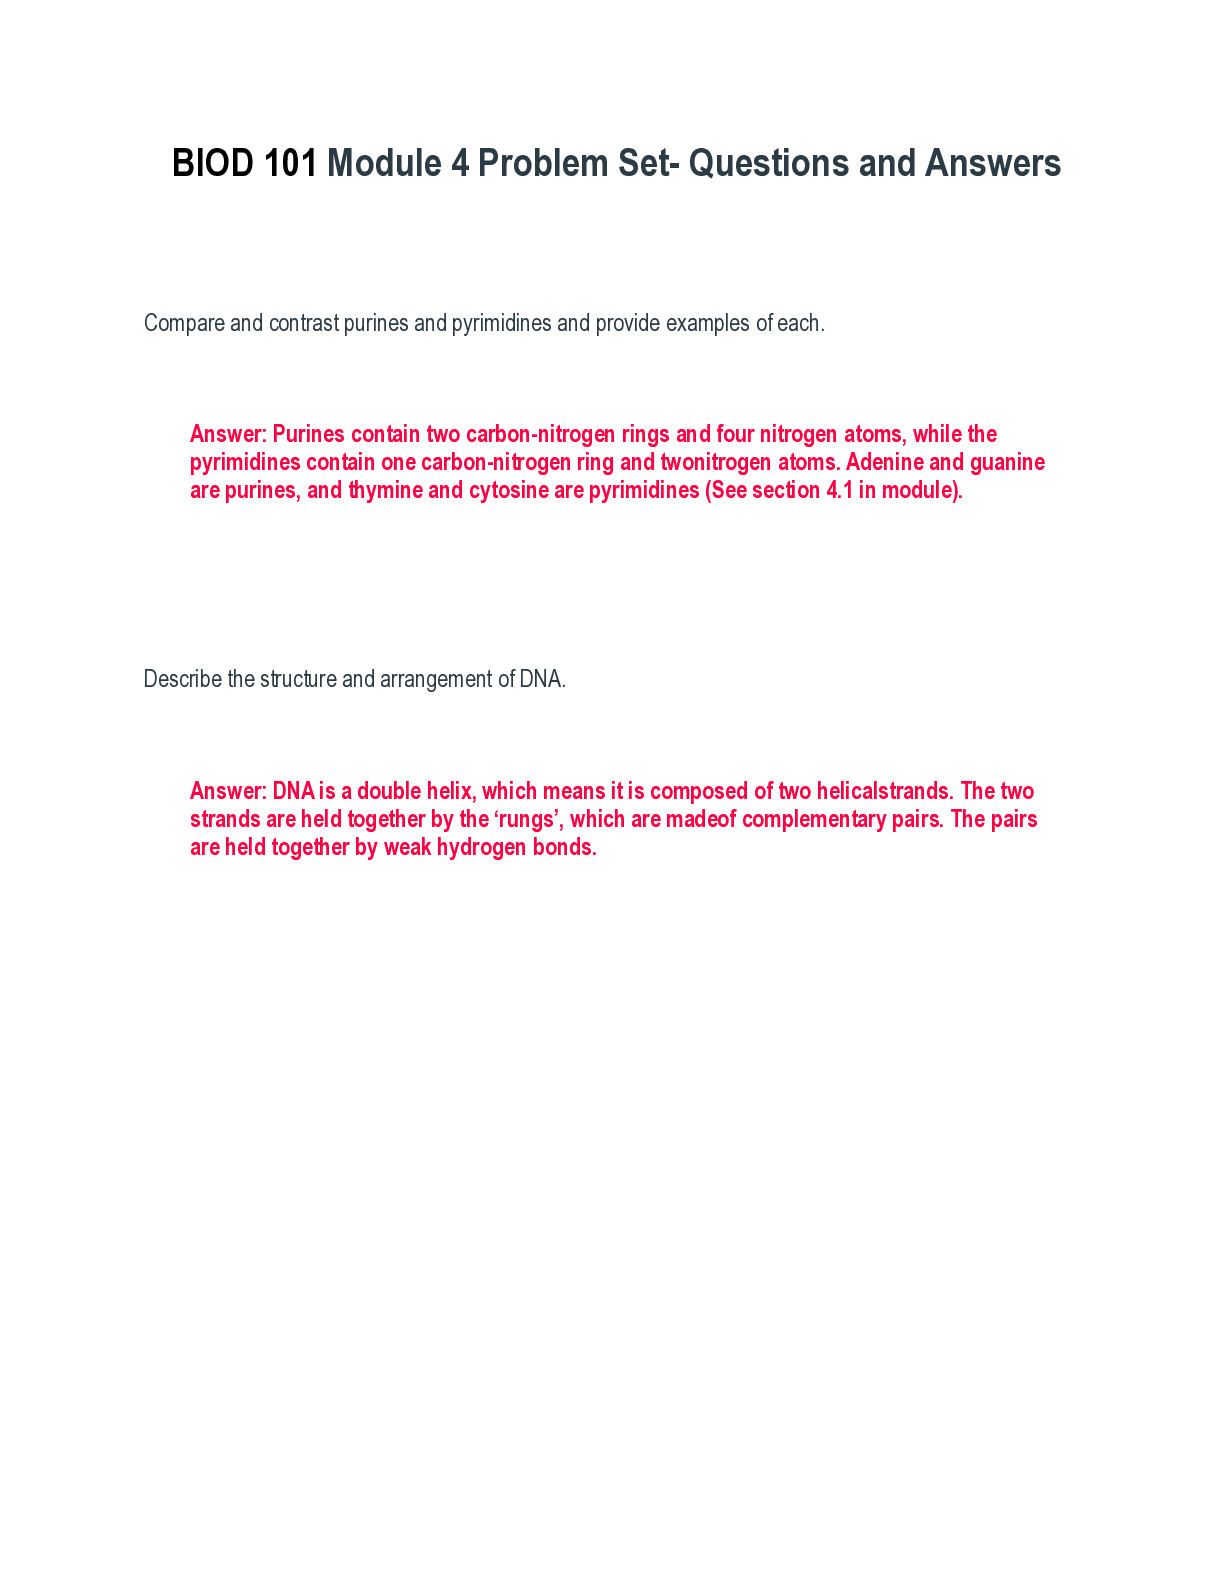
BIOD 101 Module 4 Problem Set- Questions and Answers
$ 21
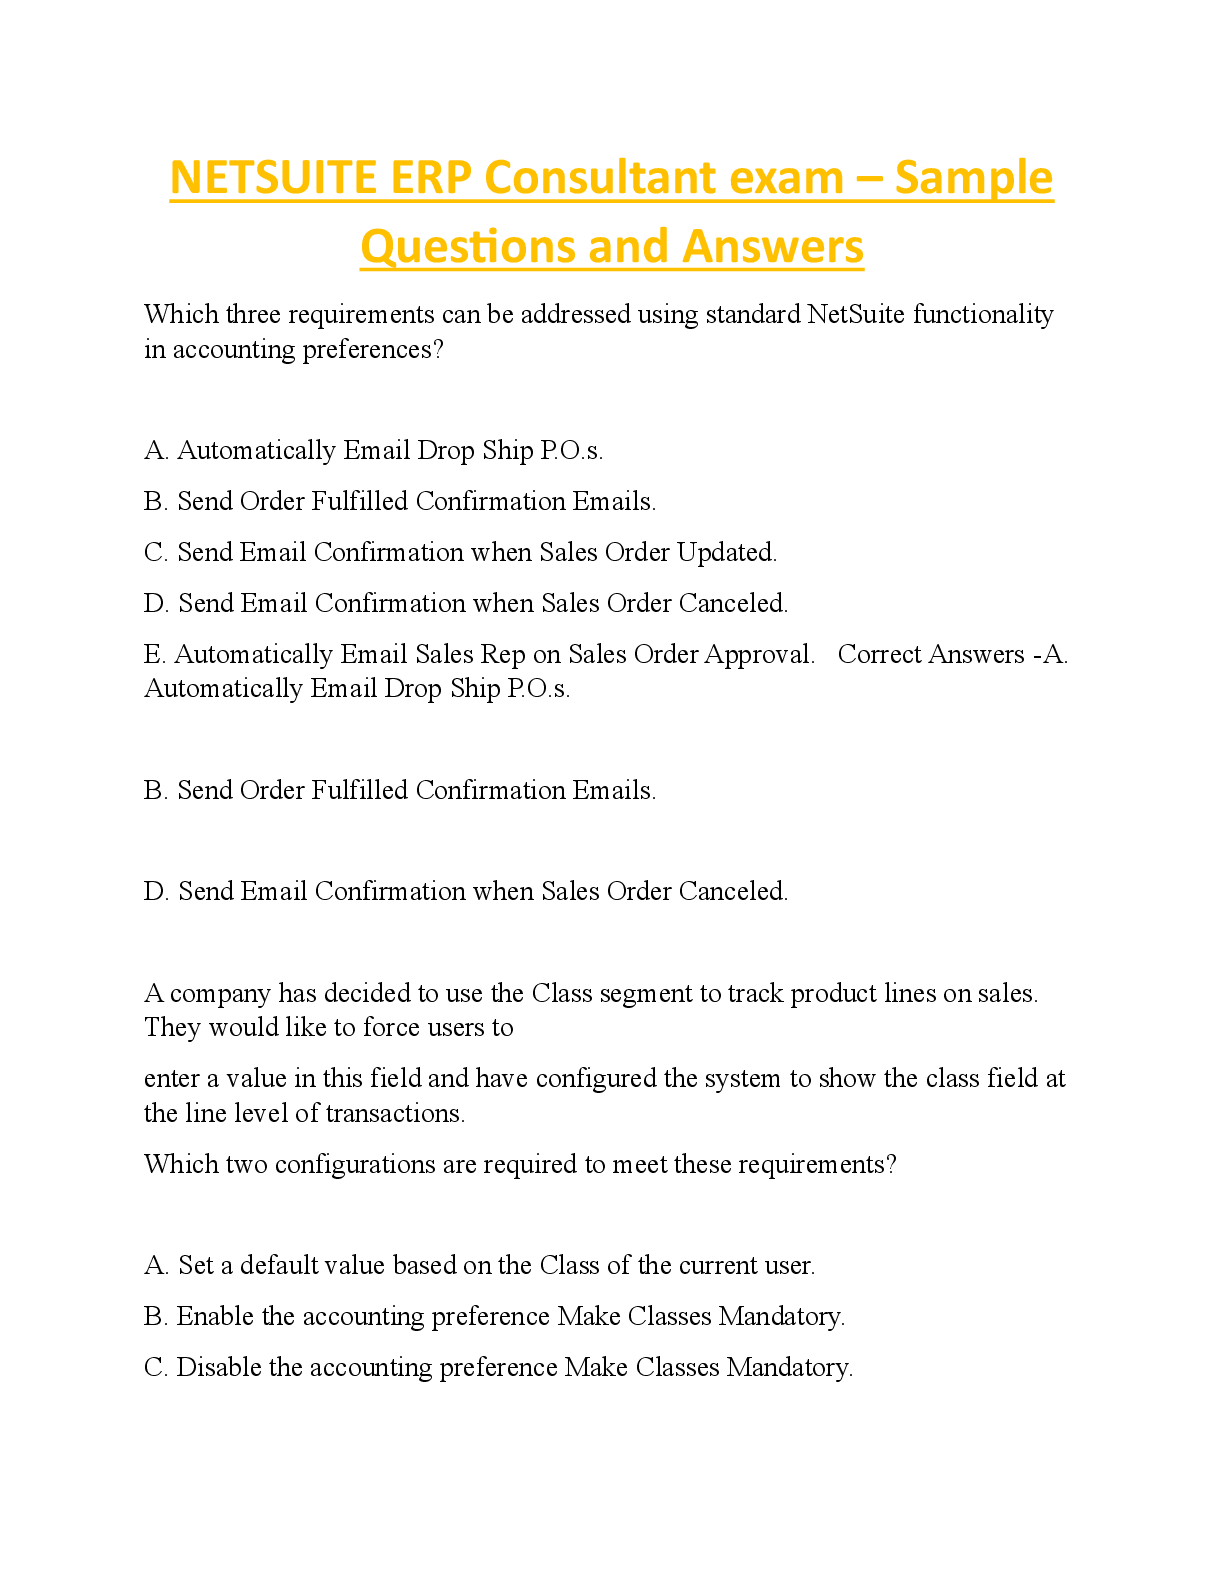
NETSUITE ERP Consultant exam – Sample Questions and Answers
$ 13
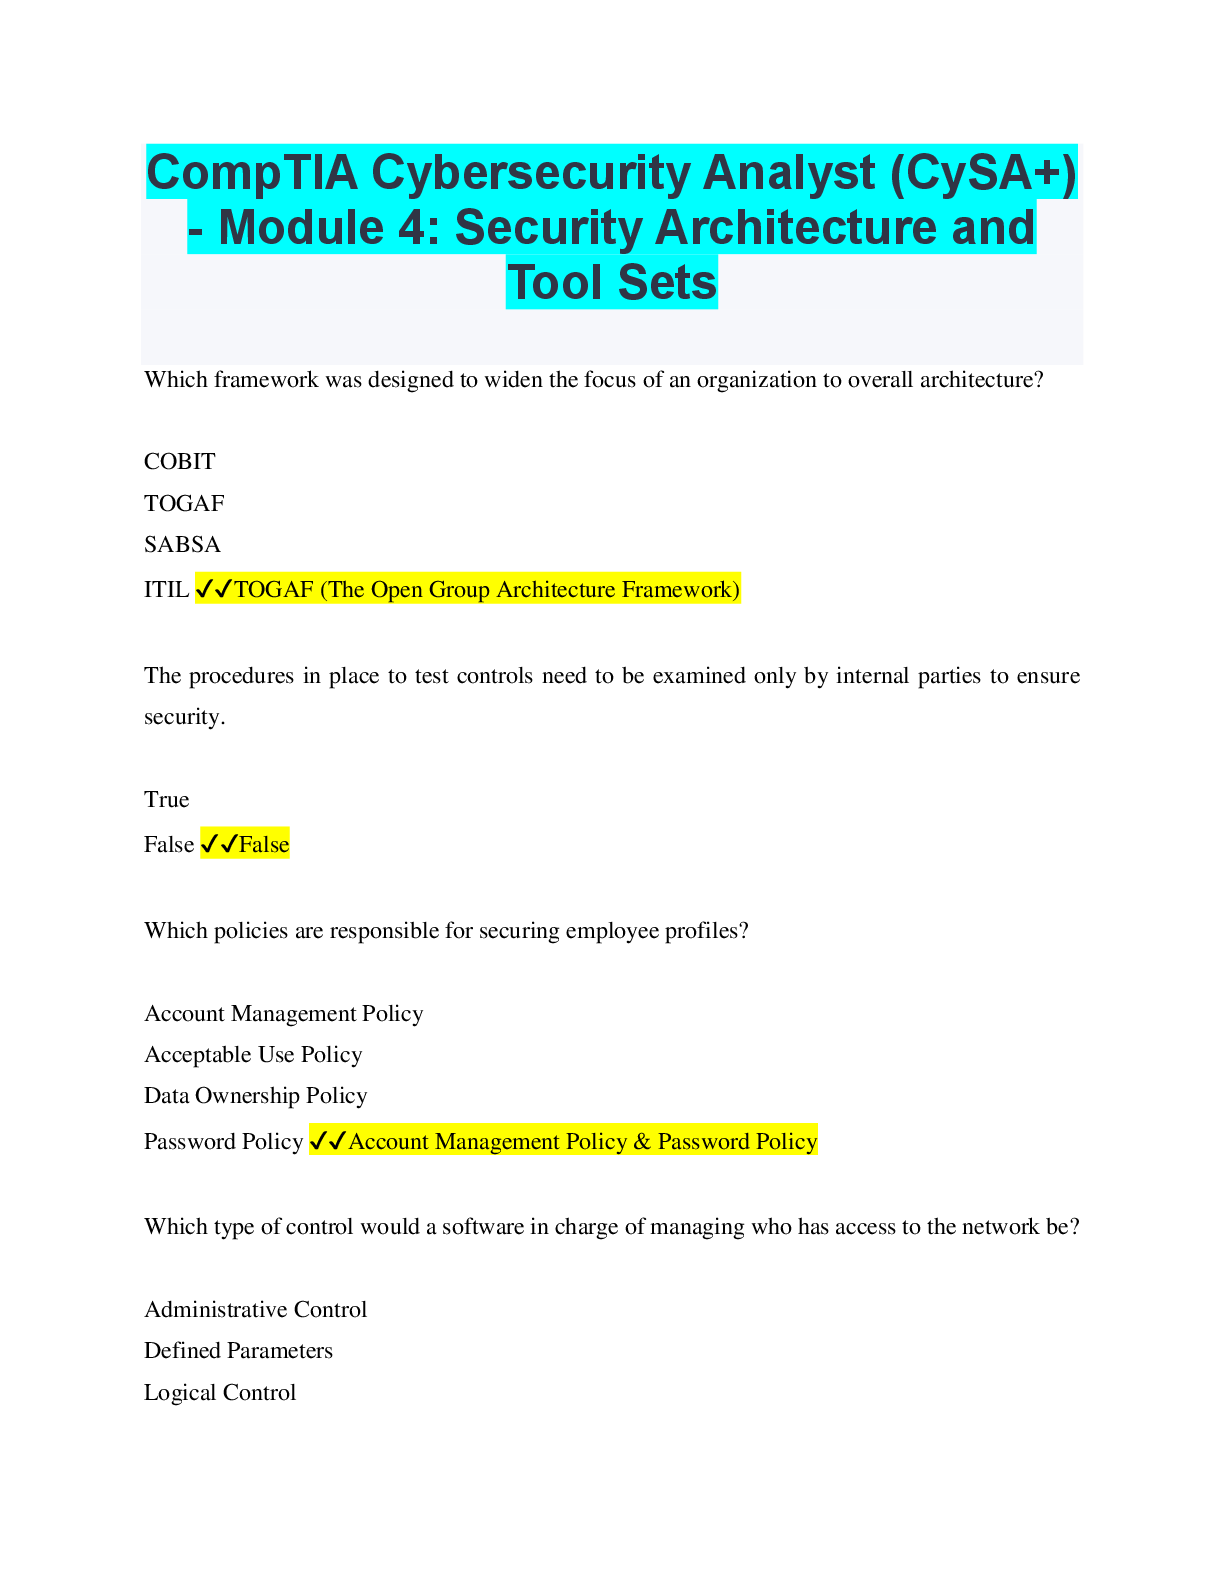
CompTIA Cybersecurity Analyst (CySA+) - Module 4 | Security Architecture and Tool Sets
$ 10
Solution Manual For Advanced Engineering Mathematics 7th Edition By PETER V ONEIL
$ 30

BIOS 251 Week 3 Lab Assignment: Cell Membrane and Transport: Learn how transporters keep cells healthy
$ 13
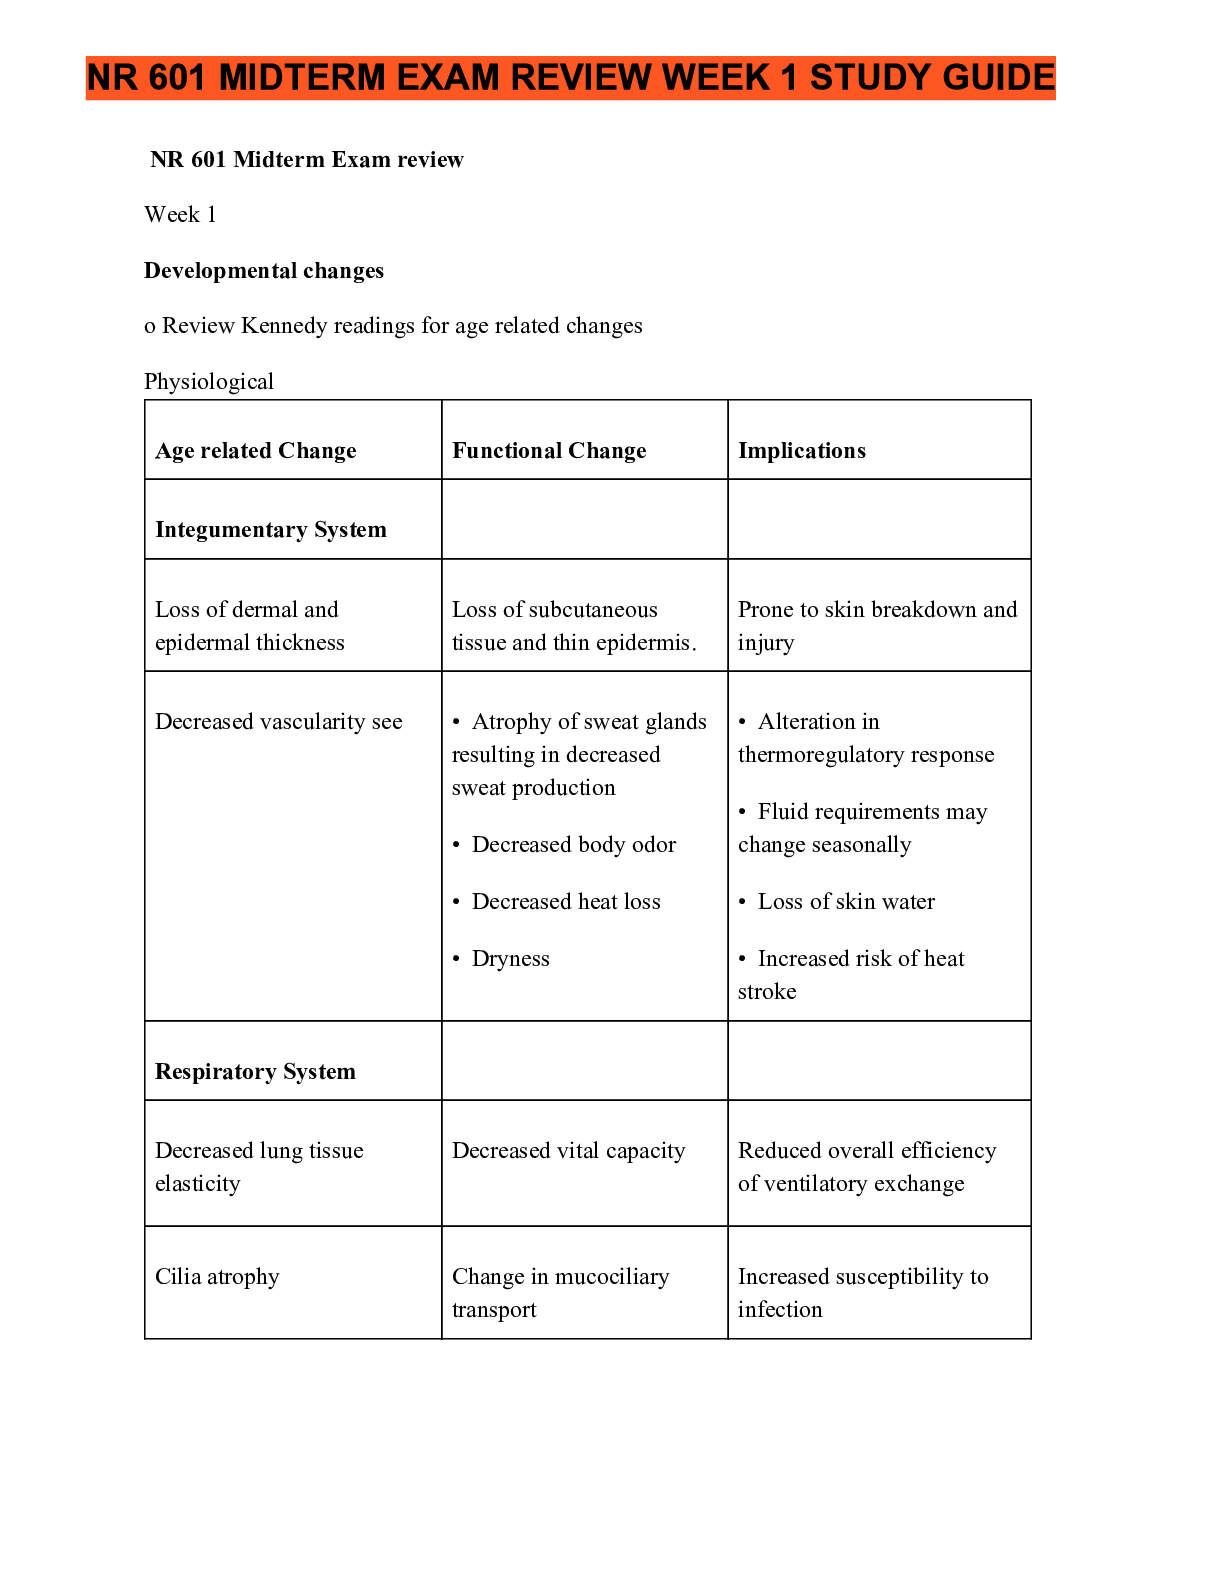
NR 601 Midterm Exam review November 2020 (For high scoring grades)
$ 11
BIOL 101 Quiz 8 Complete Q bank | Complete Q&A Updated fall 2025/2026.
$ 10.5

SHRM CP - 2022 | 50 Questions with 100% Correct Answers & Rationale
$ 10
ATI PN Pharmacology Proctored Exam Review Questions and Answers Rated A
$ 11
 Summer 2022.png)
Sophia Learning Art History 1 – Unit 3 Milestone 3Art history 1 Challenge unit 3 Sophia Course (answers) Summer 2022
$ 15
NURS 4465 / NURS 4465 MODULE 4 QUIZ 4
$ 13
Module 6 Quiz: Chapter 6 and 16: HUMN 330 Values and Ethics (redone all answers correct) Fall2021
$ 10

Digital Forensics (Module 4 Post Test) QUESTIONS AND ANSWERS| 100% CORRECT
$ 13
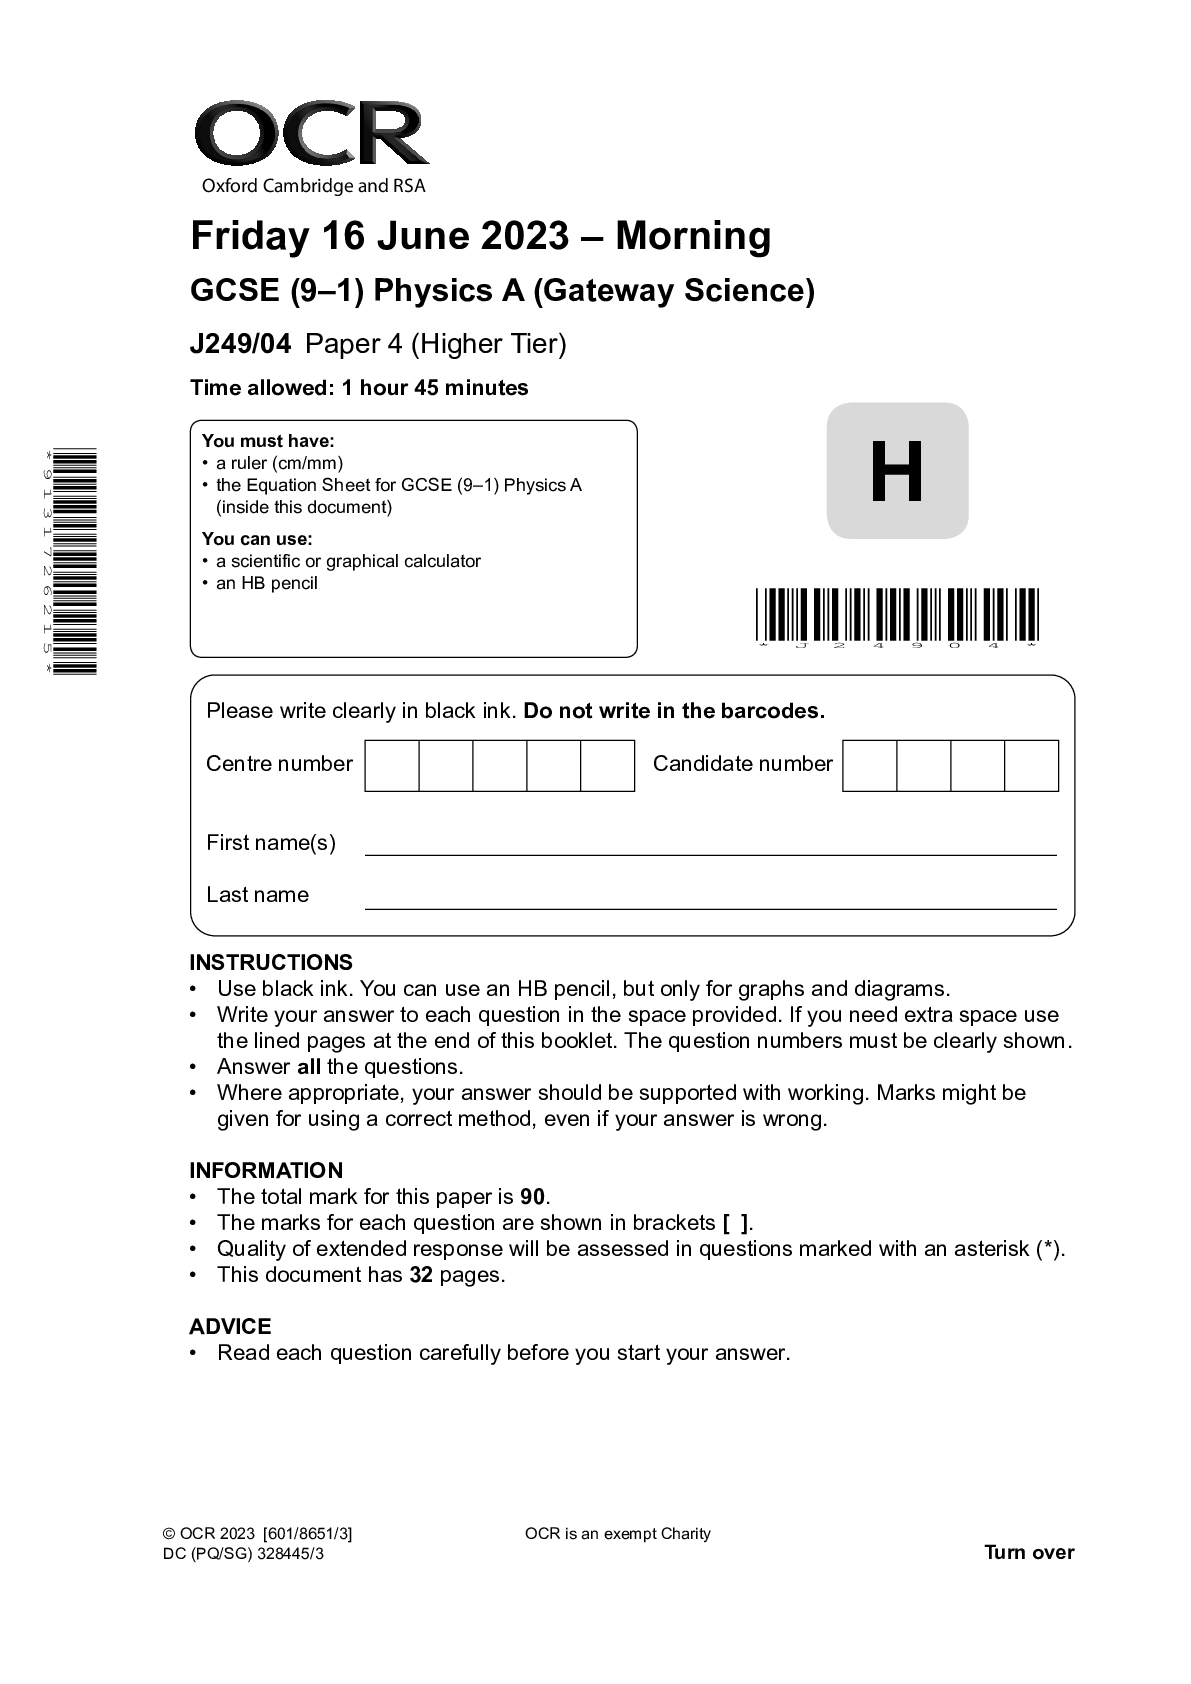
GCSE (9–1) Physics A (Gateway Science) J249/04 Paper 4 (Higher Tier) June 2023 QP
$ 4

A Level History A_Y112/01 Question Paper Nov 2020 | Britain 1900 - 1951
$ 6.5
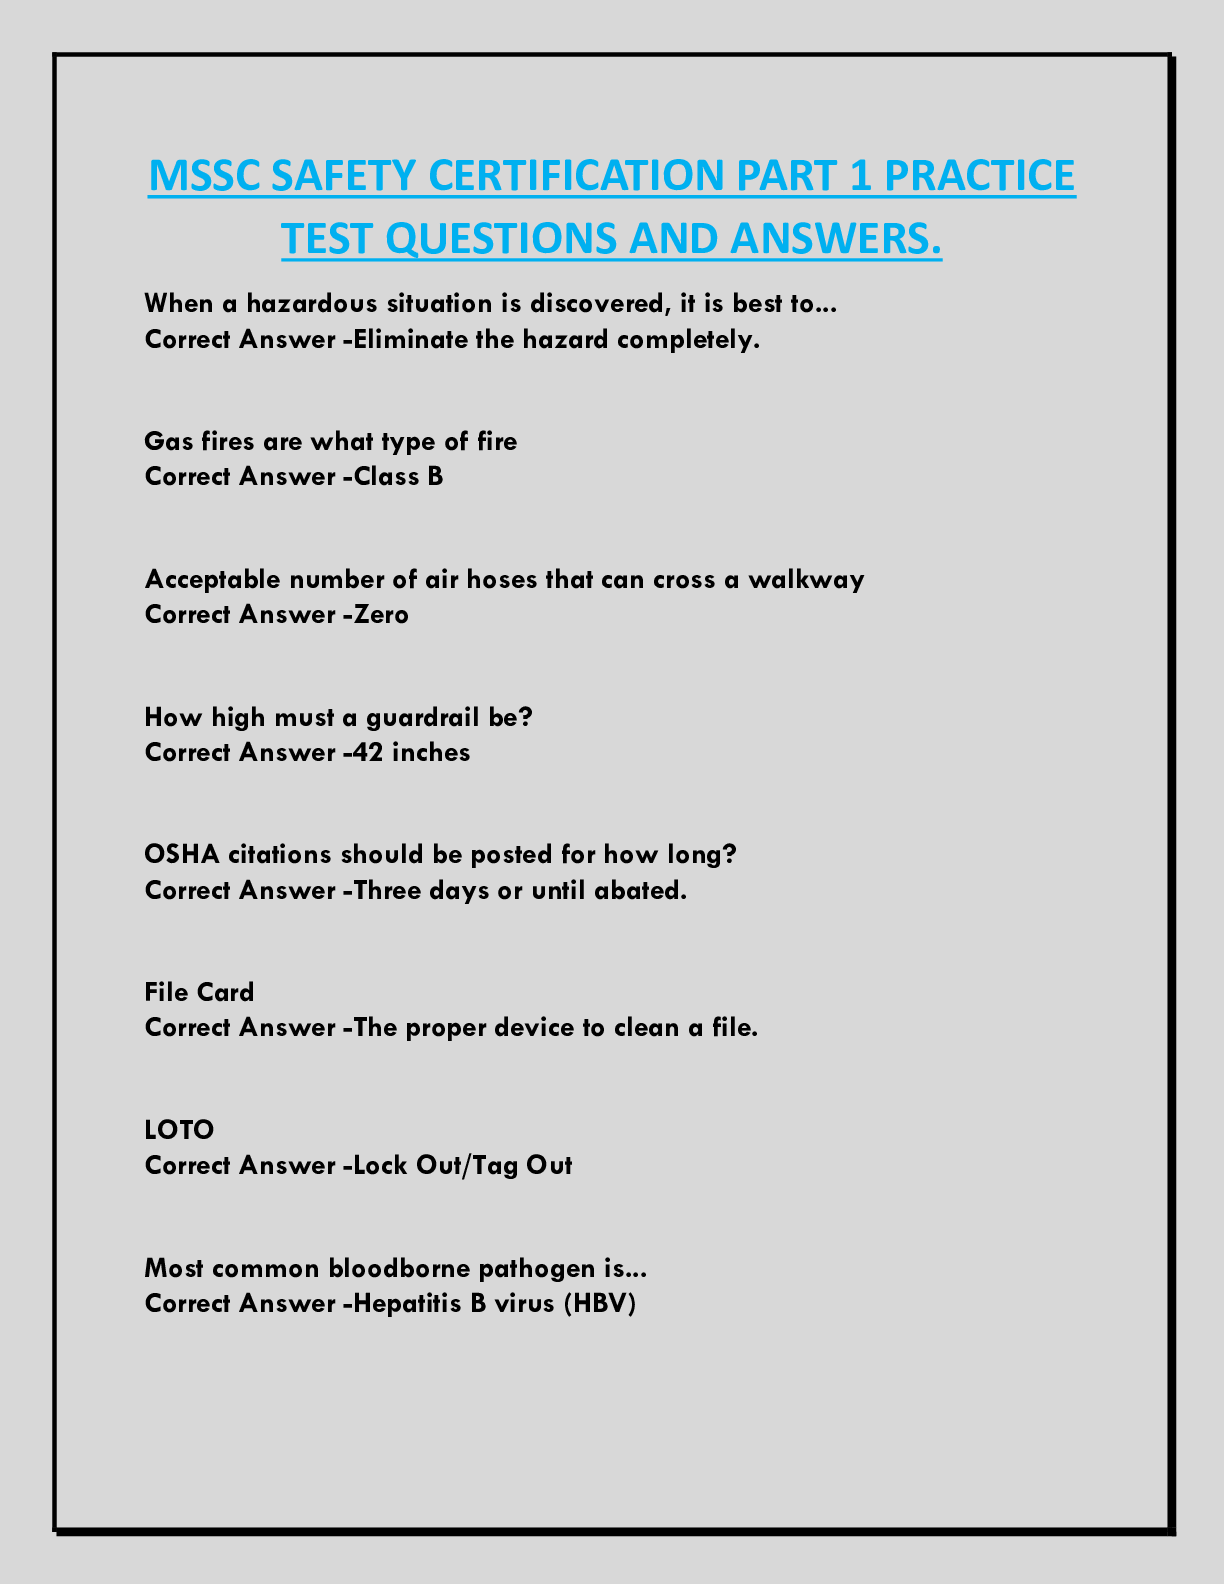
MSSC SAFETY CERTIFICATION PART 1 PRACTICE TEST QUESTIONS AND ANSWERS.
$ 13
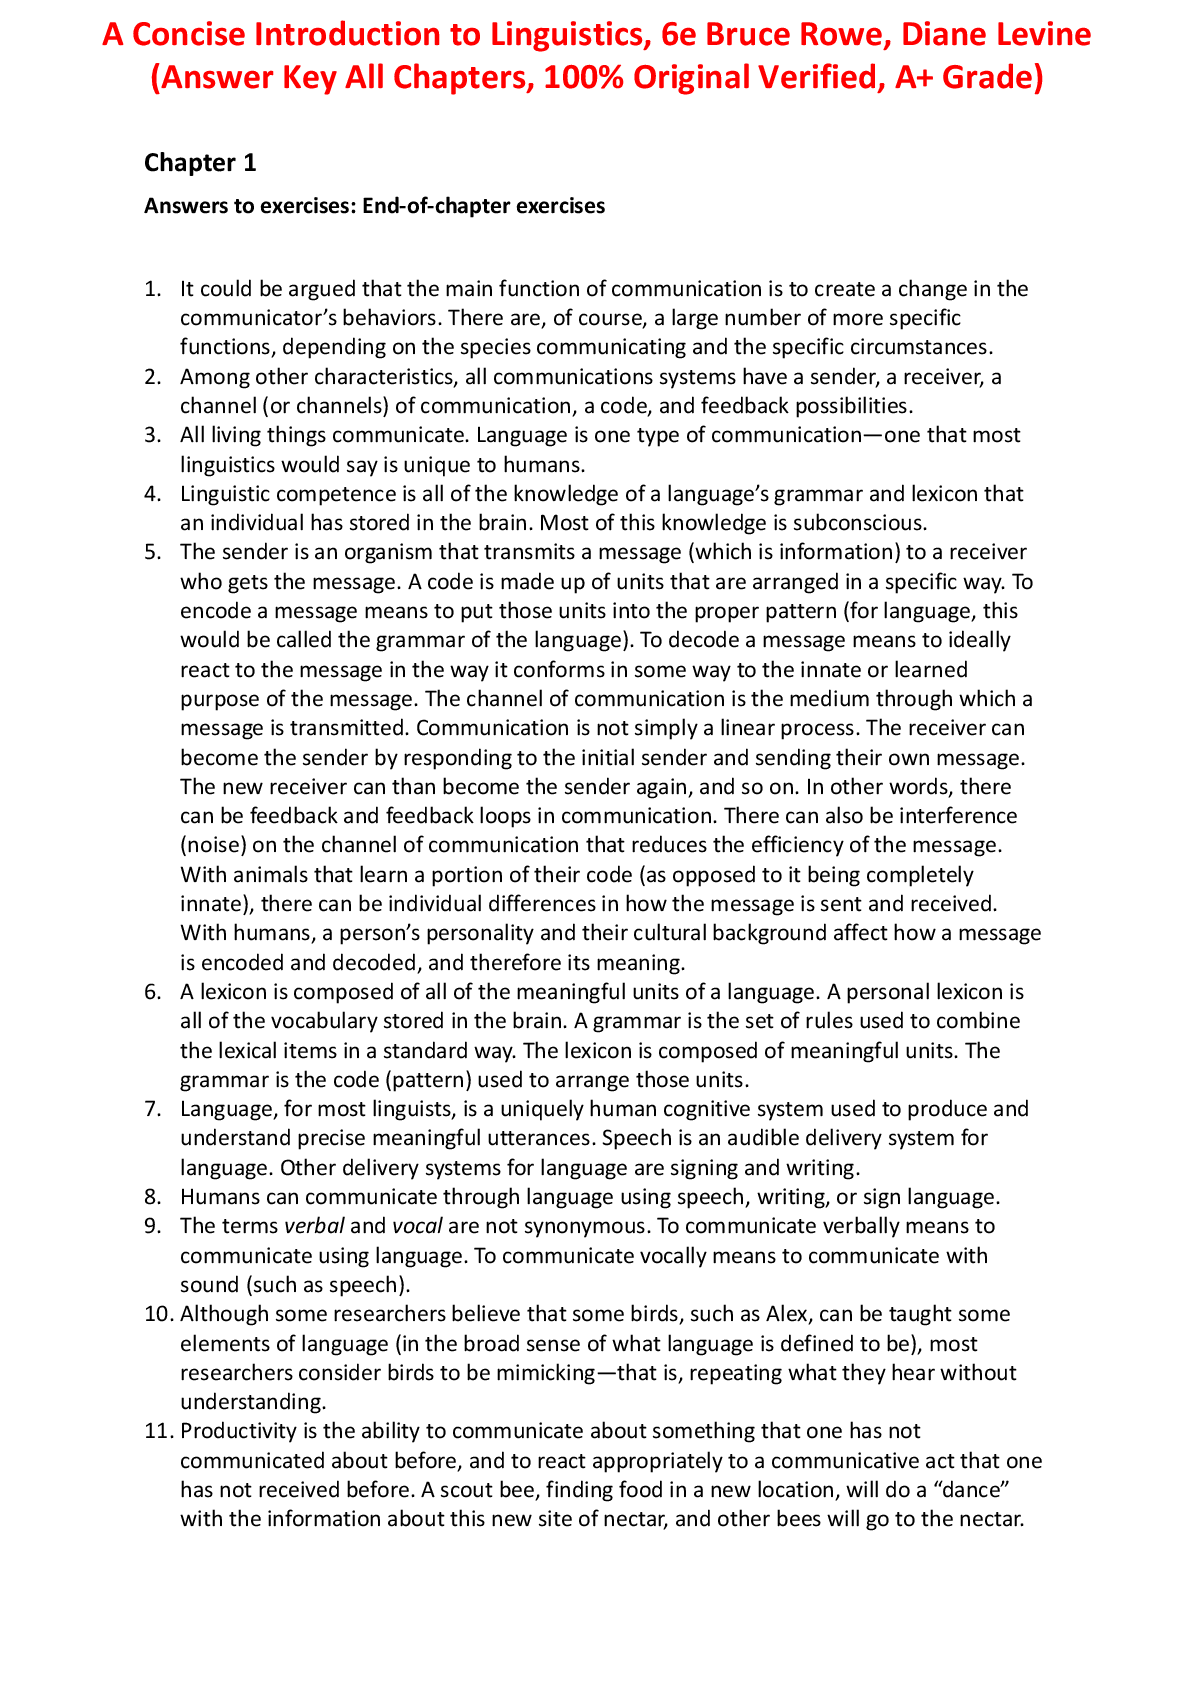
A Concise Introduction to Linguistics, 6e Bruce Rowe, Diane Levine
$ 13

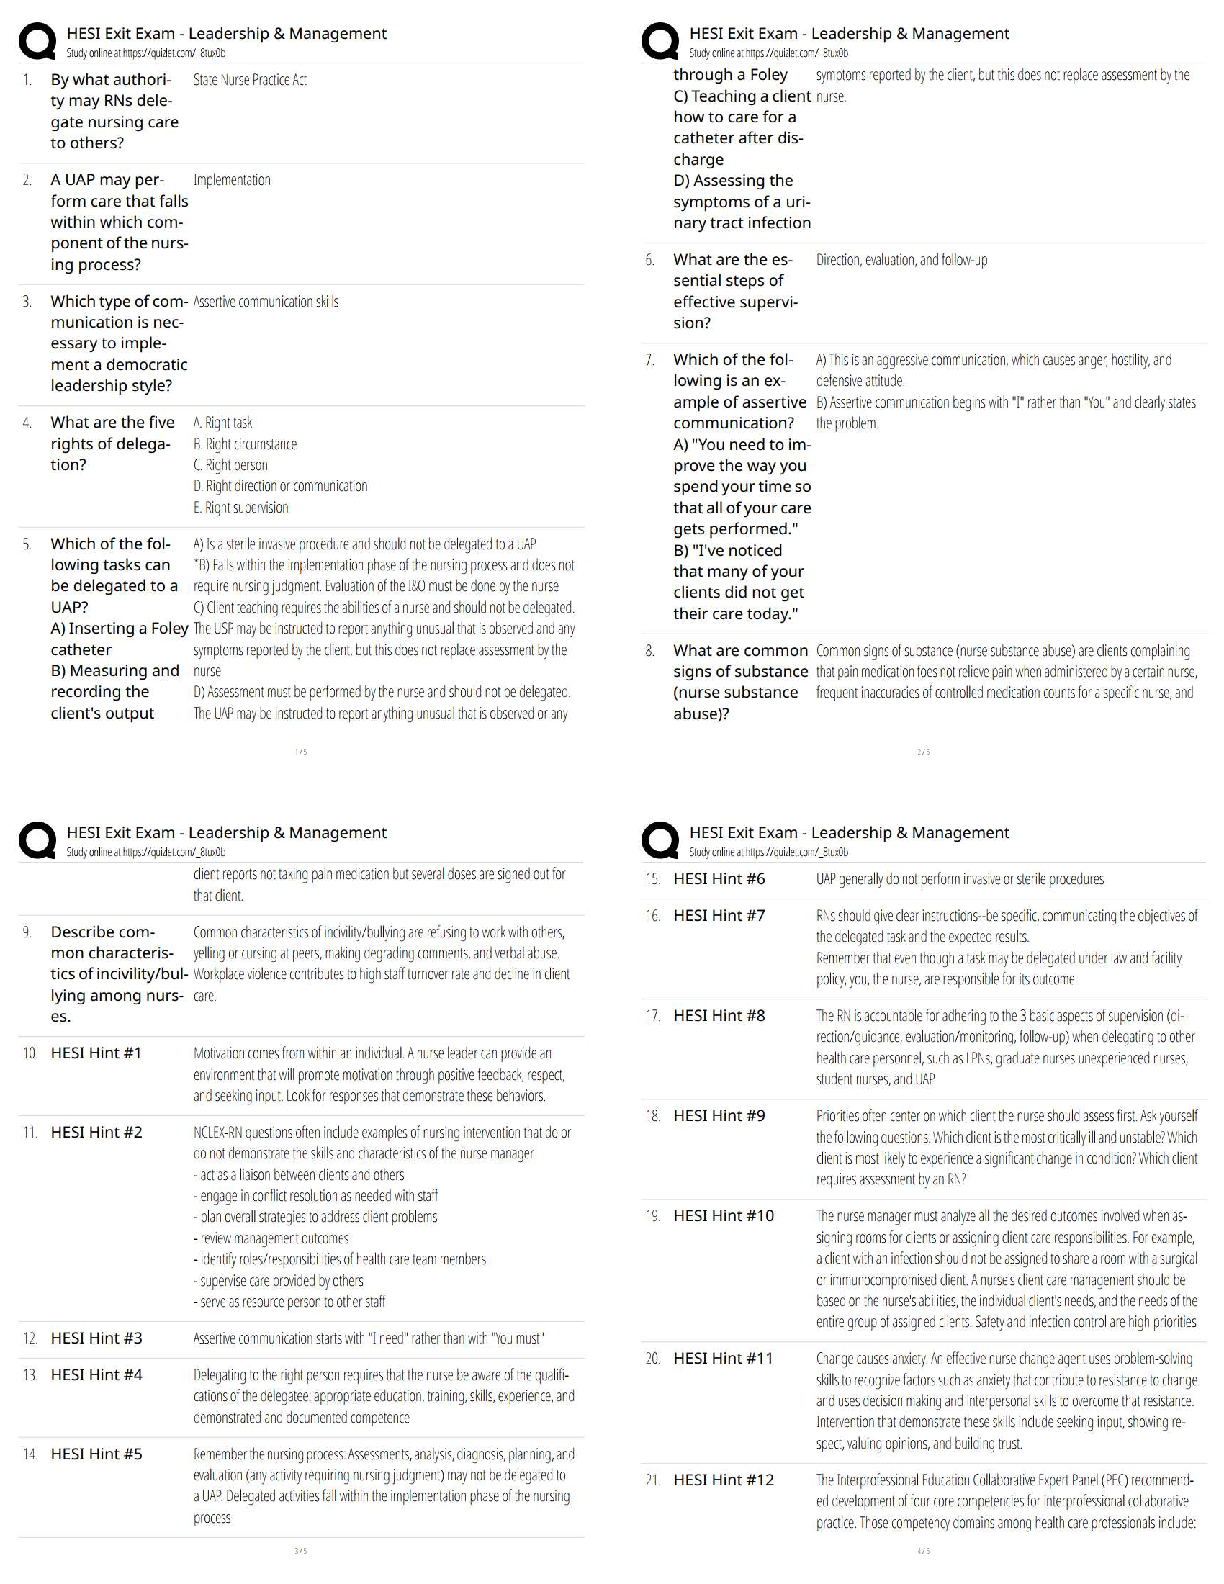
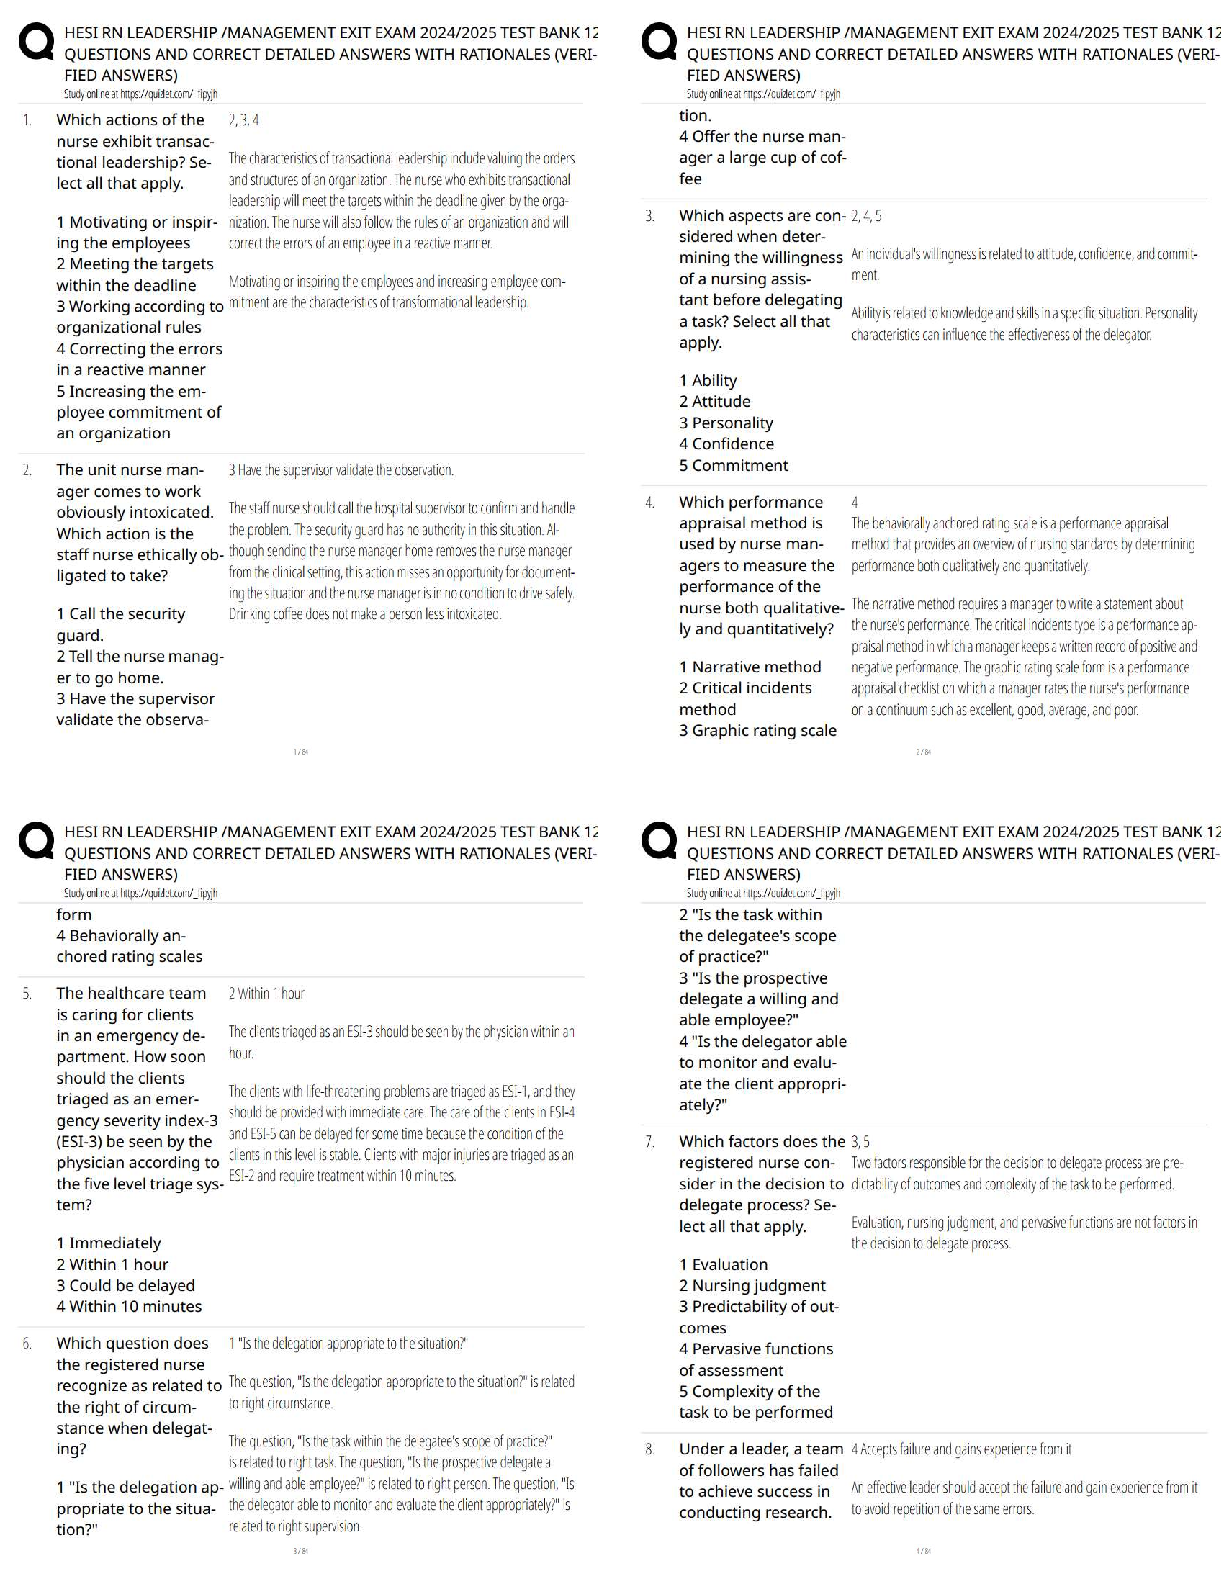
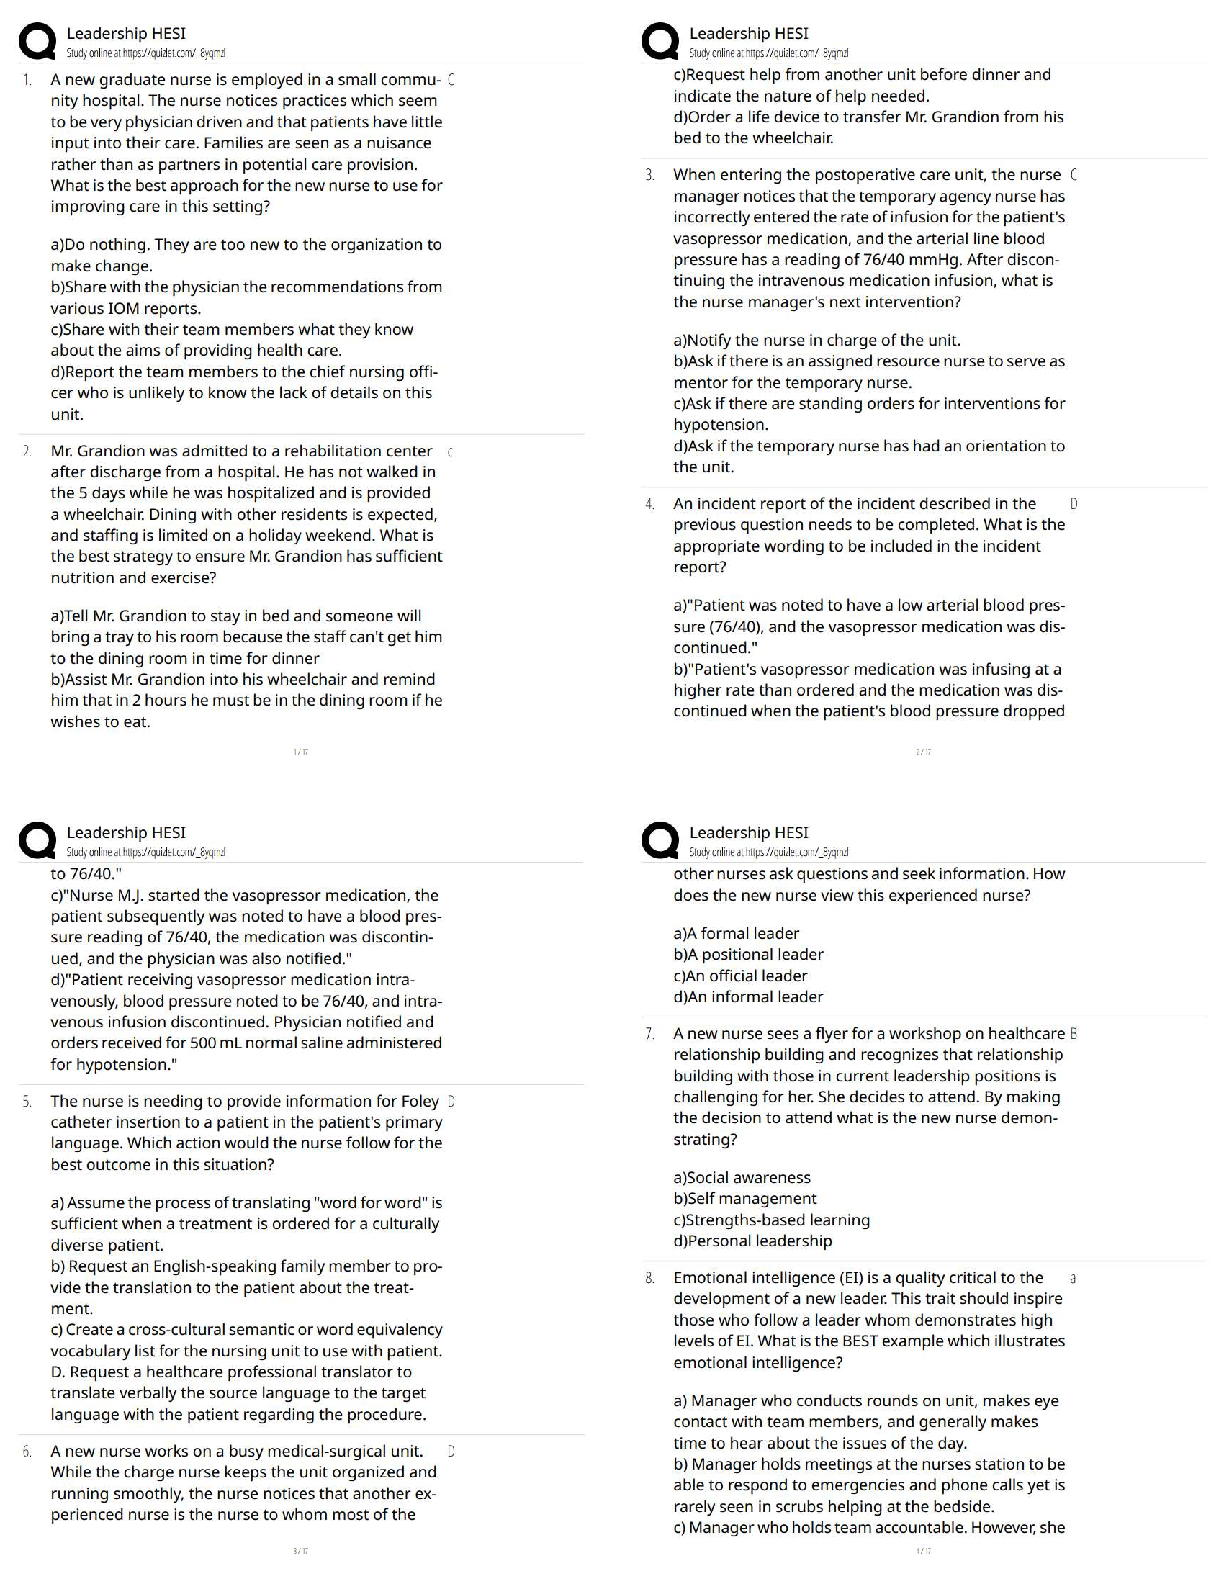
HESI EXIT EXAM WITH VERIFIED ANSWERS WITH RATIONALES AND,COMPETE GUIDE FOR EXAM PREPARATIONS
$ 14

Edexcel as level history question paper 2h 1 2 june 2023+ mark scheme
$ 8
.png)
WGU C100 Humanities Final Study Guide
$ 10
AC 313 INTERMEDIATE ACCOUNTING I REVIEW EXAM Q & A 2024
$ 14
Risk Management And Insurance 12th Edition By Trieschmann, Hoyt, Sommer TEST BANK
$ 23
Edexcel as level physics question paper 2 june 2023 + mark scheme
$ 8
HSCO 506 DB2 WITH REPLY
$ 7

NYSTCE Multi-Subject CST: Part 3, Arts And Sciences 100% Verified