[Solved] Bus 495 Quiz 3
Quiz Submissions - Quiz 3
Top of Form
Delmi Funez (username: DFUNEZ)
Attempt 1
Written: Sep 14, 2018 8:13 PM - Sep 14, 2018 9:43 PM
Submission View
Your quiz has been sub
...
[Solved] Bus 495 Quiz 3
Quiz Submissions - Quiz 3
Top of Form
Delmi Funez (username: DFUNEZ)
Attempt 1
Written: Sep 14, 2018 8:13 PM - Sep 14, 2018 9:43 PM
Submission View
Your quiz has been submitted successfully.
Quiz 3
Set aside 150 minutes to take the quiz. At 155 minutes the quiz will shut down as there is no opportunity to go beyond this time period. If students enter the quiz and fail to complete it, there is no opportunity to retake the quiz.
Question 1
0.5 / 0.5 points
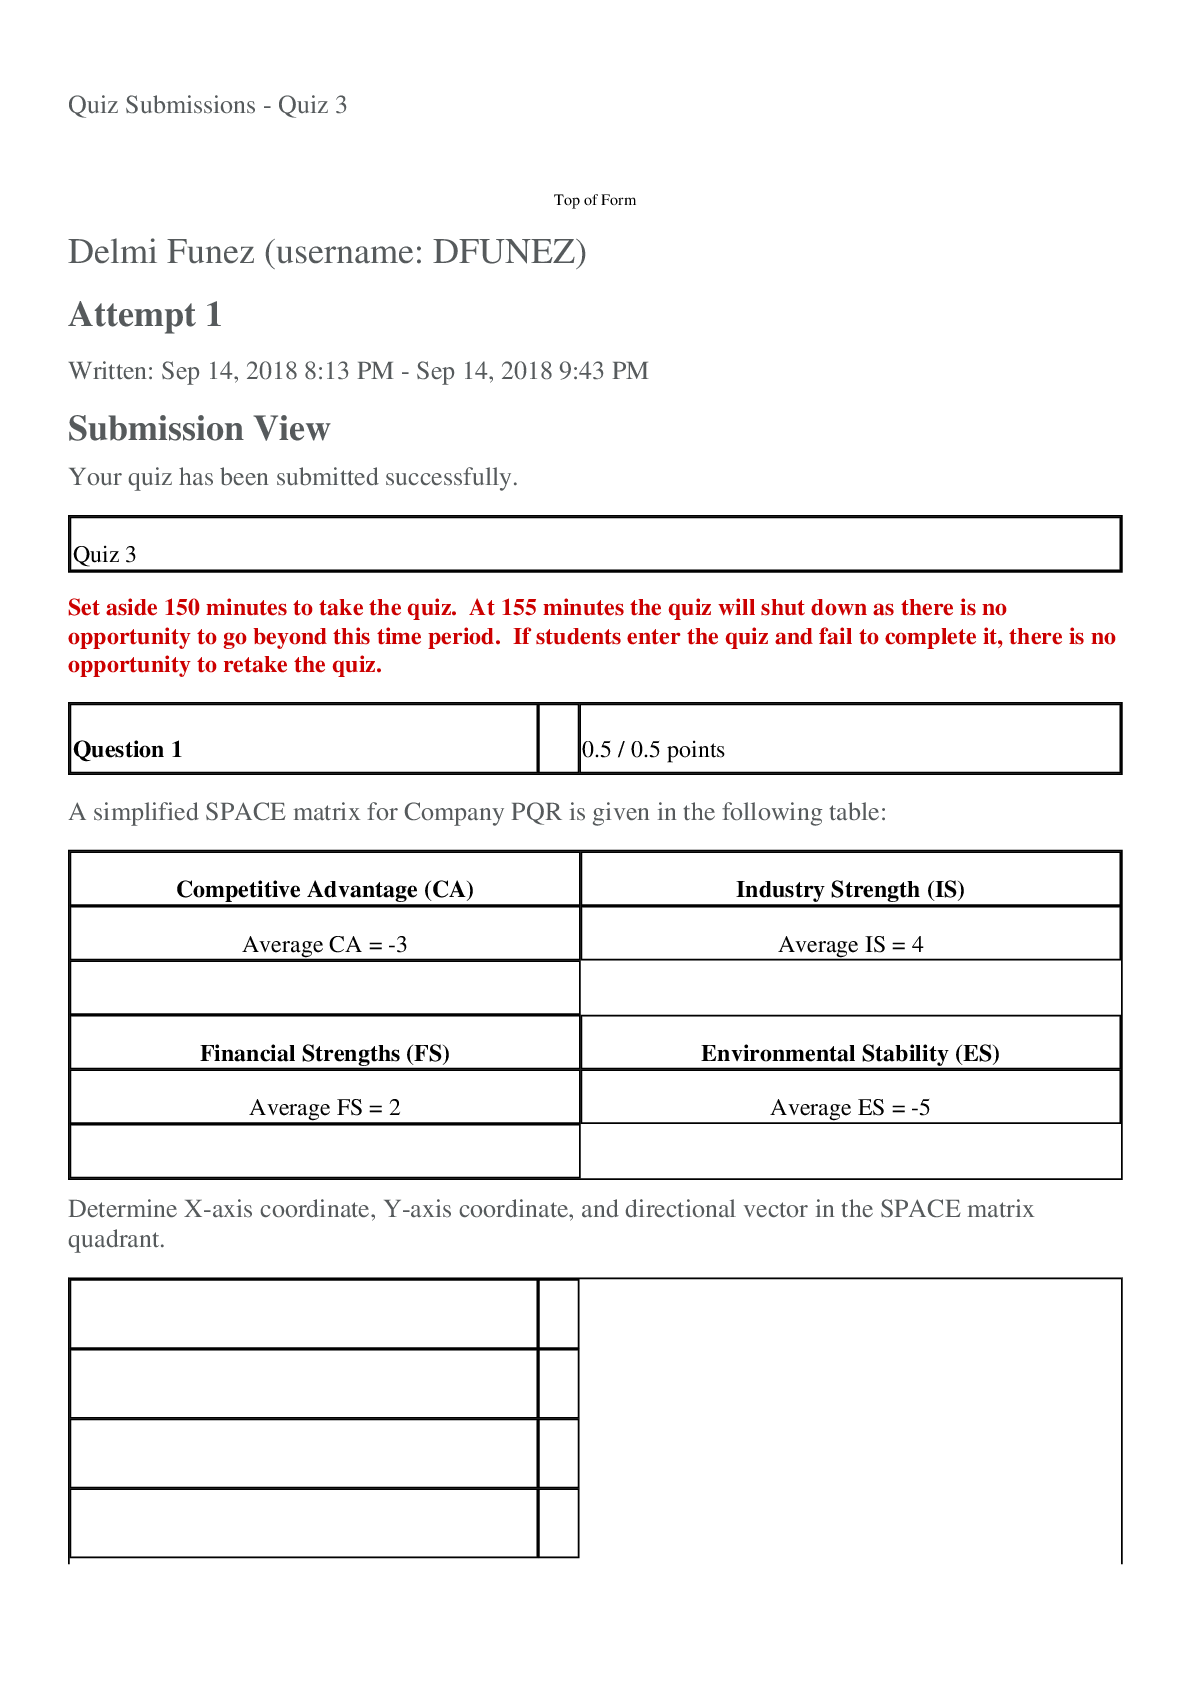
A simplified SPACE matrix for Company PQR is given in the following table:
Competitive Advantage (CA)
Industry Strength (IS)
Average CA = -3
Average IS = 4
Financial Strengths (FS)
Environmental Stability (ES)
Average FS = 2
Average ES = -5
Determine X-axis coordinate, Y-axis coordinate, and directional vector in the SPACE matrix quadrant.
A)
X-axis coordinate = 0.5; y-axis coordinate = 1 ; Vector in Aggressive quadrant
B)
X-axis coordinate = -1; y-axis coordinate = 1 ; Vector in Conservative quadrant
C)
X-axis coordinate = -3 ; y-axis coordinate = 1; Vector in Competitive quadrant
D)
X-axis coordinate = 1; y-axis coordinate = -3; Vector in Competitive quadrant
Question 2
0.5 / 0.5 points
Financial Strength (FS) factors and Competitive Advantage (CA) factors are ___________ factors in a SPACE matrix, whereas Environmental Stability (ES) factors and Industry Strength (IS) factors are ________________ factors in a SPACE matrix.
A)
External, external
B)
External, internal
C)
Internal, external
D)
Internal, internal
Question 3
0.5 / 0.5 points
SPACE matrix is the acronym for:
A)
Statistical Process and Analytic Evaluation matrix
B)
Strategic Position and Action Evaluation matrix
C)
Scientific Process and Artistic Evaluation matrix
D)
Streaming Procedure and Assessment Evaluation matrix
Question 4
0 / 0.5 points
Company PQS has 5 product lines E, F, G, H and K. The industry growth rates of these product lines are given in the table. Assume that the growth rate of 8% is used as the base line in BCG analysis. Determine the industry growth rate relative to the baseline growth rate.
Product lines
Industry growth rate
Industry growth rate relative to base-line growth rate: Below or above
Product line E
5%
Product line F
12%
Product line G
9%
Product line H
13%
Product line K
7%
A)
Below, below, below, above, below
B)
Below, below, above, above, below
C)
Below, above, above, above, below
D)
Below, above, below, above, below
Question 5
0 / 0.5 points
A hunting accessory company, ABC has the product line xyz with a relative market share of 0.15. Assume that the industry growth rate is 5%. The strategic planner intends to evaluate the product line using a BCG. The strategic planner assumes the base-line growth rate is at 3%, and the medium market share is 0.5 in that industry.
In the BCG matrix for hunting accessory industry, product line xyz is located in the quadrant of __________.
A)
Dog
B)
Star
C)
Question mark
D)
Cash cow
Question 6
0 / 0.5 points
An electronic appliance company, EFG has 4 product lines with the relative market shares and industry growth rate given in the following table. The assumptions made by the strategic planner are: Base-line growth rate is at 5%, and the medium market share is set at 0.5 in the BCG matrix.
Determine the respective quadrants in the BCG analysis for these product lines.
Product lines
Relative market share
Industry growth rate
BCG quadrant
Product line 1
0.45
6%
Product line 2
0.65
4%
Product line 3
0.7
10%
Product line 4
0.3
2%
A)
Cash cow, question market, dog, star
B)
Question mark, star, cash cow, dog
C)
Question mark, cash cow, star, dog
D)
Dog, star, cash cow, question mark
Question 7
0 / 0.5 points
The strategic researcher uses the value of 0.5 to determine the medium level of the relative market share. Determine the quadrants in the BCG for the product lines (1), (2), (3) and (4) in their respective BCG matrices.
Product line
Expected revenues
Company NPQ relative market share
Industry growth rate
Base-line growth line
Quadrant in respective BCG matrix
Company NPQ
Largest competitor
Product line (1)
$15,000
$32,000
0.47
12%
10.00%
Product line (2)
$40,000
$45,000
0.89
8%
5.00%
Product line (3)
$38,000
$40,000
0.95
7%
10.00%
Product line (4)
$14,000
$32,000
0.44
6%
7.00%
A)
Product line (3): Cash cow, and product line (4) Dog
B)
Product line (3) and product line (4): Dogs
C)
Product line (2) and product line (3): cash cow
D)
Product line (1): Star
Question 8
0.5 / 0.5 points
The following table is a partial SPACE matrix. Determine the average (FS), the average (ES), and coordinate for the Y axis.
Financial Strengths (FS)
Environmental Stability (ES)
Return on equity
3
Technological changes
-5
Liquidity ratios
2
Inflation rate
-2
Cash flow
3
Price elasticity of demand
-3
Inventory turnover
4
Risk involved in business
-4
Average of FS
Average of ES
Sum for Y axis coordinate:
A)
Average FS = 3; Average ES = -3.5; Sum for Y axis = -0.5
B)
Average FS = 3; Average ES = -2; Sum for Y axis = 1
C)
Average FS = -1 ; Average ES = 2; Sum for Y axis = 1
D)
Average FS = 2; Average ES = -2.5; Sum for Y axis = -0.5
Question 9
0 / 0.5 points
Factors that can be classified as "Industry strengths" factors in a SPACE matrix may include:
A)
Inventory turnover ratios, barriers to entry, productivity, labor force utilization
B)
Capacity utilization, inventory turnover ratios, product life cycle, leverage ratios
C)
Resource utilization, capacity utilization, ease of entry into market, growth potential
D)
Inventory turnover ratios, product life cycle, growth potential, barriers to entry
Question 10
0.5 / 0.5 points
Company XYZ that manufactures TV's has three key competitors and a group of relatively small competitors in that industry.
Per BCG matrix conceptual requirements, what are the relative market shares of Company XYZ, ABC, DEF, GHK and remaining group of companies?
Companies
Market share
Relative market share per BCG conceptual requirement
Company XYZ
15%
Company ABC
23%
Company DEF
25%
Company GHK
28%
Remaining group of companies
9%
Total
100%
A)
0.54; 0.82; 0.87; 1.25; 0.30
B)
0.54; 0.82; 0.89; 1.12; 0.32
C)
0.54; 0.80; 0.91; 1.03; 0.32
D)
0.60; 0.82; 0.88, 1.2; 0.32
Question 11
0.5 / 0.5 points
Factors that can be classified as "Competitive advantage" factors in a SPACE matrix may include:
A)
Market share, product quality, product life cycle, control over suppliers
B)
Product quality, ease of entry into market, risk involved in business, technological change
C)
Market share, price elasticity of demand, risk involved in business, liquidity ratios
D)
Product quality, product life cycle, risk involved in business, rate of inflation
Question 12
0.5 / 0.5 points
Company ABC has 5 product lines M, N, Q, R and S. The industry growth rates for each of these product lines are given in the table below. Assume a growth rate of 10% is used as the base line in a BCG analysis. Determine the industry growth rate relative to the baseline growth rate.
Product lines
Industry growth rate
Industry growth rate relative to base-line growth rate: Below or above
Product line M
3%
Product line N
12%
Product line Q
6%
Product line R
15%
Product line S
20%
A)
Above; below; above; above; below
B)
Below; above; below; above; above
C)
Below; above; above; above; below
D)
Below; below; above; below; above
Question 13
0 / 0.5 points
Company X has 4 key competitors and a group of relatively small competitors in the steel industry. The revenues of the companies in the steel industry are given in the following table.
Companies
Corporate revenues
Relative market share per BCG conceptual requirement
Company XYZ
$150,000
Company ABC
$200,000
Company DEF
$180,000
Company GHK
$170,000
Remaining companies in the steel industry
$100,000
Total
$800,000
A)
0.75; 1.11; 0.90; 0.85; 0.50
B)
0.75; 0.90; 0.98; 0.82; 0.65
C)
0.06; 0.25; 0.22; 0.21; 0.12
D)
0.72; 0.90; 0.85; 0.80; 0.45
Question 14
0.5 / 0.5 points
The following table is a partial SPACE matrix. Determine the average (CA), the average (IS) and coordinate on the X axis.
Internal Strategic Position
External Strategic Position
Competitive Advantage (CA)
Industry Strength (IS)
Product quality
-1
Growth potential
3
Market share
-3
Profit potential
4
Product life cycle
-2
Capacity utilization
2
Control over suppliers
-2
Barriers to entry into market
3
Average of CA
Average of IS
Sum for X axis coordinate:
A)
Average of CA = + 2; Average of IS = -4; Sum for X axis coordinate = 2
B)
Average of CA = - 2 ; Average of IS = 3; sum for X axis coordinate = 1
C)
Average of CA = +3; Average of IS = - 2; Sum for X axis coordinate = 1
D)
Average of CA = -4 ; Average of IS = 3 ; sum for X axis coordinate = -1
Question 15
0 / 0.5 points
Company NPQ has 4 product lines in the industry. The following data is found in the corporate reports and the expected growth is based on the corporate forecast. The strategic planner at Company NPQ is tasked to prepare the BCG matrix in the appropriate quadrants to illustrate the relative positioning of the product lines.
Determine the expected revenues of these product lines for the NPQ and that of its largest competitor so that you can help the strategic planner to predict:
Product line
Last year's revenues
Expected growth rate in revenue
Expected revenues
Company NPQ
Largest competitor
Company NPQ
Largest competitor
Company NPQ
Largest competitor
Product line (1)
$200,000
$250,000
10%
12%
Product line (2)
$150,000
$160,000
8%
7%
Product line (3)
$120,000
$100,000
5%
10%
Product line (4)
$80,000
$85,000
6%
5%
A)
Expected revenues of Product (4): Company NPQ = $84,000; Largest competitor = $89,000
B)
Expected revenues of Product (3): Company NPQ = $125,000; Largest competitor = $110,000
C)
Expected revenues of Product (1): Company NPQ = $210,000; Largest competitor = $300,000
D)
Expected revenues of Product (2): Company NPQ = $162,000; Largest competitor = $171,000
Question 16
0 / 0.5 points
The combined values of Financial Strengths (FS) factors and Environmental Stability (ES) factors are used to determine the coordinates on the ______________ axis, while the combined values of Competitive Advantage (CA) factors and Industry Strength (IS) factors are used to determine the coordinates on the ______________ axis.
A)
Y axis (also known as horizontal axis), X axis (also known as vertical axis)
B)
X axis (also known as vertical axis), Y axis (also known as horizontal axis)
C)
X axis (also known as horizontal axis), Y axis (also known as vertical axis)
D)
Y axis (also known as vertical axis), X axis (also known as horizontal axis)
Question 17
0.5 / 0.5 points
Factors that can be classified as "Environmental stability" factors in a SPACE matrix may include:
A)
Technological change, working capital, corporate market share, profit potential
B)
Technological change, demand variability, leverage ratios, product quality
C)
Inflation, technological change, demand variability, price elasticity of demand
D)
Inflation, taxation, barriers to entry, return on investment
Question 18
0.5 / 0.5 points
Financial Strength (FS) factors and Industry Strength (IS) factors are assigned using ____________ values in a SPACE matrix, while Competitive Advantage (CA) factors and Environmental Stability (ES) factors are assigned using ___________ values.
A)
Negative, positive
B)
Negative, negative
C)
Positive, negative
D)
Positive, positive
Question 19
0.5 / 0.5 points
Factors that can be classified as "Financial strengths" factors in a SPACE matrix may include:
A)
Return on assets, customer loyalty, technological change, cash flow
B)
Return on assets, working capital, cash flow, leverage ratios
C)
Return on investment, working capital, technological change, product quality
D)
Leverage ratios, inventory turnover ratios, working capital, product life cycle
Question 20
0 / 0.5 points
A SPACE matrix is a ____________ analytic tool whereas SWOT analysis is a ____________ analytic tool.
A)
Quantum; qualitative
B)
Quantitative; quantitative
C)
Quantitative; qualitative
D)
Qualitative; quantitative
Bottom of Form
[Show More]


.png)