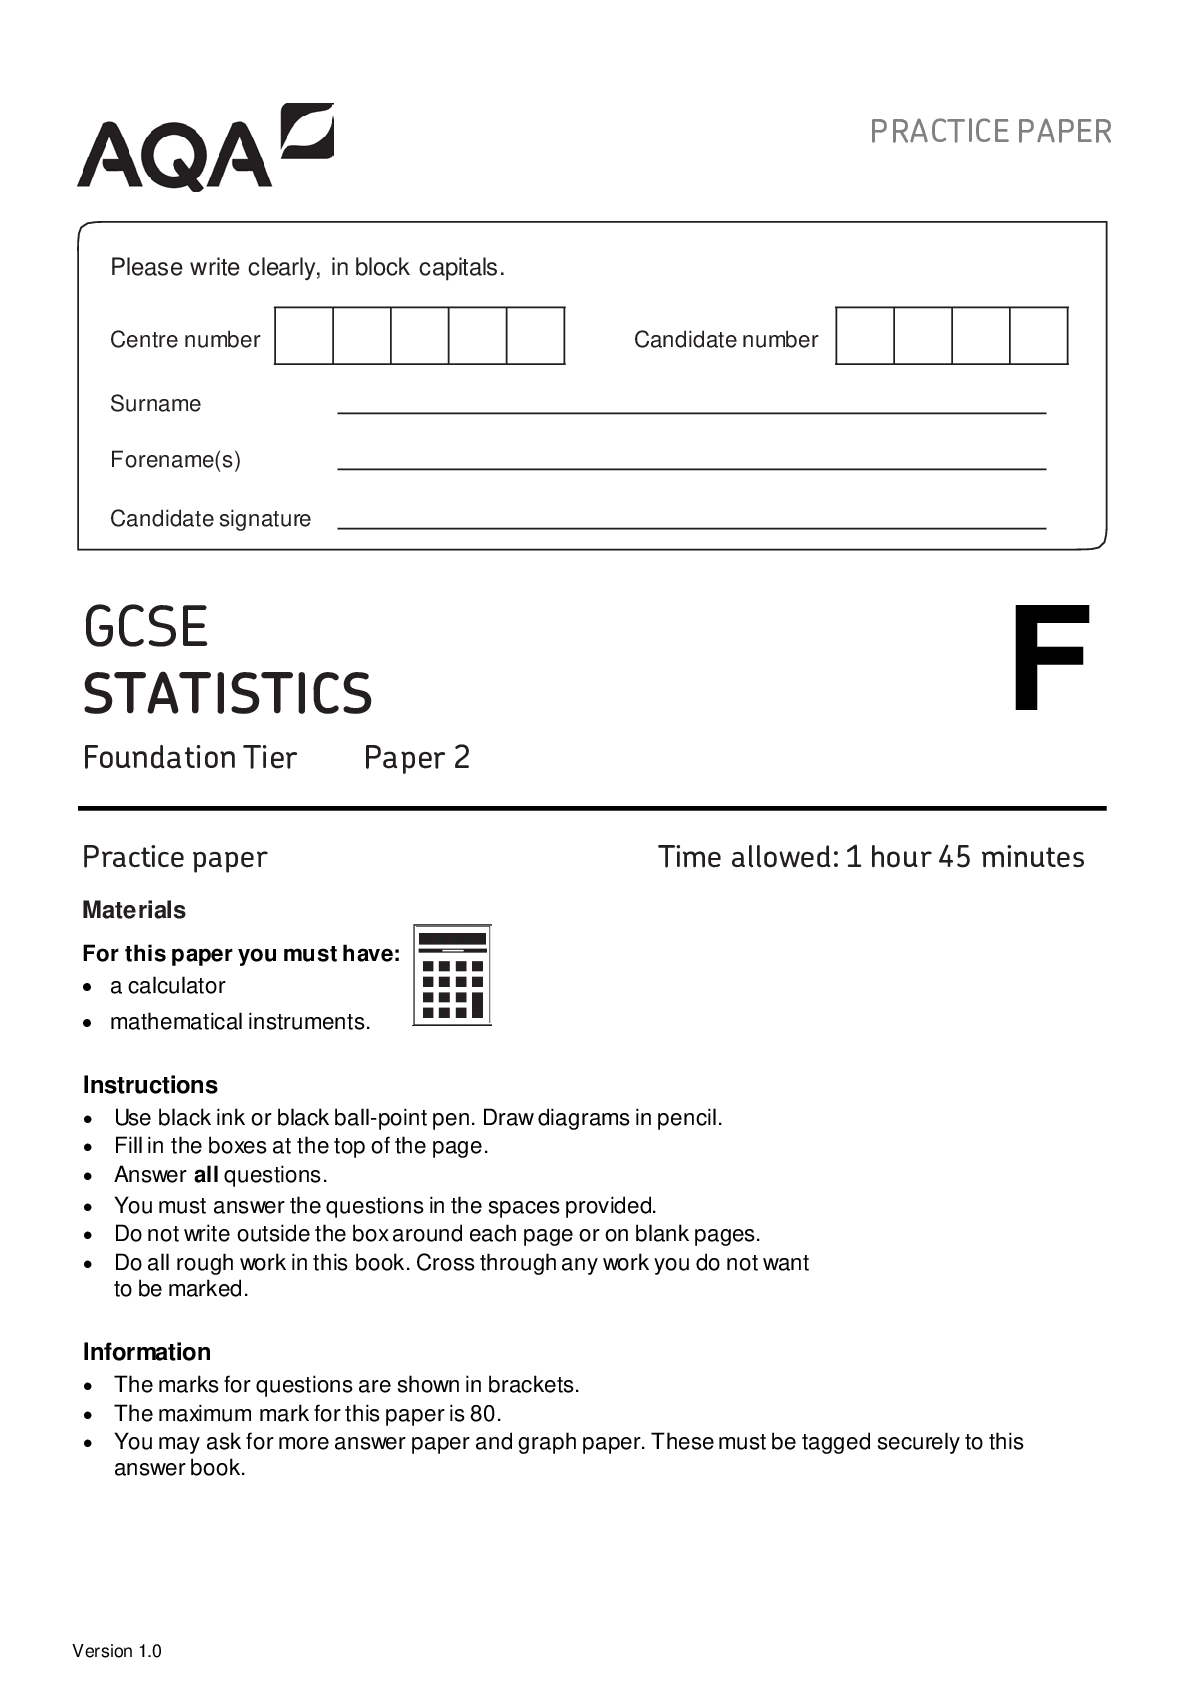
GCSE
STATISTICS
Foundation Tier Paper 2
Practice paper Time allowed: 1 hour 45 minutes
Materials
Instructions
• Use black ink or black ball-point pen. Draw diagrams in pencil.
• Fill in the boxes at the top of th
...
GCSE
STATISTICS
Foundation Tier Paper 2
Practice paper Time allowed: 1 hour 45 minutes
Materials
Instructions
• Use black ink or black ball-point pen. Draw diagrams in pencil.
• Fill in the boxes at the top of the page.
• Answer all questions.
• You must answer the questions in the spaces provided.
• Do not write outside the box around each page or on blank pages.
• Do all rough work in this book. Cross through any work you do not want
to be marked.
Information
• The marks for questions are shown in brackets.
• The maximum mark for this paper is 80.
• You may ask for more answer paper and graph paper. These must be tagged securely to this
answer book.
For this paper you must have:
• a calculator
• mathematical instruments.
PRACTICE PAPER
Please write clearly, in block capitals.
Centre number Candidate number
Surname
Forename(s)
Candidate signature
F
Version 1.0
2
Do not write
outside the
Answer box all questions in the spaces provided.
1 Marion is the fashion designer for a major high street clothes retailer.
She wants to contact a random sample of the retailer’s stores throughout the UK to
find out how the latest range of her clothes is selling.
State the population for her survey.
Tick one box.
[1 mark]
All the stores she samples
All the clothes in the stores
The number of stores she samples
All the retailer’s stores
2 Which two of these values cannot represent a probability?
Circle your answers.
[1 mark]
–0.3 0.187 5
6
1.1
8382/2F
3
Do not write
outside the
3 A population list of 1000 items is to be sampled. box
Every 20th item in the list will be in the sample.
3 (a) What is the name of this sampling method?
Circle your answer.
[1 mark]
Judgement Quota Random Systematic
3 (b) How many of the items will be in the sample?
Circle your answer.
[1 mark]
5 20 50 200
Turn over for the next question
Practice paper Version 1.0 Turn over
4
Do not write
outside the
4 box The table shows the reigns of the monarchs (kings and queens) of the House of Hanover.
Monarch Years reigning
George I 1714 – 1727
George II 1727 – 1760
George III 1760 – 1820
George IV 1820 – 1830
William IV 1830 – 1837
Victoria 1837 – 1901
4 (a) Who was the monarch in 1800?
[1 mark]
Answer
4 (b) Which monarch from the House of Hanover reigned for longest?
Give how many years they reigned for.
[2 marks]
Answer for years
8382/2F
5
Do not write
outside the
4 box (c) Circle the type of correlation, if any, you would expect between ‘the number of years a
monarch reigned’ and ‘the age at which the monarch died’.
[1 mark]
Negative correlation No correlation Positive correlation
4 (d) Sally must choose, at random, one of the monarchs in the House of Hanover to study for a
history project.
Sally says,
“There are 5 kings and 1 queen in the House of Hanover. If I choose one year at
random from 1714 – 1901 and choose the monarch reigning, the chance I will get
Queen Victoria is 1
6
.”
Comment on Sally’s claim.
[2 marks]
Turn over for the next question
Practice paper Version 1.0 Turn over
6
Do not write
outside the
5 200 teenage girls are asked to choose their favoured method of communicating. box
The percentage bar chart shows the results.
5 (a) What percentage of girls chose a phone call?
[1 mark]
Answer
5 (b) How many of the 200 girls in the sample chose texting?
[3 marks]
Answer
8382/2F
7
Do not write
outside the
5 (c) 400 teenage boys were also asked about their favoured method of communicating. box
The number for each method is in the table.
Draw a percentage bar chart for the boys’ data using the scale below.
[4 marks]
Question 5 continues on the next page
Method Number of boys
Face to face 200
Phone call 100
Texting 50
Social media
messaging 50
Practice paper Version 1.0 Turn over
8
Do not write
outside the
5 box (d) Make two comments comparing teenage boys with teenage girls for their favoured
method of communicating.
[2 marks]
Comment 1:
Comment 2:
5 (e) Are your comments in part (d) likely to be true when comparing the favoured methods
of communication among retired males and retired females?
Give a reason for your answer.
[1 mark]
8382/2F
9
Do not write
outside the
6 Waylon drives to work on 225 days per year. box
He believes it takes him longer to get to work on colder days.
6 (a) State Waylon’s belief as a hypothesis that could be tested.
[1 mark]
6 (b) Name the independent variable and dependent variable in this context.
[2 marks]
Independent variable:
Dependent variable:
Question 6 continues on the next page
Practice paper Version 1.0 Turn over
10
Do not write
outside the
6 (c) Waylon considers two methods to collect data he would need to test his hypothesis. box
Method 1 collect data the next 10 times he remembers to do it
Method 2 obtain a random sample of 10 days’ data in the next year
6 (c)(i) Name the sampling method described in Method 1.
[1 mark]
Answer
6 (c)(ii)Outline how he could carry out Method 2.
[Show More]