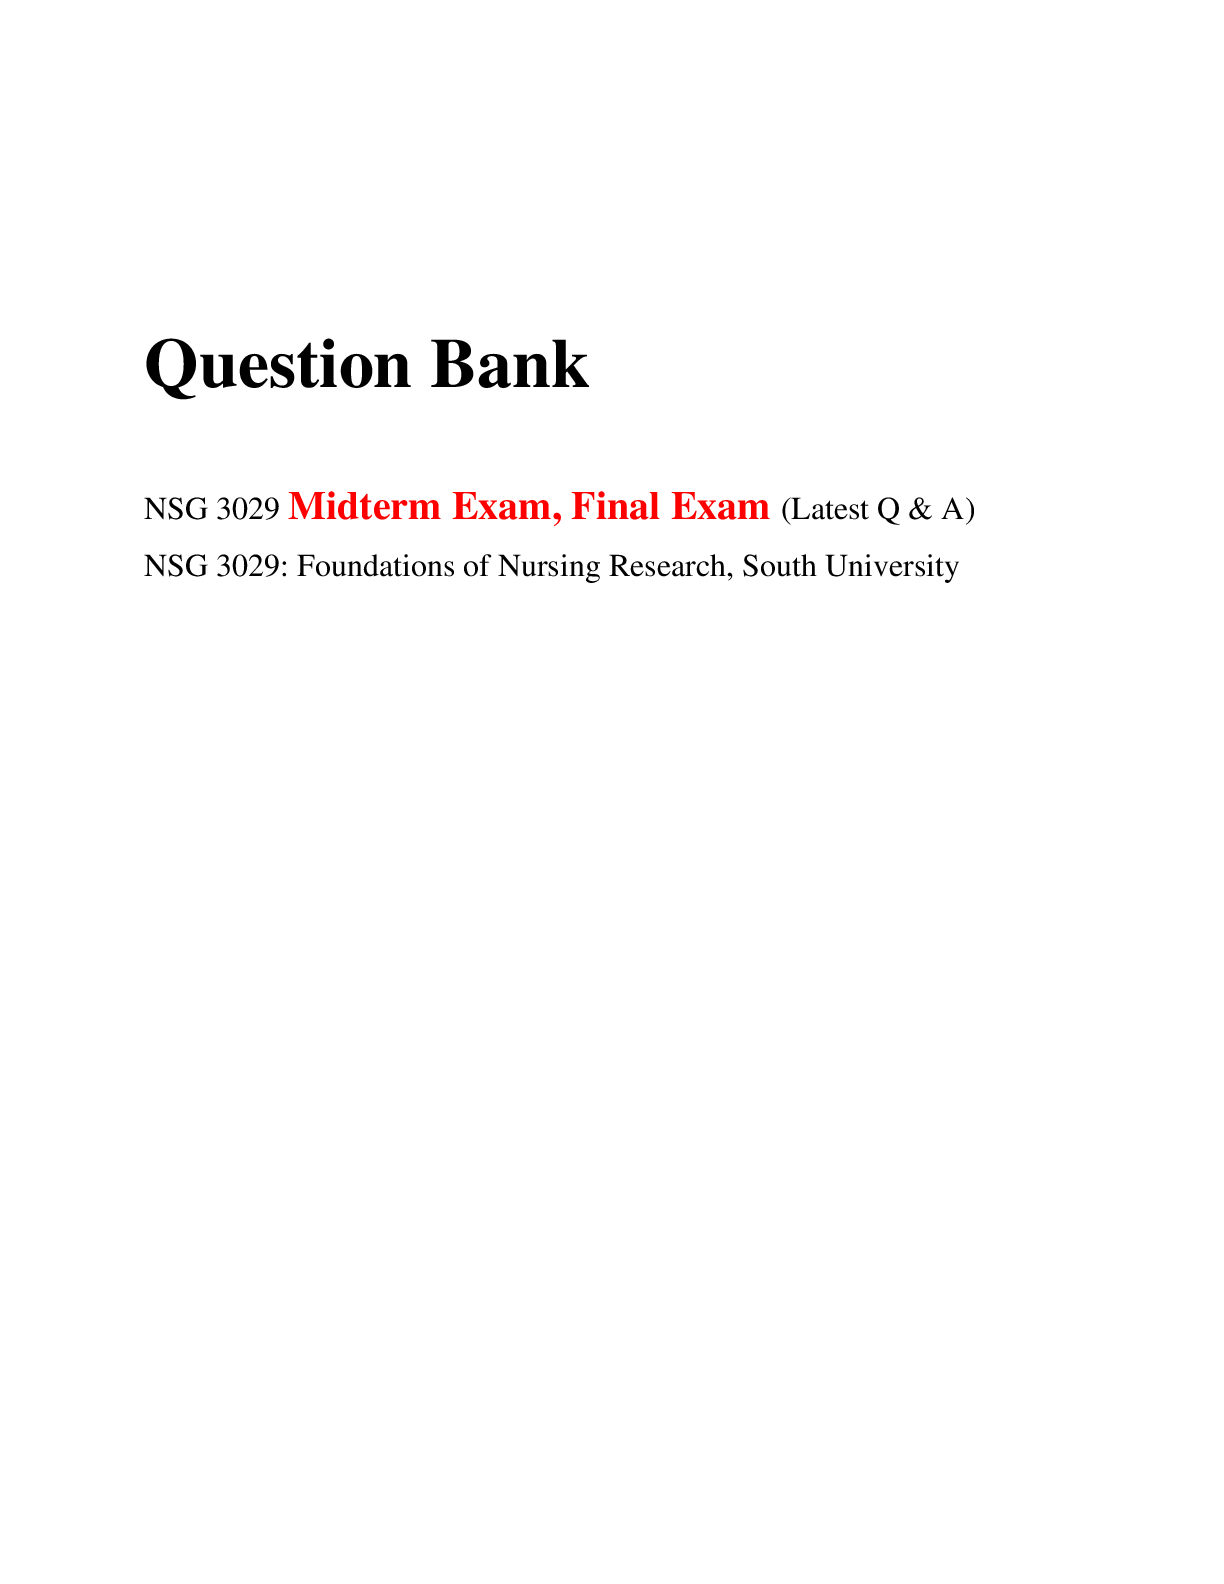
NSG 3029 CH1 (11) QUIZ | CORRECT ANSWERS
Document Content and Description Below
NSG 3029 CH1 (11) QUIZ
Chapter 11
1. The symbol used to designate a population mean is:
A. N
B. x
C. m [mu]
D. p
2. Common descriptive statistics are classified in all the following ways except:
A. Counts of da
...
[Show More]
Last updated: 3 years ago
Preview 1 out of 3 pages
Instant download
Buy this Document to get the Full Access Instantly
Provided by Students Who Aced it
We Verify Document Content to Gurantee Accuracy
Reviews( 0 )
Document information
Connected school, study & course
About the document
Uploaded On
Feb 19, 2021
Number of pages
3
Written in
All

Additional information
This document has been written for:
Uploaded
Feb 19, 2021
Downloads
0
Views
60
Topic Tags
Recommended For You
Get more on EXAM »

$25
42 Pages
NSG 3029 Mid Term and Final Exam Answer-NSG 3029 Mid Term -Fin...
$8
6 Pages
NSG 3029 Week 4 Discussion.docx/ Download To Score An A/ Sout...

$10
3 Pages
South University, Savannah - NSG 3029 Week 7 knowledge check n...
$10.5
3 Pages
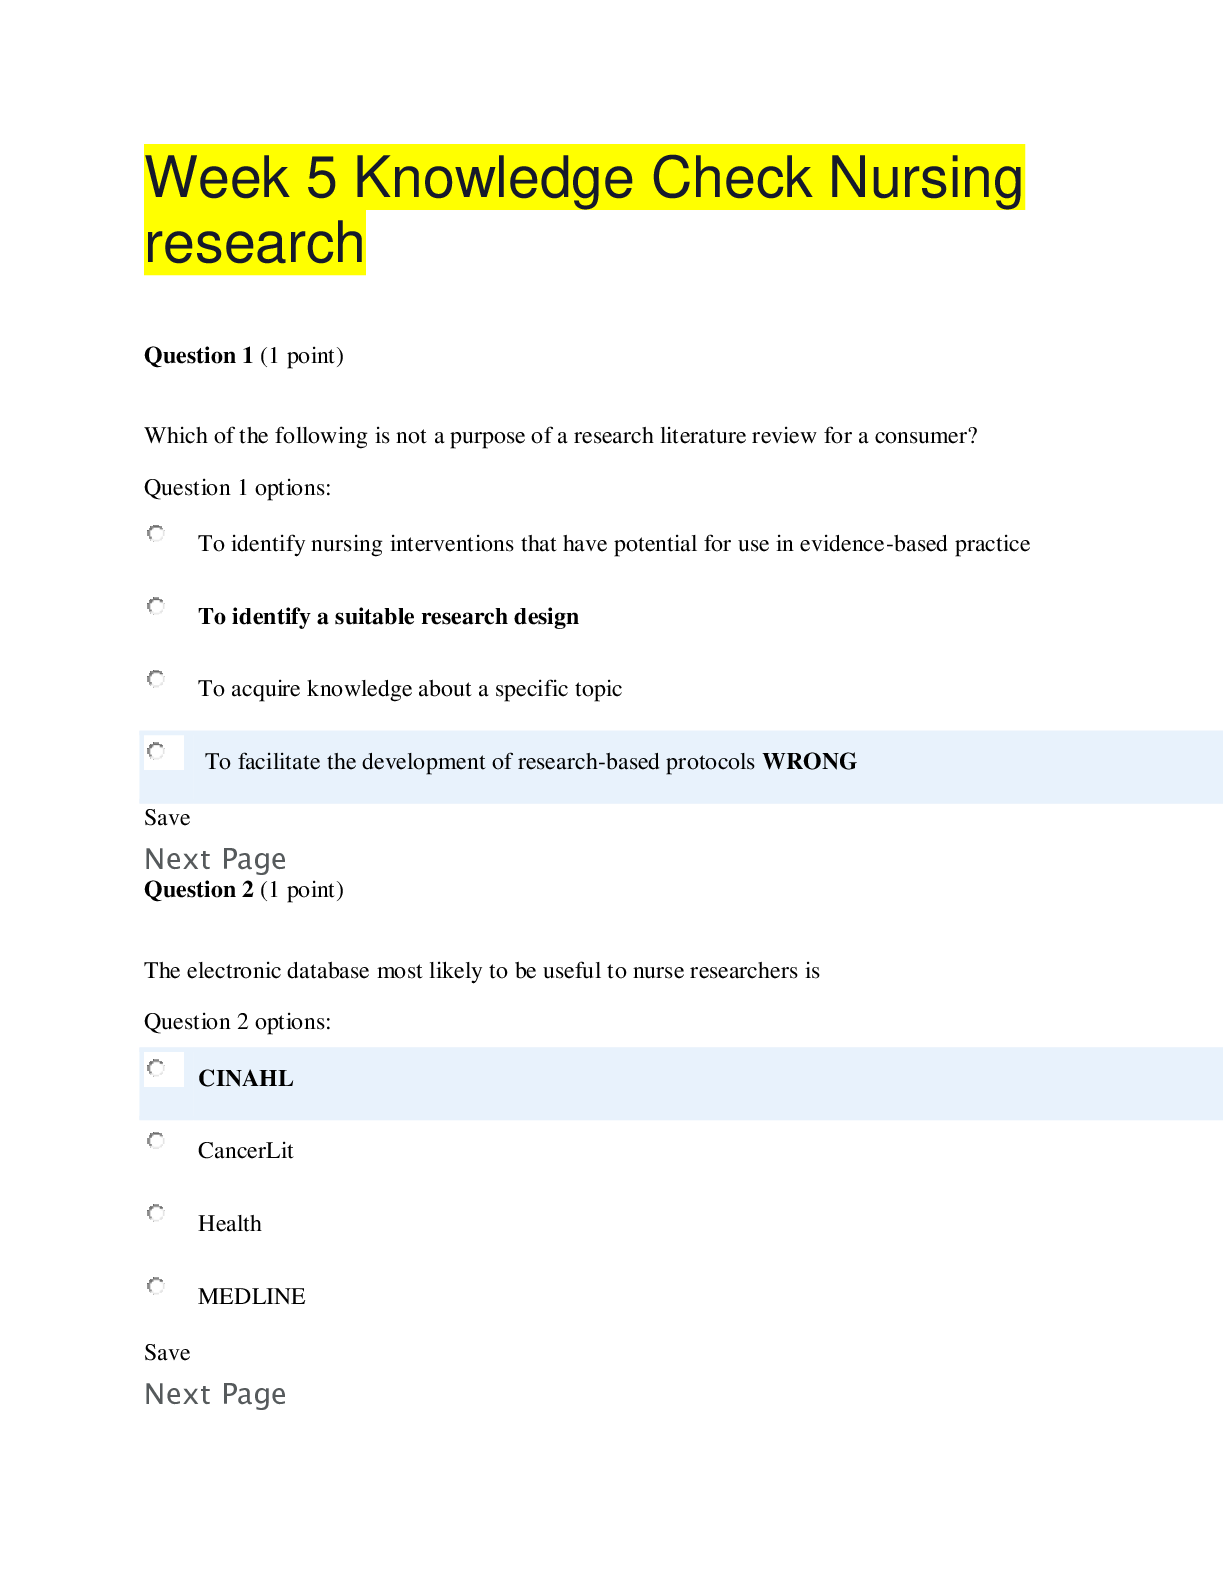
South University, Savannah - NSG 3029 Week 5 Knowledge Check N...
$10
3 Pages
South University, Savannah - NSG 3029 Week 8 Knowledge Check n...
$22.5
307 Pages
TEST BANK for Davis Advantage for Psychiatric Mental Health Nu...
$17
588 Pages
Test Bank For Fundamentals of Nursing 11th Edition Potter Perr...
More related documents below