Mathematics > Final Exam Review > Week 8 Questions and Answers MATH 225N MATH WITH 100% correct answers (All)
Week 8 Questions and Answers MATH 225N MATH WITH 100% correct answers
Document Content and Description Below
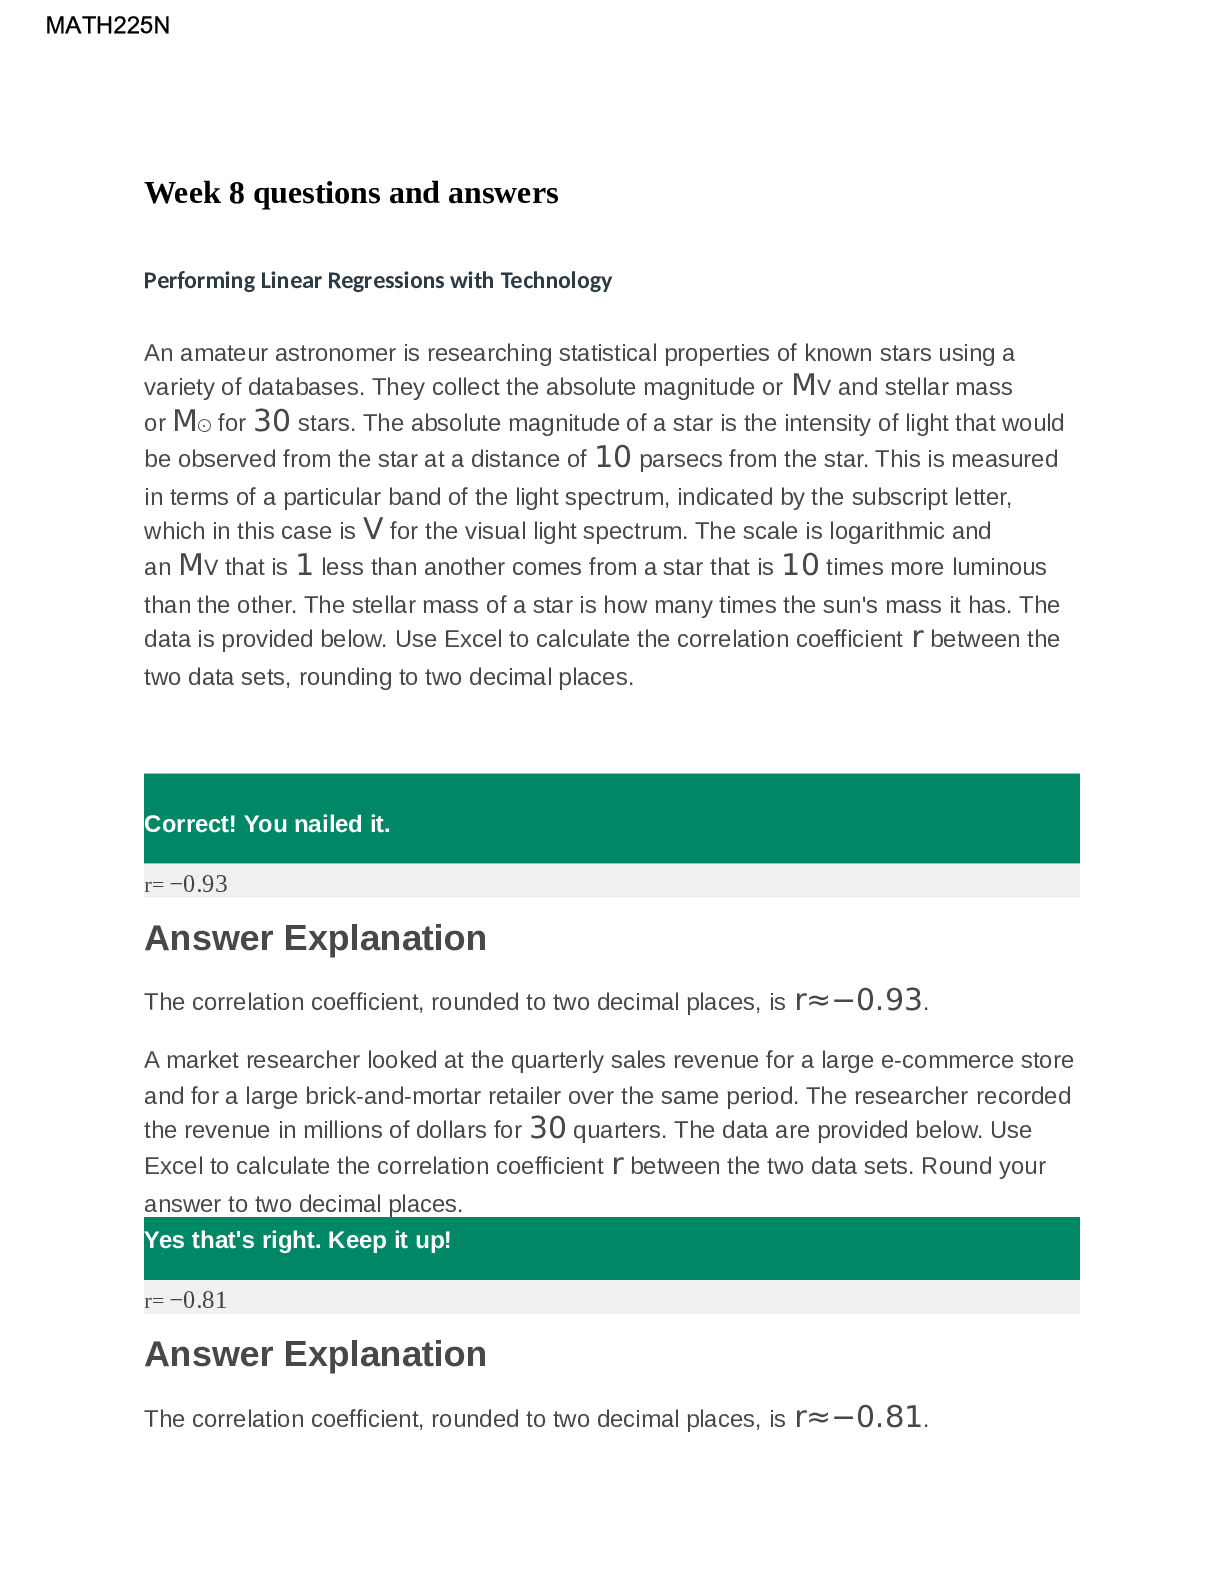
Week 8 Questions and Answers Performing Linear Regressions with Technology An amateur astronomer is researching statistical properties of known stars using a variety of databases. They collect ... the absolute magnitude or MV and stellar mass or M⊙ for 30 stars. The absolute magnitude of a star is the intensity of light that would be observed from the star at a distance of 10 parsecs from the star. This is measured in terms of a particular band of the light spectrum, indicated by the subscript letter, which in this case is V for the visual light spectrum. The scale is logarithmic and an MV that is 1 less than another comes from a star that is 10 times more luminous than the other. The stellar mass of a star is how many times the sun's mass it has. The data is provided below. Use Excel to calculate the correlation coefficient r between the two data sets, rounding to two decimal places. ________________________________________ Correct! You nailed it. ________________________________________ Yes that's right. Keep it up! ________________________________________ ________________________________________ Yes that's right. Keep it up! ________________________________________ ________________________________________ places. Perfect. Your hard work is paying off ? ________________________________________ Excel to calculate the correlation coefficient r between the two data sets. Round your answer to two decimal places. ________________________________________ Great work! That's correct. ________________________________________ ________________________________________ Well done! You got it right. ________________________________________ ________________________________________ Yes that's right. Keep it up! ________________________________________ Question The table shows data collected on the relationship between the time spent studying per day and the time spent reading per day. The line of best fit for the data is yˆ=0.16x+36.2. Assume the line of best fit is significant and there is a strong linear relationship between the variables. Studying (Minutes) 507090110 Reading (Minutes) 44485054 (a) According to the line of best fit, what would be the predicted number of minutes spent reading for someone who spent 67 minutes studying? Round your answer to two decimal places. ________________________________________ Yes that's right. Keep it up! ________________________________________ Reasonable Predictions Note that not all predictions are reasonable using a line of best fit. Typically, it is A scatterplot has a horizontal axis labeled x from 0 to 20 in increments of 1 and a vertical axis labeled y from 0 to 28 in increments of 2. 15 plotted points strictly follow the pattern of a line that rises from left to right and passes through the points left-parenthesis 6 comma 10 right-parentheses, left-parenthesis 8 comma 13 right-parenthesis, and left-parenthesis 14 comma 2 right-parentheses. There are other plotted points at .............................................................CONTINUED.................................................... [Show More]
Last updated: 2 years ago
Preview 1 out of 54 pages
Buy this document to get the full access instantly
Instant Download Access after purchase
Buy NowInstant download
We Accept:

Reviews( 0 )
$12.00
Can't find what you want? Try our AI powered Search
Document information
Connected school, study & course
About the document
Uploaded On
Feb 26, 2021
Number of pages
54
Written in

Additional information
This document has been written for:
Uploaded
Feb 26, 2021
Downloads
0
Views
80


.png)