Operations Management > EXAM > MQM 227 Exam 2 | Questions with 100% Correct Answers (All)
MQM 227 Exam 2 | Questions with 100% Correct Answers
Document Content and Description Below
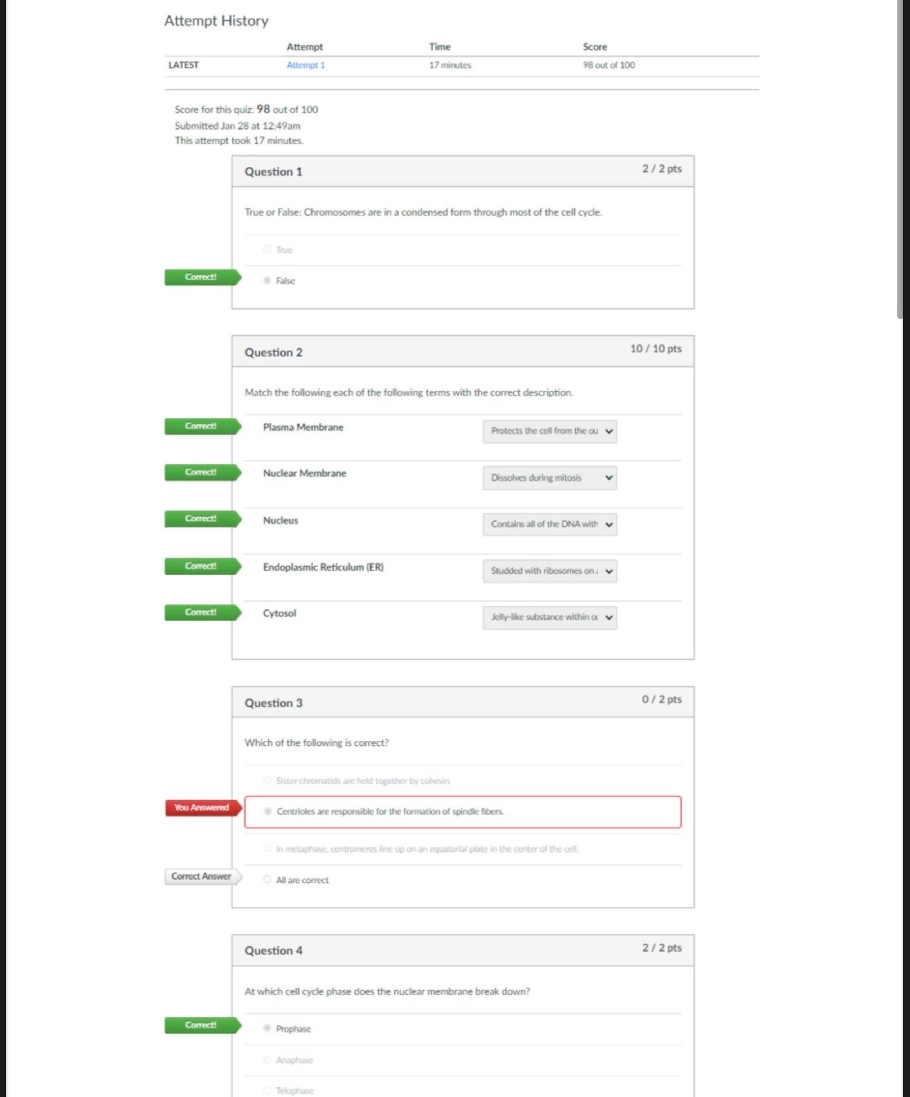
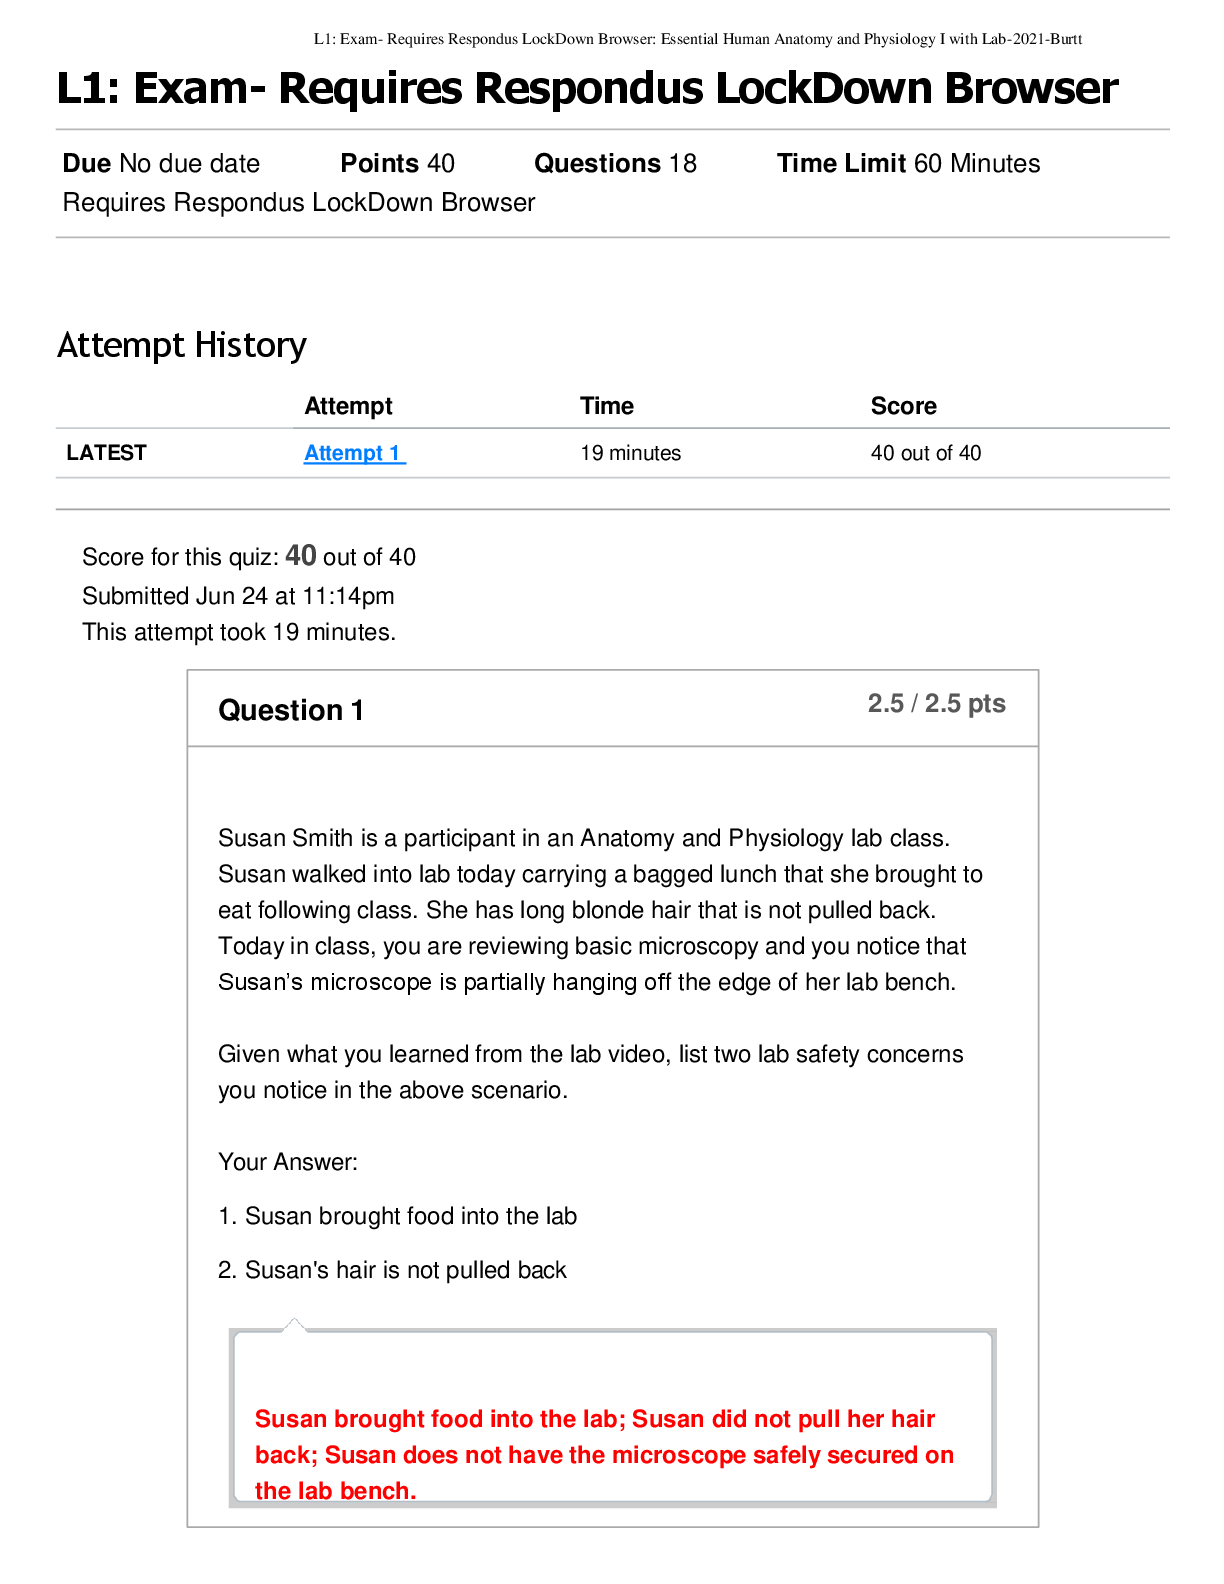
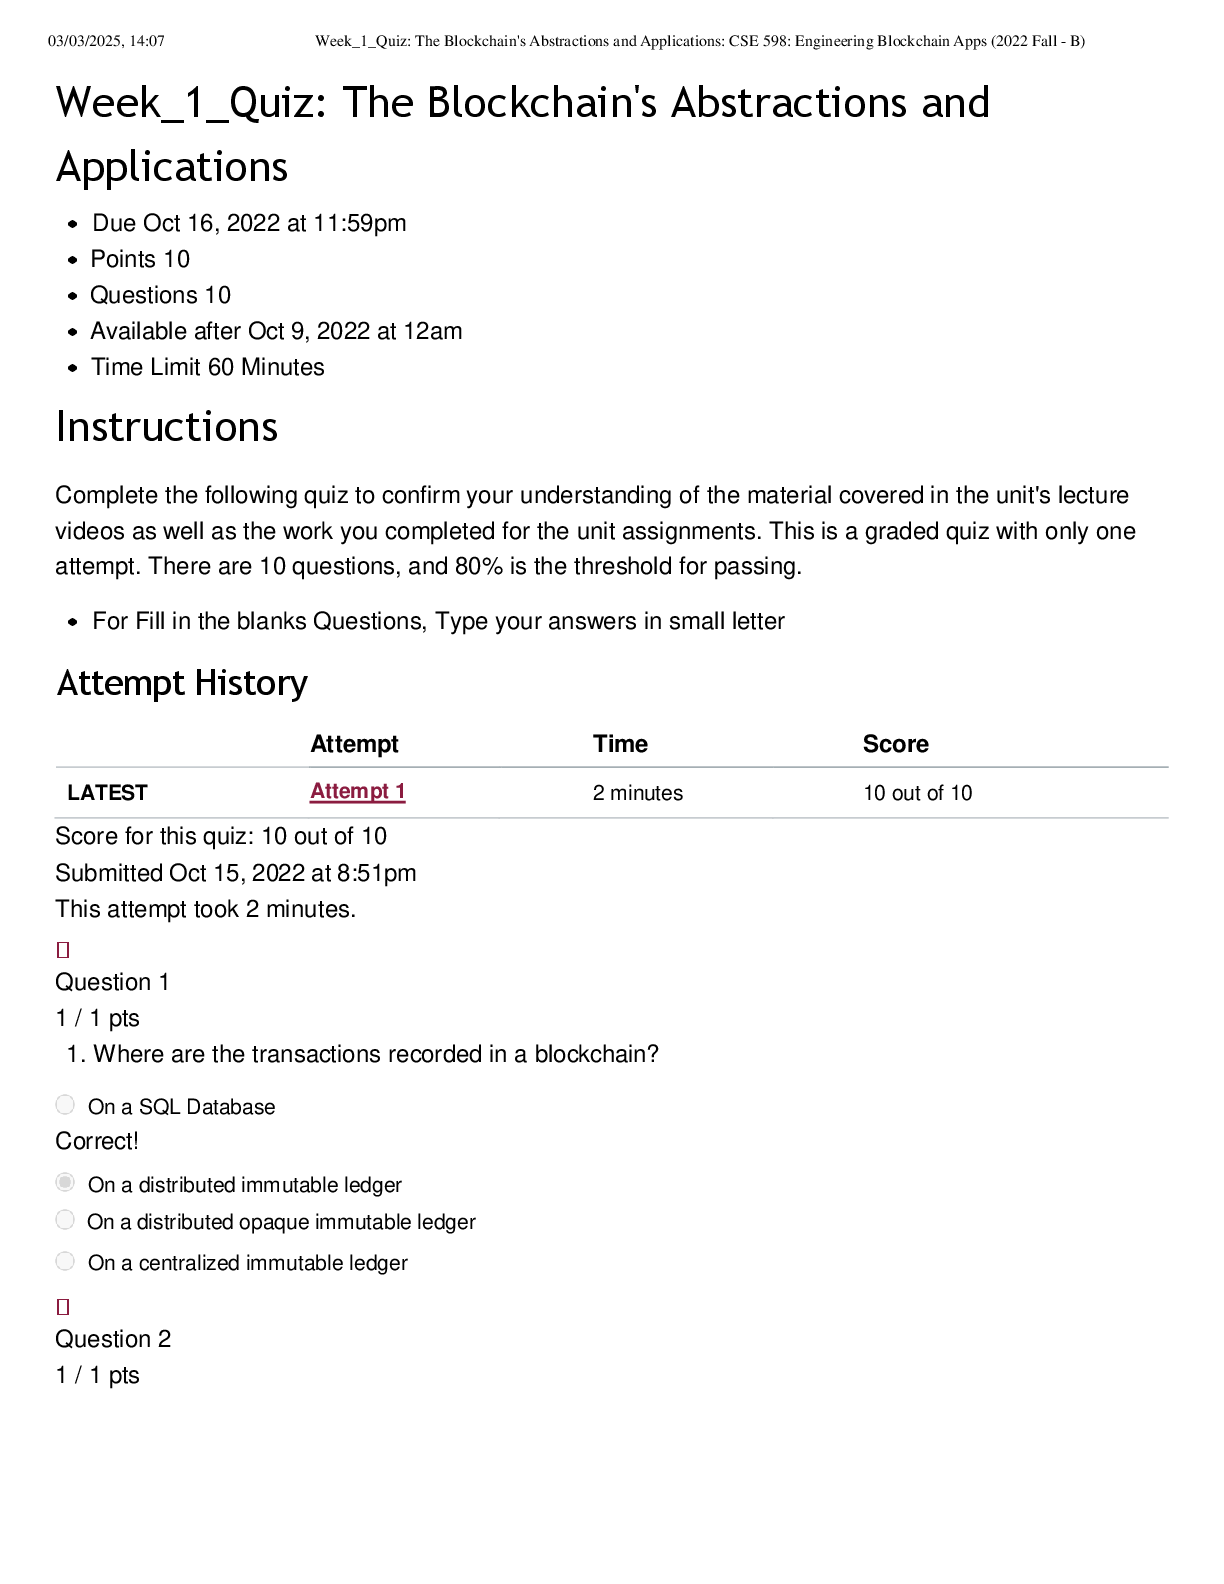
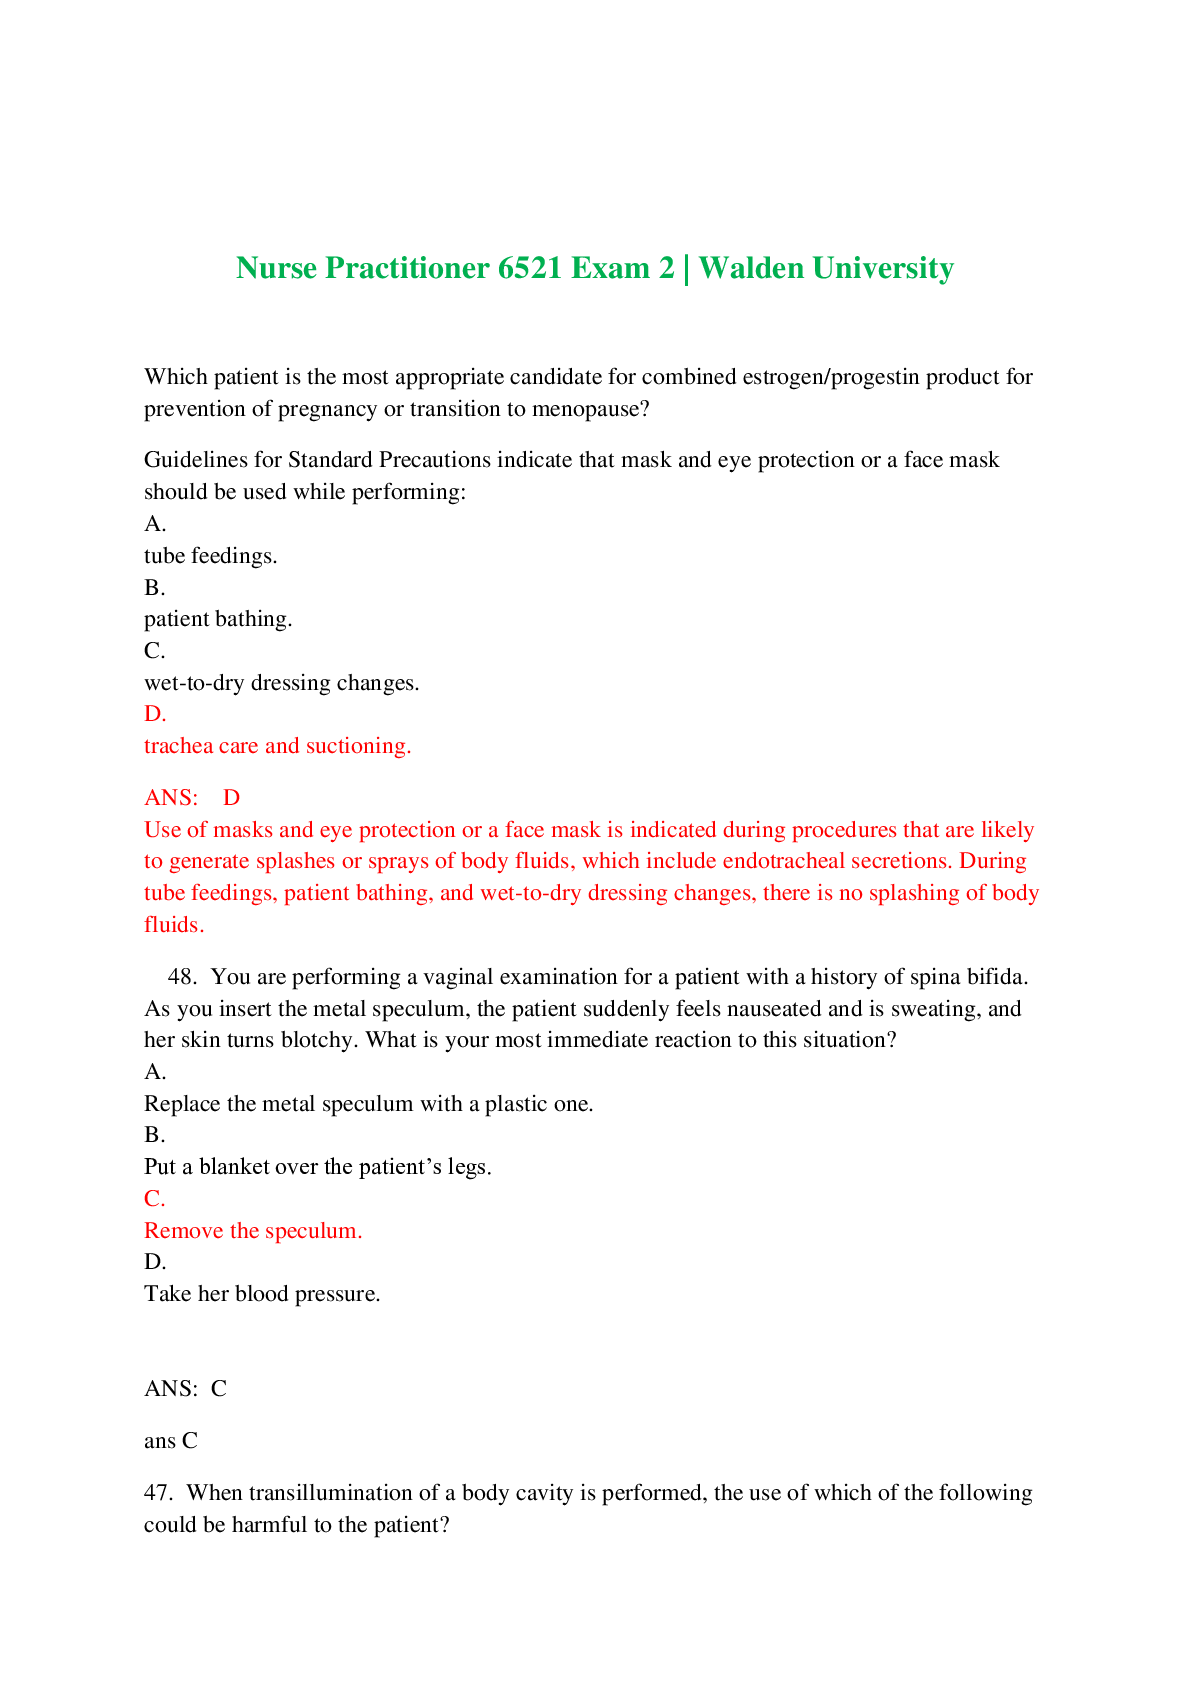
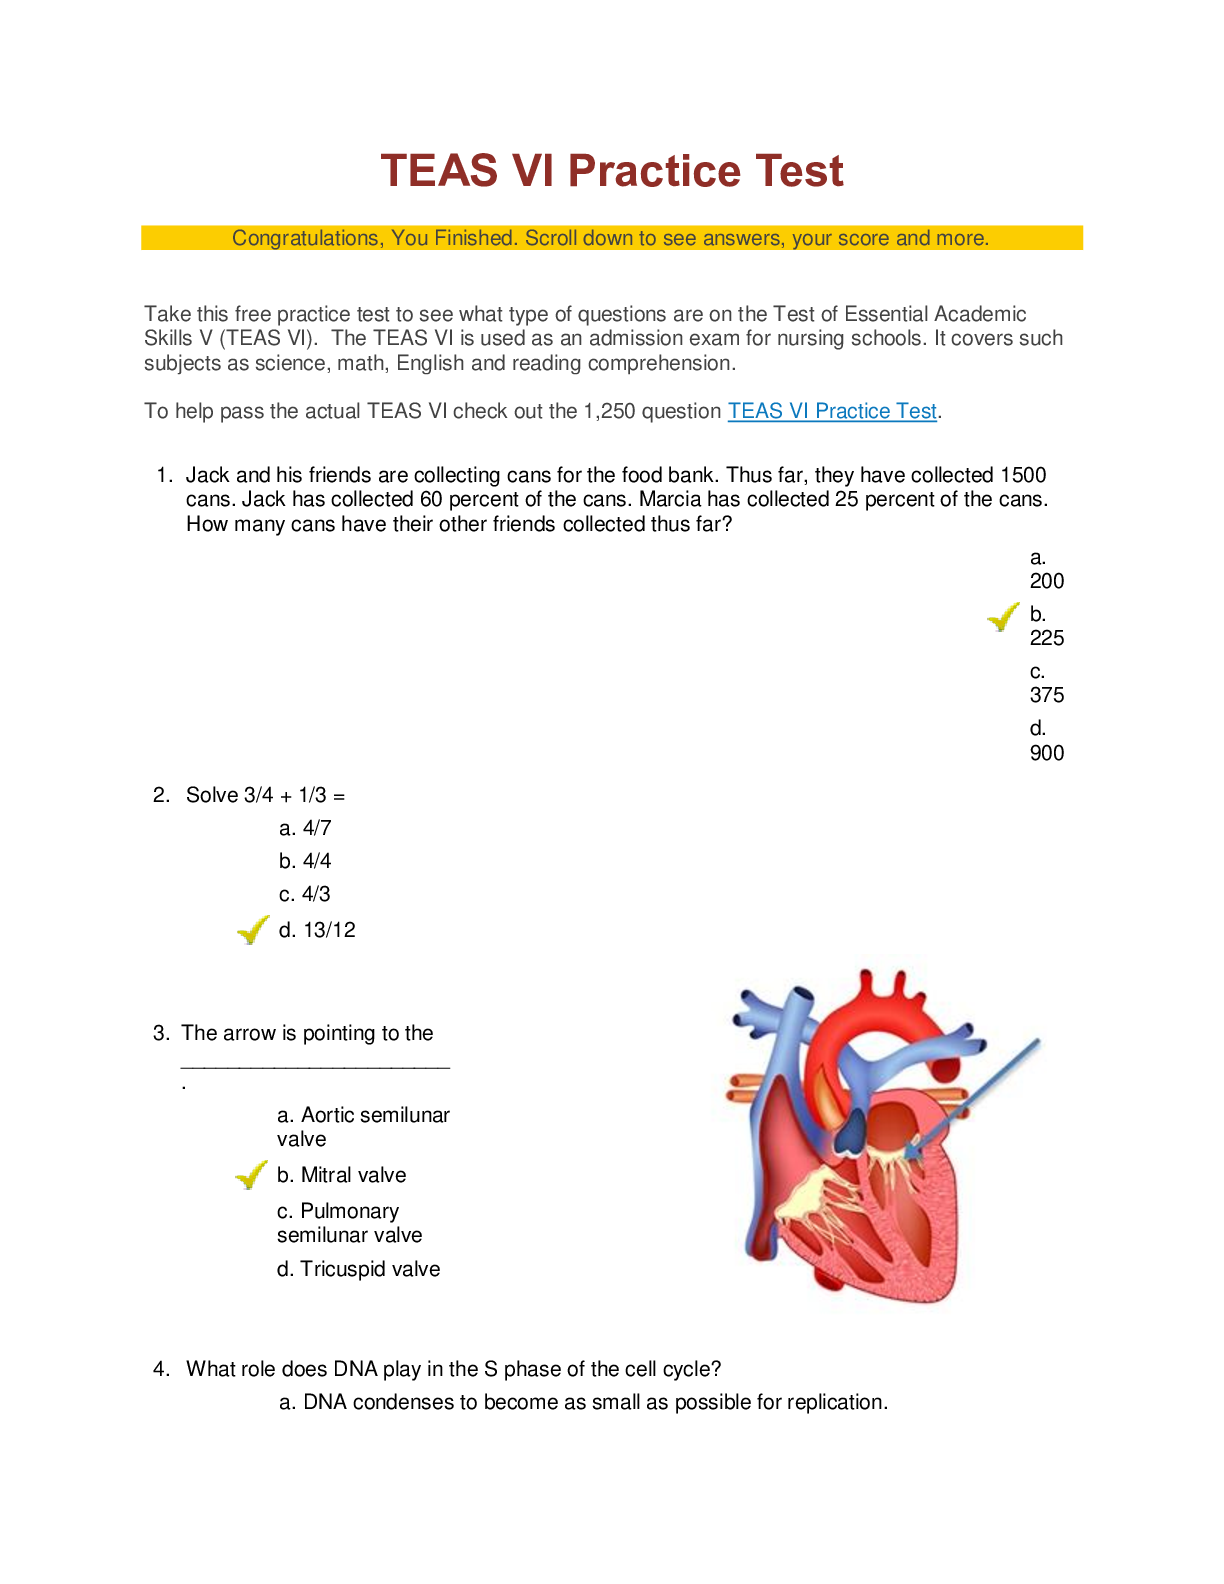
MQM 227 Exam 2 | Questions with 100% Correct Answers Which of the following best describes the term "cycle time"? A. Average time between completions of successive units B. Ratio of the time a reso... urce is activated over its use C. Can be no more that 60 minutes D. The same as utilization E. The labor content of the item being measured A process flowchart uses which of the following symbols to represent a decision point in a flow diagram? A. Rectangle B. Arrow C. Inverted triangle D. Diamond E. A dashed line A process flowchart uses which of the following symbols to represent storage areas or queues in a flow diagram? A. Rectangle B. Arrow C. Inverted triangle D. Diamond E. A dashed line Which of the following production process terms best describes the situation when activities in a stage of production must stop because there is no work? A. Blocking B. Buffering C. Starving D. Buffer E. Setup time Which of the following terms describes the time a unit spends actually being worked on together with the time spent waiting in a queue? A. Cycle time B. Flow time C. Run time D. Setup time E. Efficiency According to Little's law, which of the following ratios is used to find flow time? A. Cycle time/Process time B. Throughput time/Process velocity C. Process velocity/Throughput time D. Inventory/Throughput Rate E. Value-added time/Process velocity To reduce process flow time, you might try which of the following actions? A. Perform activities in parallel B. Change the sequence of activities. C. Reduce interruptions. D. Acquire additional equipment. E. All of these Consider a three sequentially stepped process named as Process A, Process B and Process C. Input comes into Process A. Output form A goes into Process B. Output from B goes into Process C. Output of C is the final output. Suppose that it takes 2 minutes per unit in Process A, 3 minutes per unit in Process B and 1 minute per unit in Process C. Suppose further that Process A receives input at the rate of 30 per hour. Where would you place a buffer? A. in front of Process A B. in front of Process B C. in front of Process C D. in front of both Process B and Process C E. None Consider a three sequentially stepped process named as Process A, Process B and Process C. Input comes into Process A. Output form A goes into Process B. Output from B goes into Process C. Output of C is the final output. Suppose that it takes 2 minutes per unit in Process A, 3 minutes per unit in Process B and 1 minute per unit in Process C. Suppose further that Process A receives input at the rate of 30 per hour. Which process will be experiencing starving? A. Process A B. Process B C. Process C D. Process B and Process C E. None Consider a three sequentially stepped process named as Process A, Process B and Process C. Input comes into Process A. Output form A goes into Process B. Output from B goes into Process C. Output of C is the final output. Suppose that it takes 2 minutes per unit in Process A, 3 minutes per unit in Process B and 1 minute per unit in Process C. What will be maximum steady state output from this system? A. 30 per hour B. 60 per hour C. 20 per hour D. 10 per hour E. cannot tell since it depends on the input rate. The philosophical leaders of the quality movement, Philip Crosby, W. Edwards Deming, and Joseph M. Juran, had the same general message about what it took to achieve outstanding quality. Which of the following was not part of that message? A. Quality is free B. Leadership from senior management C. Customer focus D. Total involvement of the workforce E. Continuous improvement The philosophical leaders of the quality movement, Philip Crosby, W. Edwards Deming, and Joseph M. Juran, had the same general message about what it took to achieve outstanding quality. Which of the following was part of that message? A. Fourteen steps for quality management B. Quality is free C. Customer focus D. Zero defects E. Six Sigma A flowchart as part of a Six-Sigma quality improvement process might be found in which DMAIC category? A. Define B. Measure C. Analyze D. Improve E. Control A fishbone diagram as part of a Six-Sigma quality improvement process might be found in which DMAIC category? A. Define B. Measure C. Analyze D. Improve E. Control An opportunity flow diagram as part of a Six-Sigma quality improvement process might be found in which DMAIC category? A. Define B. Measure C. Analyze D. Improve E. Control Which of the following is an analytical tool used in Six-Sigma quality improvement programs? A. Leadership B. Pareto charts C. Management by fact D. Continuous improvement E. Kaizen The Malcolm Baldrige Award selection process helps improve quality and productivity by which of the following means? A. Stimulating foreign-based suppliers of American companies to improve quality B. Reporting quality levels among American firms C. Identifying American firms with the most difficult quality problems D. Providing feedback to applicants by the examiners E. Helping Baldrige award winners increase their sales The Malcolm Baldrige National Quality Award is given to organizations that have done which of the following? A. Instituted a Six-Sigma approach to total quality control. B. Demonstrated a high level of product quality. C. Demonstrated outstanding quality in their products and processes. D. Have a world-class quality control function. E. Most significantly improved their product quality levels. The dimension of design quality that concerns the sensory characteristics of the product is which of the following? A. Features B. Serviceability C. Perceived quality D. Reputation E. Aesthetics Which of the following is a dimension of design quality? A. Price B. Features C. Color D. Weight E. Quality at the source Which of the following are basic assumptions that justify an analysis of the costs of quality? A. Failures are caused. B. Prevention is more expensive. C. Performance can be learned. D. Rules of thumb don't always work. E. Appraisal costs are less than prevention costs. A cost of quality classification is which of the following? A. Material costs B. Prevention costs C. Variable overhead D. Direct labor E. Inventory costs Which of the following is the cost of quality classification for costs such as scrap, rework, or repair? A. Appraisal costs B. Prevention costs C. External failure costs D. Internal failure costs E. Rework and wastage Which of the following is the cost of quality classification for costs such as inspection, testing, and other tasks to ensure that the product or process is acceptable? A. Appraisal costs B. Prevention costs C. External failure costs D. Internal failure costs E. Checking costs DPMO refers to A. defects per million parts B. defects per many units C. defects per million operations D. defects per million opportunities E. defects per million In monitoring process quality, we might use which of the following statistics? A. Absolute values B. Percentage deviation from tolerance centers C. "k" values for the sample mean D. Logarithmic control intervals E. Difference between the highest and lowest value in a sample You have just used the capability index (Cpk) formulas to compute the two values "min [2, 2.5]." Which of the following is the proper interpretation of these numbers? A. The true capability index value is 2.5. B. The mean of the production process has shifted to the left of the design limits. C. The mean of the production process has shifted to the right of the design limits. D. The mean has not shifted at all. E. The true capability index value is between 2 and 2.5. Quality control charts usually have a central line and upper and lower control limit lines. Which of the following is not a reason that the process being monitored with the chart should be investigated? A. A large number of plots are close to the upper or lower control lines. B. The behaviour of the plots is erratic. C. A single plot falls above or below the control limits. D. There is a change in raw materials or operators. E. There is a run of five above the central line. Quality control charts usually have a central line and upper and lower control limit lines. Which of the following is a reason that the process being monitored with the chart should be investigated? A. A single plot falls above or below the control limits. B. Behavior is normal. C. A large number of plots are on or near the central line. D. There is no real trend in any direction. E. There is a change in raw materials or operators. For which of the following should we use a p-chart to monitor process quality? A. Defective electrical switches B. Errors in the length of a pencil C. Weight errors in cans of soup D. Temperature of entrees in a restaurant E. Letter grades on a final examination For which of the following should we use an X-bar chart based on sample means to monitor process quality? A. Grades in a freshman "pass/fail" course B. Tire pressures in an auto assembly plant C. Vehicles passing emissions inspection D. Computer software errors E. Number of units with missing operations For which of the following should we use an R-chart to monitor process quality? A. Grades in a freshman "pass/fail" course B. Tire pressures in an auto assembly plant C. Vehicles passing emissions inspection D. Computer software errors E. Number of units with missing operations You are developing an X-bar chart based on sample means. You know the standard deviation of the sample means is 4, the desired confidence level is 99.7 percent, and the average of the sample means is 24. Which of the following is your UCL? A. 36 B. 24 C. 12 D. 4 E. None of these You want to develop a three-sigma R-chart. You know the average range is 5 based on several samples of size 10. Which of the following is the resulting UCL? A. 20.9 B. 8.9 C. 7.02 D. 5 E. 3.1 Variation in production systems that is caused by factors that can be clearly identified and possibly even managed is called assignable variation. T/F True It is impossible to have zero variability in production processes. T/F True Which of the following are related to lean production? A. A philosophy of waste elimination B. Lean consumption C. Never running out of inventory D. The Wahei-Subaru method E. Full use of capacity Which of the following is an element that addresses elimination of waste under lean production? A. Production ahead of demand B. Group plant loading technology C. Kanban production control system D. Minimized run times E. Full capacity utilization Group technology (GT) is credited with which of the following benefits? A. Reducing waiting time between process operations B. Improving inventory discipline C. Reducing required workforce skills D. Improved labor relations E. Improved small group functioning In setting up a Kanban control system you need to determine the number of kanban card sets needed. If assume the expected demand during lead time is 50 per hour, the safety stock is 20 percent of the demand during lead time, the container size is 4, and the lead time to replenish an order is 8 hours, what number of Kanban card sets is needed? A. 60 B. 80 C. 90 D. 120 E. 150 When implementing a lean production system, a stabilized schedule is achieved using which of the following? A. Level scheduling [Show More]
Last updated: 5 months ago
Preview 4 out of 15 pages

Loading document previews ...
Buy this document to get the full access instantly
Instant Download Access after purchase
Buy NowInstant download
We Accept:

Also available in bundle (1)
MQM 227 EXAM 1 & 2 BUNDLE
MQM 227 EXAM 1 & 2 BUNDLE
By Nurse Henny 5 months ago
$16
2
Reviews( 0 )
$16.00
Can't find what you want? Try our AI powered Search
Document information
Connected school, study & course
About the document
Uploaded On
Feb 20, 2025
Number of pages
15
Written in

Additional information
This document has been written for:
Uploaded
Feb 20, 2025
Downloads
0
Views
9