Geography > QUESTIONS & ANSWERS > UST 289 - Quantitative 2 Cleveland State University (All)
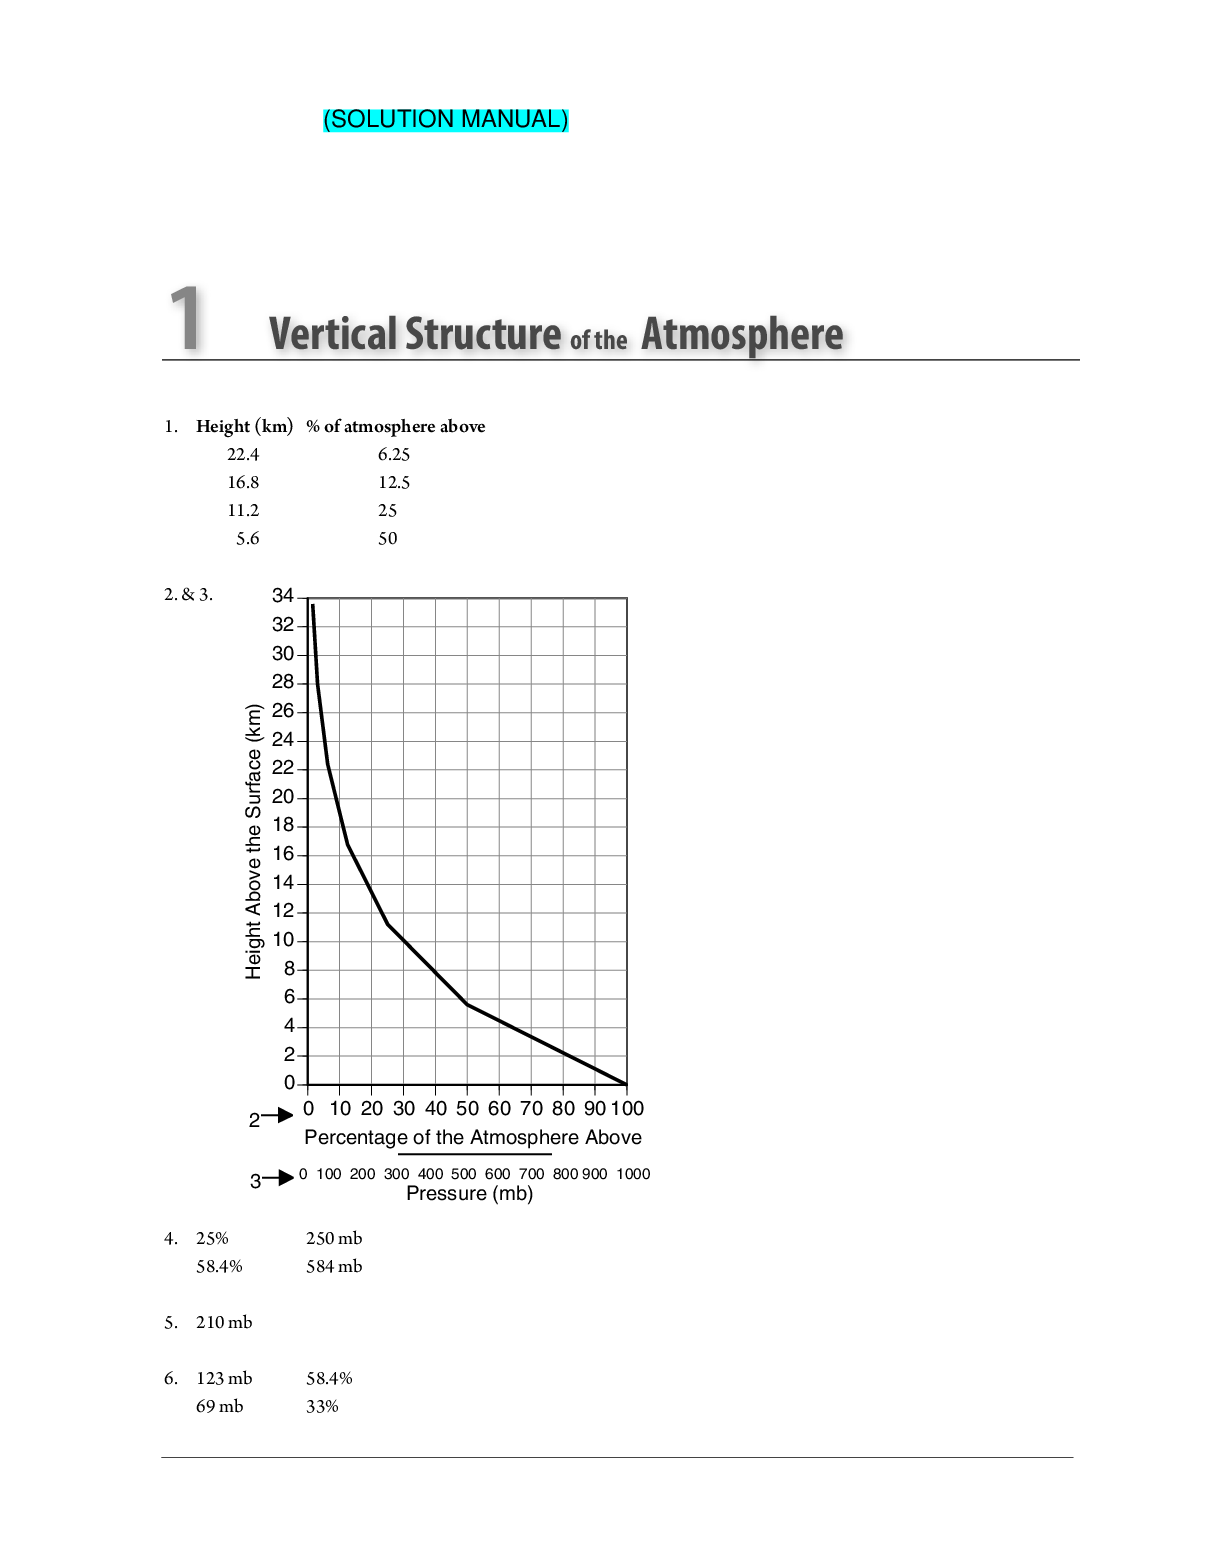
UST 289 - Quantitative 2 Cleveland State University
Document Content and Description Below
Last updated: 3 months ago
Preview 1 out of 3 pages
Instant download
.png)
Buy this Document to get the Full Access Instantly
Provided by Students Who Aced it
We Verify Document Content to Gurantee Accuracy
Reviews( 0 )
Document information
Connected school, study & course
About the document
Uploaded On
Mar 24, 2021
Number of pages
3
Written in
All

Additional information
This document has been written for:
Uploaded
Mar 24, 2021
Downloads
0
Views
78
Document Keyword Tags
Recommended For You
Get more on QUESTIONS & ANSWERS »
UST 289 Quantitative Exercise 2 Instructions and Answers GRADE...

Exercises for Weather & Climate, 9e Greg Carbone (Solution Man...

Human Geography Places and Regions in Global Context, 5th Cana...

OCR GCE Geography H481/03: Geographical debates Advanced GCE M...