Biology > Lab Report > University of Illinois, Chicago - BIOS 222>Fish Proteomics Lab Report (All)
University of Illinois, Chicago - BIOS 222>Fish Proteomics Lab Report
Document Content and Description Below
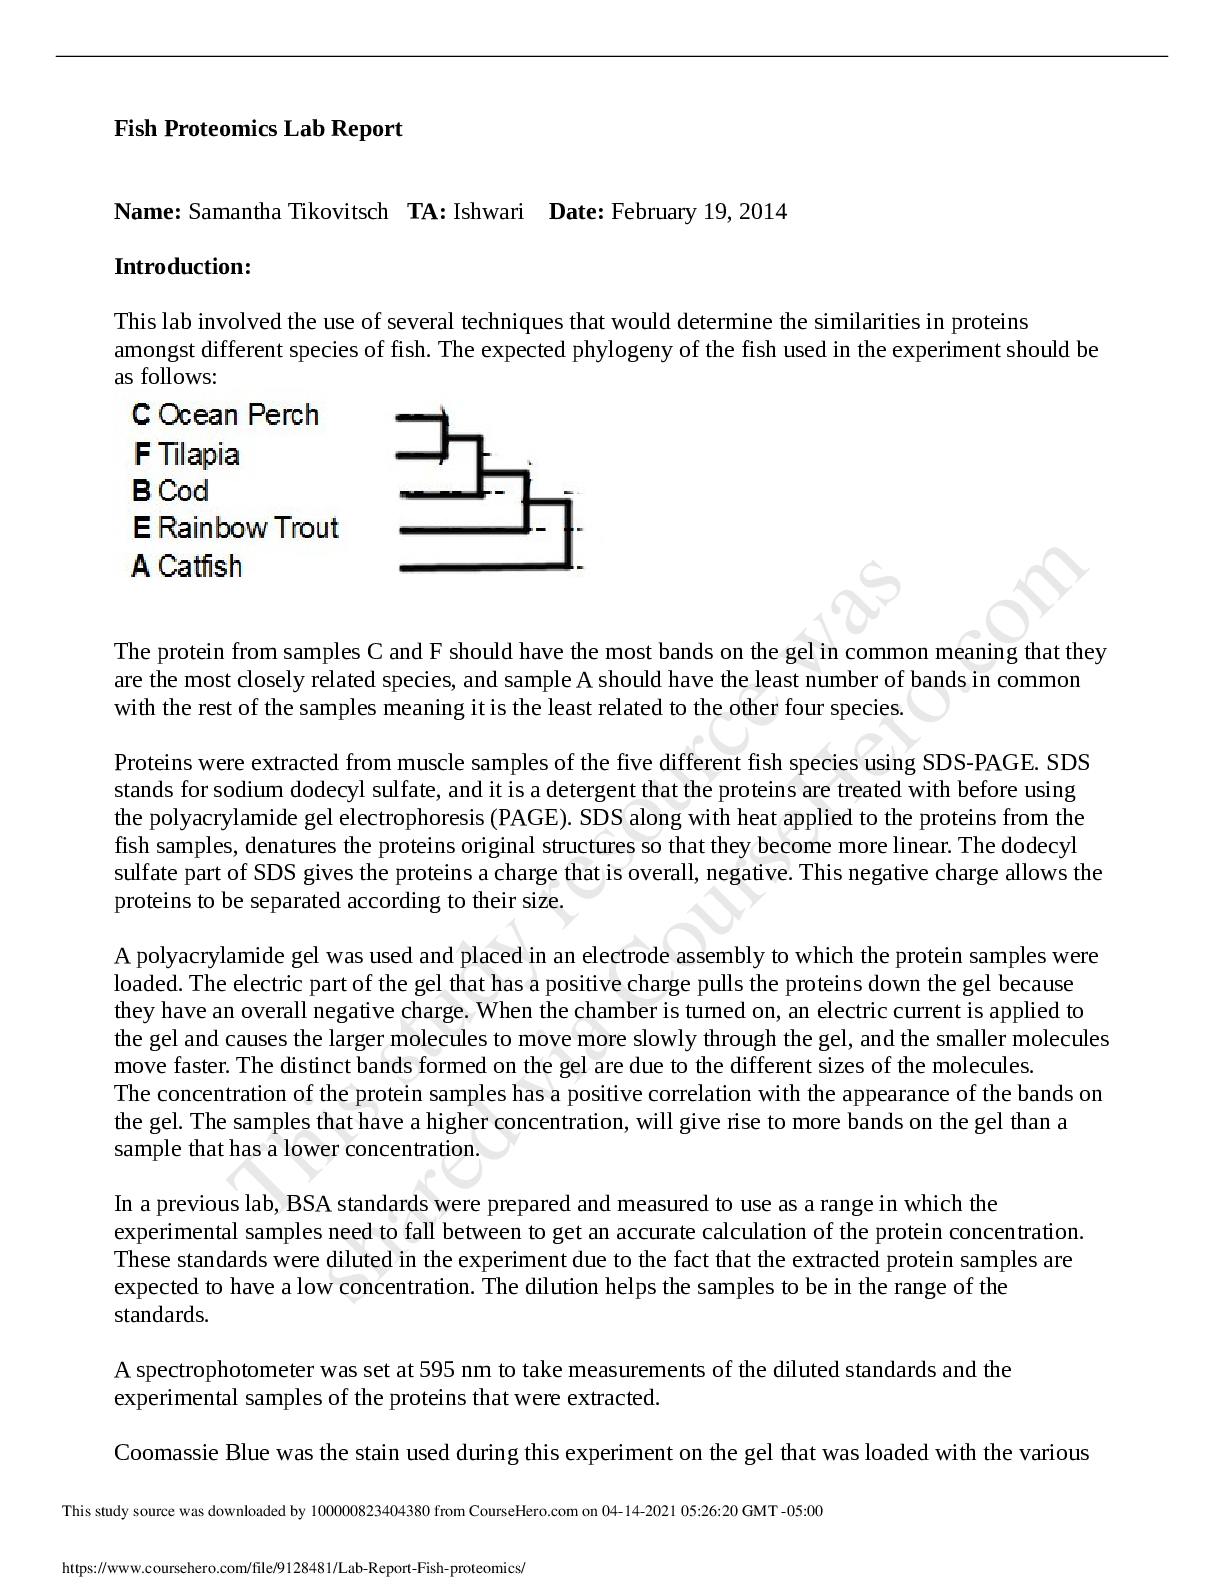
Introduction: This lab involved the use of several techniques that would determine the similarities in proteins amongst different species of fish. The expected phylogeny of the fish used in the expe... riment should be as follows: The protein from samples C and F should have the most bands on the gel in common meaning that they are the most closely related species, and sample A should have the least number of bands in common with the rest of the samples meaning it is the least related to the other four species. Proteins were extracted from muscle samples of the five different fish species using SDS-PAGE. SDS stands for sodium dodecyl sulfate, and it is a detergent that the proteins are treated with before using the polyacrylamide gel electrophoresis (PAGE). SDS along with heat applied to the proteins from the fish samples, denatures the proteins original structures so that they become more linear. The dodecyl sulfate part of SDS gives the proteins a charge that is overall, negative. This negative charge allows the proteins to be separated according to their size. A polyacrylamide gel was used and placed in an electrode assembly to which the protein samples were loaded. The electric part of the gel that has a positive charge pulls the proteins down the gel because they have an overall negative charge. When the chamber is turned on, an electric current is applied to the gel and causes the larger molecules to move more slowly through the gel, and the smaller molecules move faster. The distinct bands formed on the gel are due to the different sizes of the molecules. The concentration of the protein samples has a positive correlation with the appearance of the bands on the gel. The samples that have a higher concentration, will give rise to more bands on the gel than a sample that has a lower concentration. In a previous lab, BSA standards were prepared and measured to use as a range in which the experimental samples need to fall between to get an accurate calculation of the protein concentration. These standards were diluted in the experiment due to the fact that the extracted protein samples are expected to have a low concentration. The dilution helps the samples to be in the range of the standards. A spectrophotometer was set at 595 nm to take measurements of the diluted standards and the experimental samples of the proteins that were extracted. Coomassie Blue was the stain used during this experiment on the gel that [Show More]
Last updated: 2 years ago
Preview 1 out of 7 pages
Buy this document to get the full access instantly
Instant Download Access after purchase
Buy NowInstant download
We Accept:

Reviews( 0 )
$7.00
Can't find what you want? Try our AI powered Search
Document information
Connected school, study & course
About the document
Uploaded On
Apr 14, 2021
Number of pages
7
Written in

Additional information
This document has been written for:
Uploaded
Apr 14, 2021
Downloads
0
Views
82
.png)