Statistics > EXAM > Sophia_Statistics_Unit_4_Milestone 2020 | Sophia_Statistics_Unit_4_Milestone_Graded A (All)
Sophia_Statistics_Unit_4_Milestone 2020 | Sophia_Statistics_Unit_4_Milestone_Graded A
Document Content and Description Below
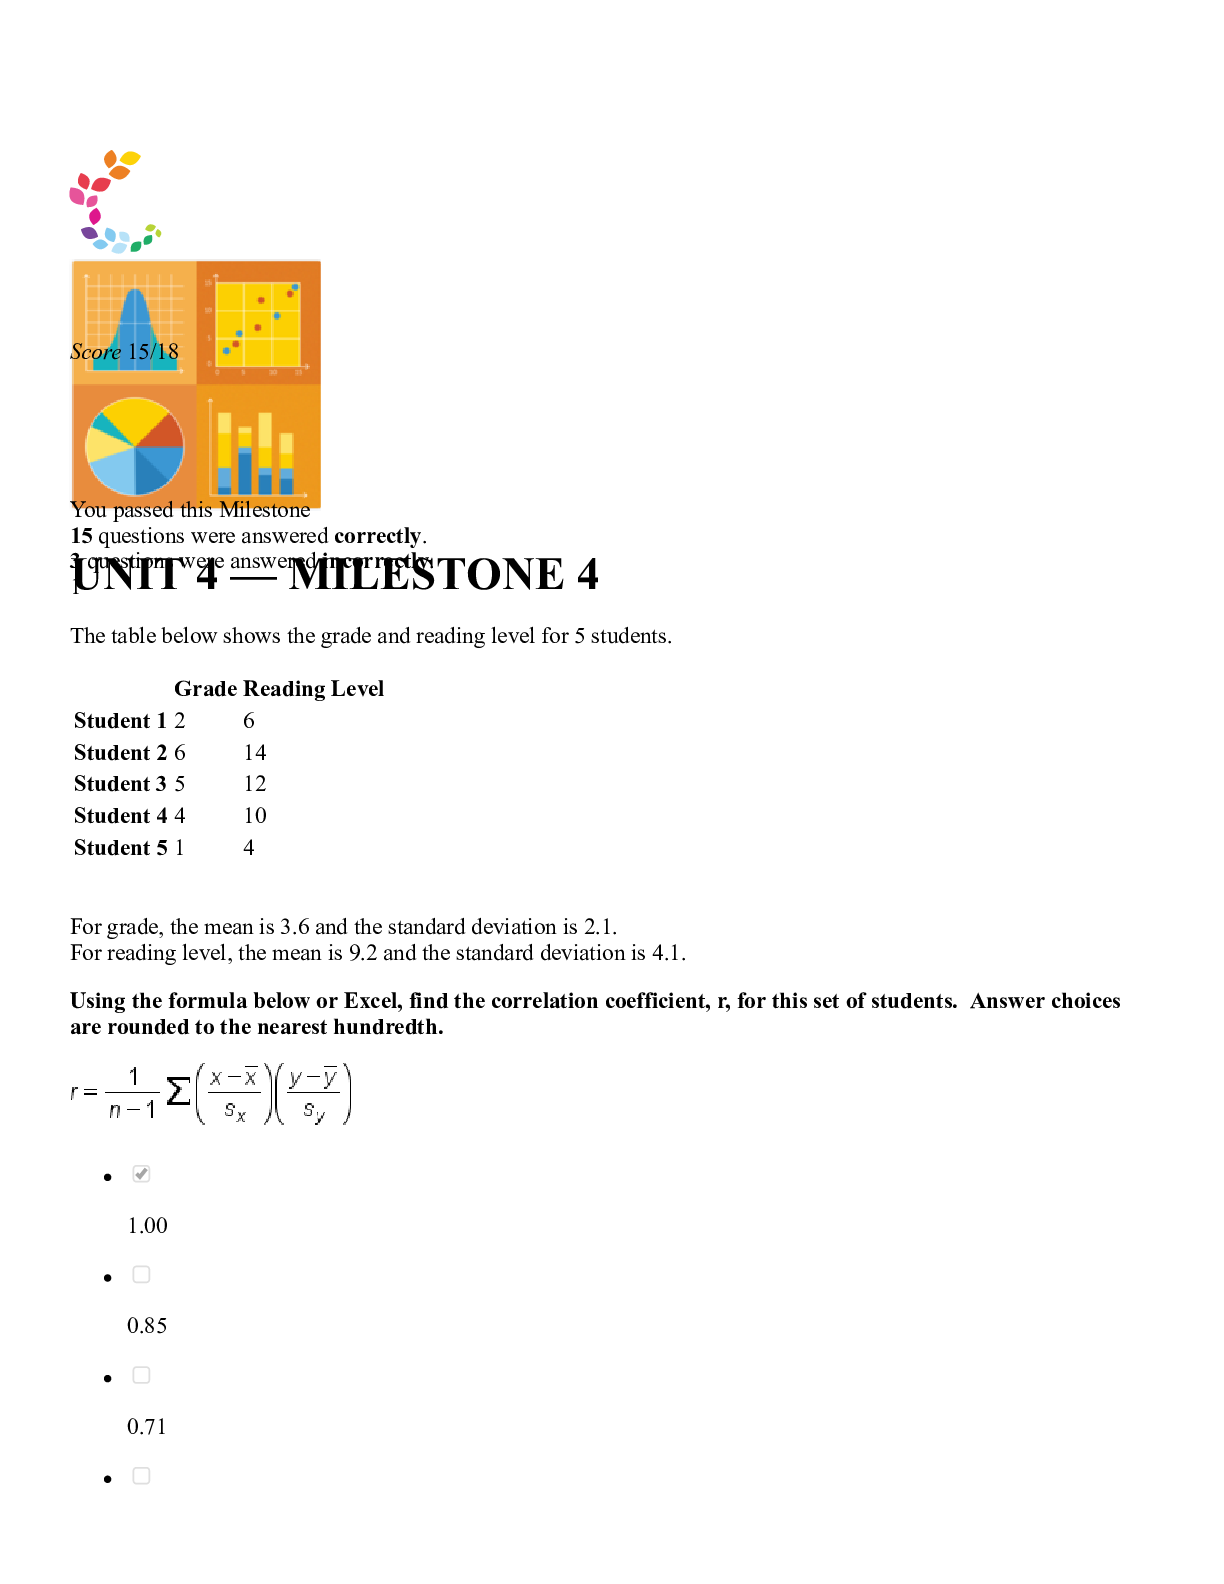
Sophia_Statistics_Unit_4_Milestone 2020 You passed this Milestone 15 questions were answered correctly. 3 questions were answered incorrectly. 1 The table below shows the grade and reading level ... for 5 students. Grade Reading Level Student 1 2 6 Student 2 6 14 Student 3 5 12 Student 4 4 10 Student 5 1 4 For grade, the mean is 3.6 and the standard deviation is 2.1. For reading level, the mean is 9.2 and the standard deviation is 4.1. Using the formula below or Excel, find the correlation coefficient, r, for this set of students. Answer choices are rounded to the nearest hundredth. 1.00 0.85 0.710.92 RATIONALE In order to get the correlation, we can use the formula: Correlation can be quickly calculated by using Excel. Enter the values and use the function "=CORREL(". CONCEPT Correlation I need help with this question 2 This scatterplot shows the maintenance expense for a truck based on its years of service.The equation for least regression line to this data set is ŷ = 76.82x + 88.56. What is the predicted value (in dollars) for maintenance expenses when a truck is 7 years old? $549 $473 $626 $703 RATIONALE In order to get the predicted maintenance expense when the age of the truck is 7 years, we simply substitute the value 7 in our equation for x. So we can note that: CONCEPT Predictions from Best-Fit Lines I need help with this question 3 Raoul lives in Minneapolis and he is planning his spring break trip. He creates the scatterplot below to assess how much his trip will cost.Which answer choice correctly indicates the explanatory and response variables for the scatterplot? Explanatory variable: Distance Response variable: Cost Explanatory variable: Minneapolis Response variable: Miles flown Explanatory variable: Miles flown Response variable: Minneapolis Explanatory variable: Cost Response variable: Distance RATIONALE The explanatory variable is what is along the horizontal axis, which is distance. The response variable is along the vertical axis, which is cost. CONCEPT Explanatory and Response Variables I need help with this question 4 Which of the following scatterplots shows a correlation affected by an influential point?RATIONALE An influential point will influence correlation that doesn't lie in the range of the other data. This graphs shows an outlier that is above the other data and lower in the x-direction. CONCEPT Cautions about Correlation I need help with this question 5 Peter analyzed a set of data with explanatory and response variables x and y. He concluded the mean and standard deviation for x as 7.8 and 3.70, respectively. He also concluded the mean and standard deviation for y as 12.2 and 4.15, respectively. The correlation was found to be 0.964. Select the correct slope and y-intercept for the least-squares line. Answer choices are rounded to the hundredths place. Slope = -1.08 y-intercept = 3.78 Slope = 1.08 y-intercept = -3.78 Slope = 1.08 y-intercept = 3.78Slope = -1.08 y-intercept = -3.78 RATIONALE We first want to get the slope. We can use the formula: To then get the intercept, we can solve for the y-intercept by using the following formula: y with hat on top equals b subscript 0 plus b subscript 1 x We know the slope, b subscript 1, and we can use the mean of x and the mean of y for the variables x and y with hat on top to solve for the y-intercept, b subscript 0. CONCEPT Finding the Least-Squares Line I need help with this question 6 In a study of 30 high school students, researchers found a high correlation, 0.93, between amount of exercise and weight lost. Which of the following statements is TRUE? There is a strong positive linear association between weight loss and exercise, but the researchers have not proven causation. The researchers proved that exercise causes weight loss, but only for high school students. The researchers proved that exercise causes weight loss. 93% of the high school students studied lost weight. RATIONALERecall that correlation measures the strength and direction of linear association. So r= 0.93 indicates a strong positive linear association. Recall also, that correlation doesn't imply causation. Causation is a direct change in one variable causing a change in some outcome. CONCEPT Correlation and Causation I need help with this question 7 For the data plotted in the scatterplot, the r2 value was calculated to be 0.9846. Which of the following sets of statements is true? 98.5% of the variation in age is explained by a linear relationship with yearly income. The correlation coefficient, r, is 0.969. 98.5% of the variation in yearly income is explained by a nonlinear relationship with age. The correlation coefficient, r, is 0.992. 98.5% of the variation in yearly income is explained by a linear relationship with age.The correlation coefficient, r, is 0.992 98.5% of the variation in age is explained by a nonlinear relationship with yearly income. The correlation coefficient, r, is 0.969. RATIONALE The coefficient of determination measures the percent of variation in the outcome, y, explained by the regression. So a value of 0.9846 tells us the regression with age, x, can explain about 98.5% of the variation in income, y. We can also note that r = . CONCEPT Coefficient of Determination/r^2 I need help with this question 8 A correlation coefficient between average temperature and coat sales is most likely to be __________. between 1 and 2 between 0 and 1 between 0 and -1 between -1 and -2 RATIONALE If we note that as temp goes up, we would expect coats to be less necessary, so coat sales would go down. So correlation should be negative and this would be between 0 and -1. CONCEPT Positive and Negative Correlations I need help with this question 9 Thomas was interested in learning more about the salary of a teacher. He believed as a teacher increases in age, the annual earnings also increases. The age (in years) is plotted against the earnings (in dollars) as shown below. [Show More]
Last updated: 2 years ago
Preview 1 out of 18 pages
Buy this document to get the full access instantly
Instant Download Access after purchase
Buy NowInstant download
We Accept:

Reviews( 0 )
$14.00
Can't find what you want? Try our AI powered Search
Document information
Connected school, study & course
About the document
Uploaded On
Apr 14, 2021
Number of pages
18
Written in

Additional information
This document has been written for:
Uploaded
Apr 14, 2021
Downloads
0
Views
78
.png)