Computer Science > eBook[PDF] > PDF(eBook) Learning d3.js Data Visualization, Ændrew Rininsland Swizec Teller Publisher,Packt Publi (All)
PDF(eBook) Learning d3.js Data Visualization, Ændrew Rininsland Swizec Teller Publisher,Packt Publishing,2e
Document Content and Description Below
Last updated: 10 months ago
Preview 5 out of 325 pages
Instant download

Loading document previews ...
Buy this Document to get the Full Access Instantly
Provided by Students Who Aced it
We Verify Document Content to Gurantee Accuracy
Reviews( 0 )
Document information
Connected school, study & course
About the document
Uploaded On
Sep 09, 2025
Number of pages
325
Written in
All

Additional information
This document has been written for:
Uploaded
Sep 09, 2025
Downloads
0
Views
25
Document Keyword Tags
Recommended For You
Get more on eBook[PDF] »
eBook for Concepts of Programming Languages 12th Edition By R...
![Preview of eBook [PDF] Gray Hat Hacking The Ethical Hacker's Handbook 6th Edition By Allen Harper, Ry](https://browseimages.nyc3.digitaloceanspaces.com/paper-images/2025/Aug/24/lpRHB6th2025-08-24-04-5468aa70ca8c5b8.png)
eBook [PDF] Gray Hat Hacking The Ethical Hacker's Handbook 6th...
eBook 3D Printed Conducting Polymers Fundamentals, Advances, a...
![Preview of eBook [PDF] Computer Vision Challenges, Trends, and Opportunities 1st Edition By Md Atiqur](https://browseimages.nyc3.digitaloceanspaces.com/paper-images/2024/Aug/30/sO1Ff4FE2024-08-30-02-3766d1af0994f96.png)
eBook [PDF] Computer Vision Challenges, Trends, and Opportunit...
eBook Computer Vision, Challenges, Trends, and Opportunities,1...

eBook Digital Personality, A Man Forever Volume 2 Technical As...

eBook Dynamic Equations on Time Scales and Applications Edited...


![Preview of [eBook] [PDF] computer systems application By Viktor Boradin](https://browseimages.nyc3.digitaloceanspaces.com/paper-images/2025/Jul/04/m6aK7PpK2025-07-04-06-126867ef554a843.png)
[eBook] [PDF] computer systems application By Viktor Boradin

Introduction to Programming with Java A Problem Solving Approa...
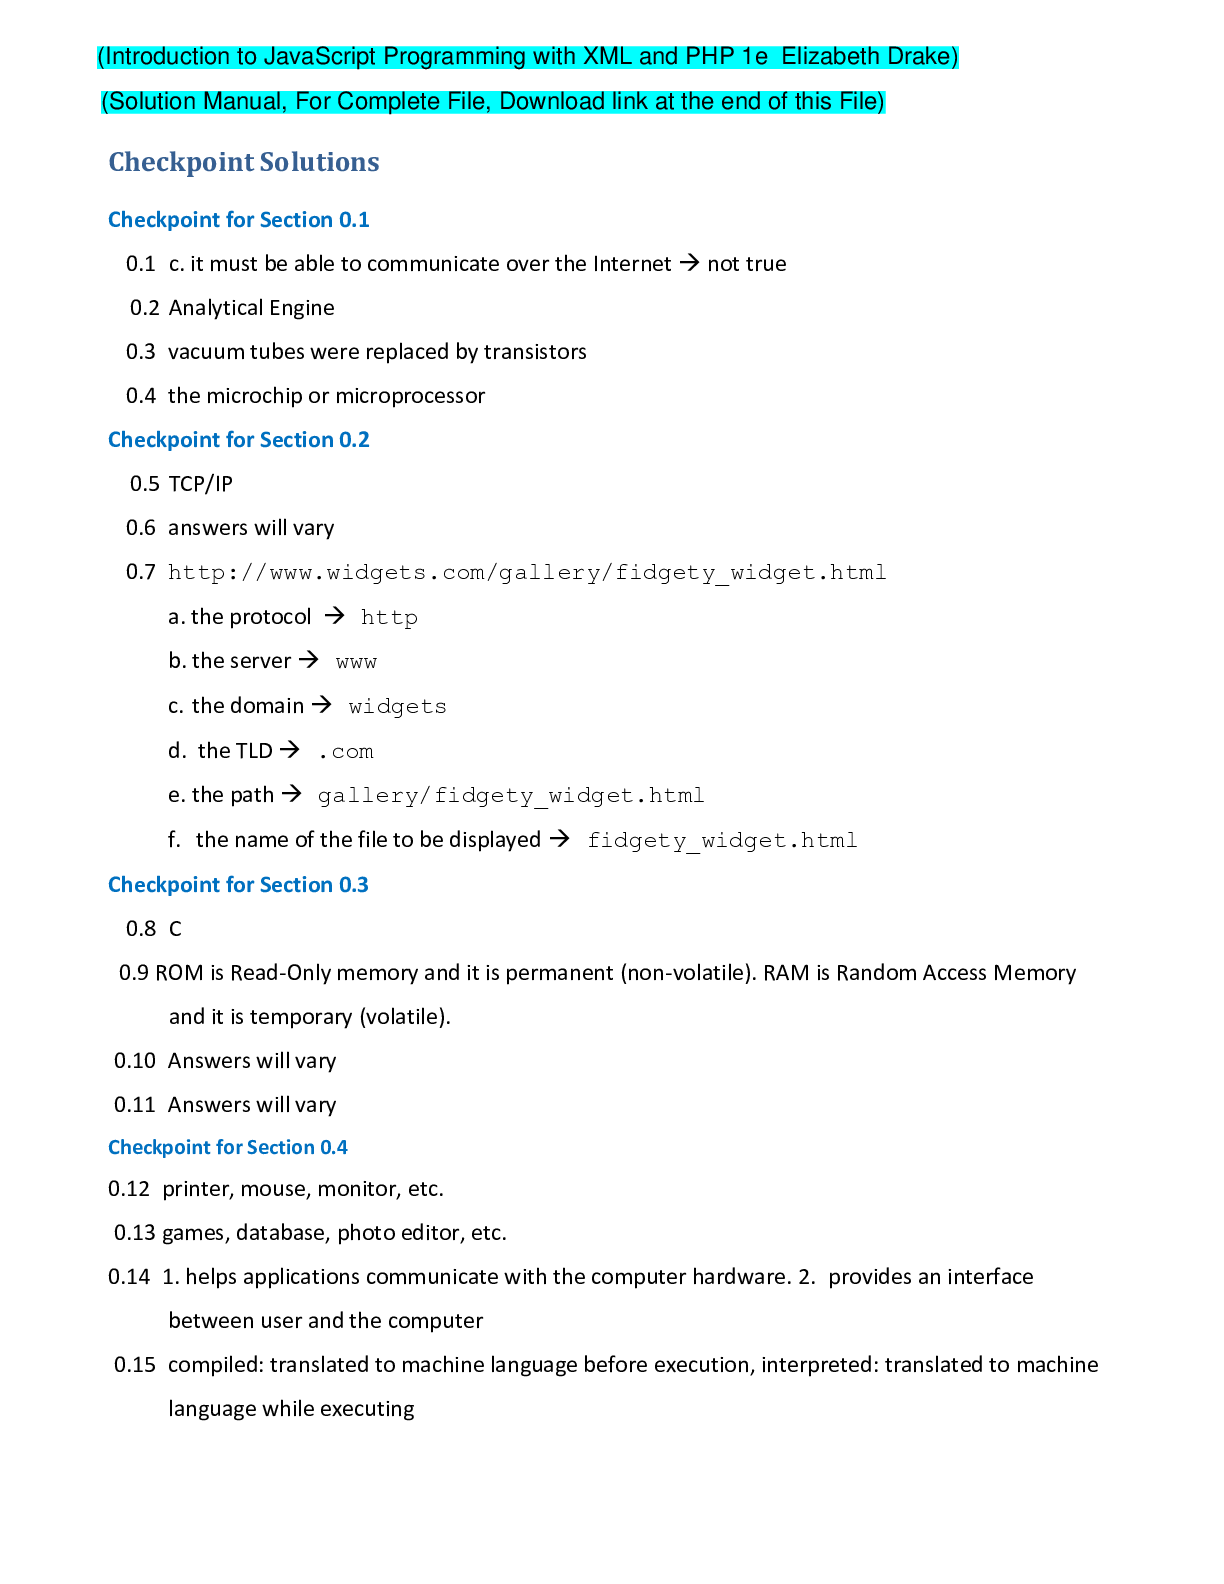
Introduction to JavaScript Programming with XML and PHP 1st Ed...