Name: ___Anthony Vargas and Ada Lin_________________
INTRODUCTION
Did you ever wonder why some environments had dozens of different organisms that lived there, while others
seemed to be inhabited by only a few kinds o
...
Name: ___Anthony Vargas and Ada Lin_________________
INTRODUCTION
Did you ever wonder why some environments had dozens of different organisms that lived there, while others
seemed to be inhabited by only a few kinds of organisms? The biodiversity of an ecosystem acts as an
indicator of overall ecosystem health, and can tell you a lot about that ecosystem. There are several different
methods that can be employed to measure ecosystem biodiversity. One such measure is the Simpson’s
Diversity Index.
Biodiversity will increase naturally as succession occurs in an ecosystem--as an ecosystem ages and
reaches its climax community, the number of species occupying various niches increases which can act as an
indicator of ecosystem stability. There are two factors that comprise biodiversity: species richness and
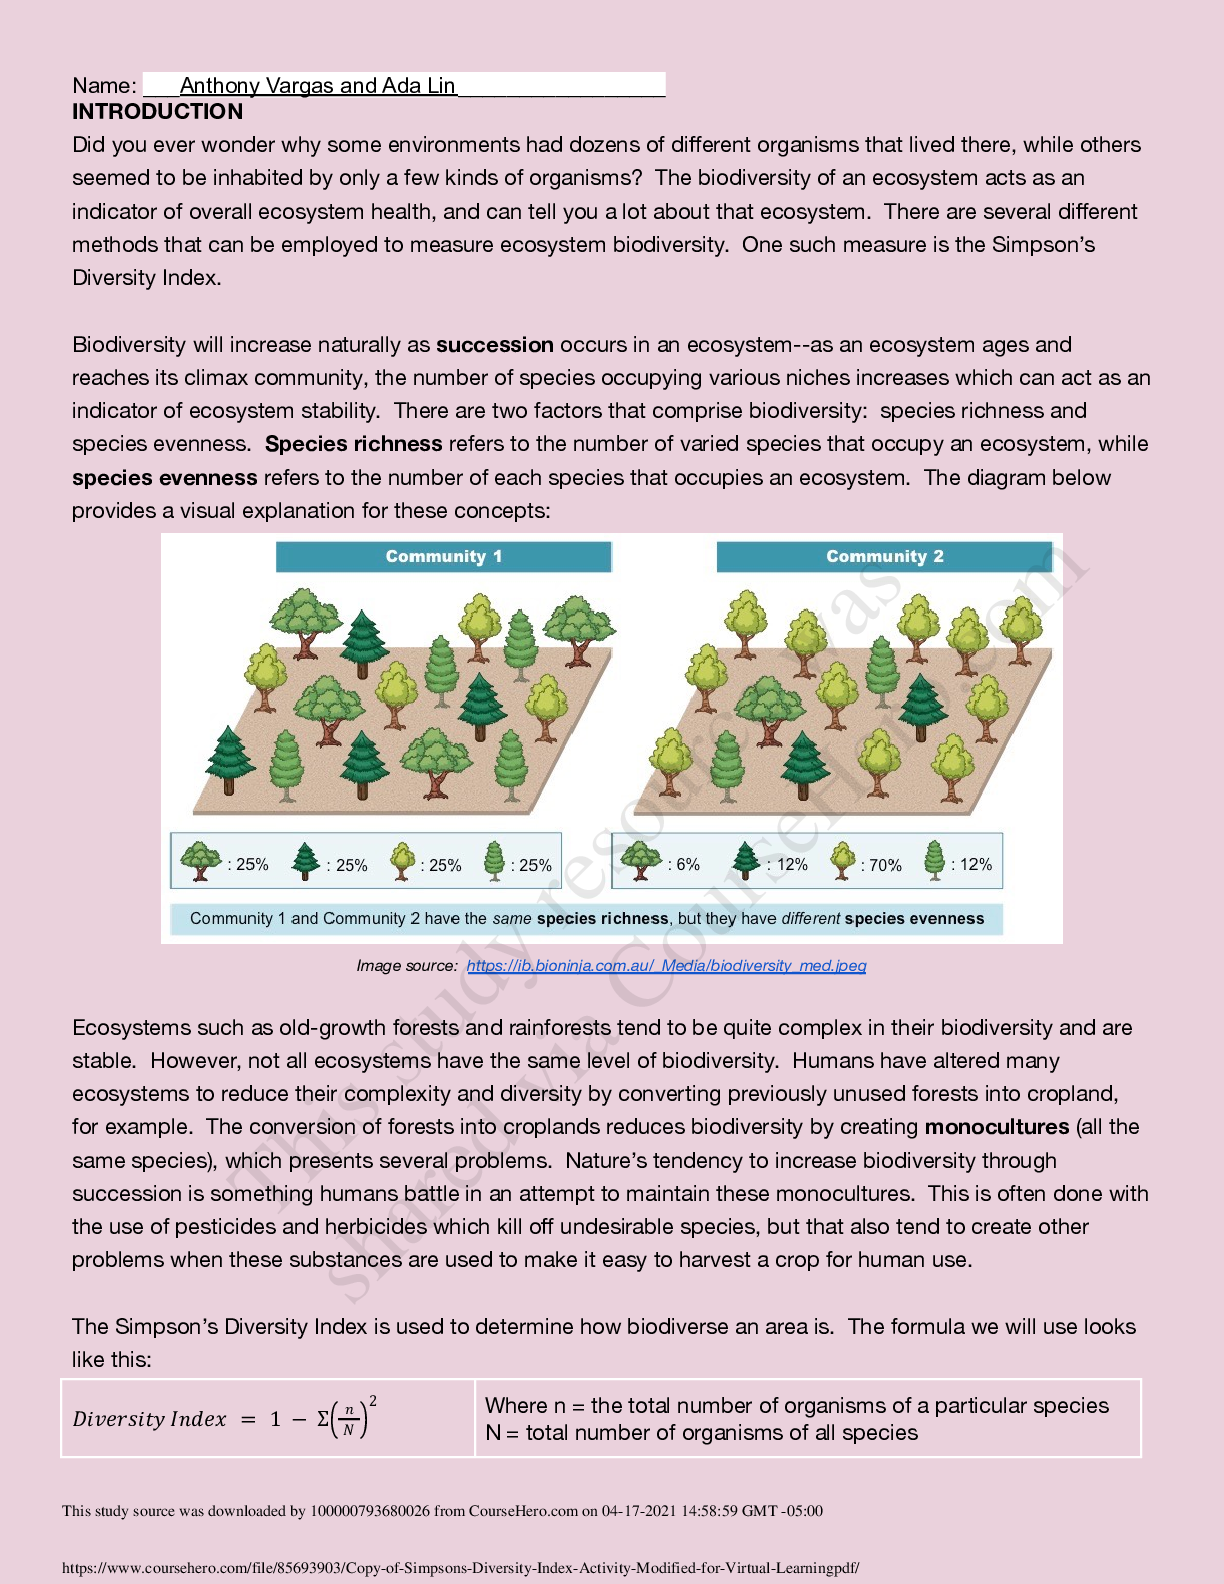
species evenness. Species richness refers to the number of varied species that occupy an ecosystem, while
species evenness refers to the number of each species that occupies an ecosystem. The diagram below
provides a visual explanation for these concepts:
Image source: https://ib.bioninja.com.au/_Media/biodiversity_med.jpeg
Ecosystems such as old-growth forests and rainforests tend to be quite complex in their biodiversity and are
stable. However, not all ecosystems have the same level of biodiversity. Humans have altered many
ecosystems to reduce their complexity and diversity by converting previously unused forests into cropland,
for example. The conversion of forests into croplands reduces biodiversity by creating monocultures (all the
same species), which presents several problems. Nature’s tendency to increase biodiversity through
succession is something humans battle in an attempt to maintain these monocultures. This is often done with
the use of pesticides and herbicides which kill off undesirable species, but that also tend to create other
problems when these substances are used to make it easy to harvest a crop for human use.
The Simpson’s Diversity Index is used to determine how biodiverse an area is. The formula we will use looks
like this:
????????? ????? = 1 − Σ( ?? )2 W N h=etroetanl =nuthmebteortaolfnourgmabneisrmofsoorfgaalnl isspmescioefsa particular species
This study source was downloaded by 100000793680026 from CourseHero.com on 04-17-2021 14:58:59 GMT -05:00
https://www.coursehero.com/file/85693903/Copy-of-Simpsons-Diversity-Index-Activity-Modified-for-Virtual-Learningpdf/
This study resource was
shared via CourseHero.comThe index has values of 0 to 1. A large index value indicates a higher degree of biodiversity and a stable
ecosystem with many niches and little competition, while a lower value indicates a lower degree of
biodiversity which may indicate an ecosystem with a few dominant species and a greater degree of
competition.
In this activity, you’ll determine the Simpson’s Diversity Index for a model ecosystem, and then compare it to
others in the class. You’ll then be asked to consider factors that might contribute to the index value for your
particular ecosystem, and why. Finally, as a class, you’ll use the index value you calculate for each of the
ecosystems you analyze to determine which ecosystems are worth rescuing from disaster or human
intervention.
MATERIALS
Computer with web
access
Graph paper or graphing
software (excel/sheets)
Calculator Patience for virtual
counter ?
[Show More]














.png)