Business > EXAM > Liberty University BUSI 230 and MATH 201 Exam Review 1 and Exam 1 Power answer A+ Guarantee: (All)
Liberty University BUSI 230 and MATH 201 Exam Review 1 and Exam 1 Power answer A+ Guarantee:
Document Content and Description Below
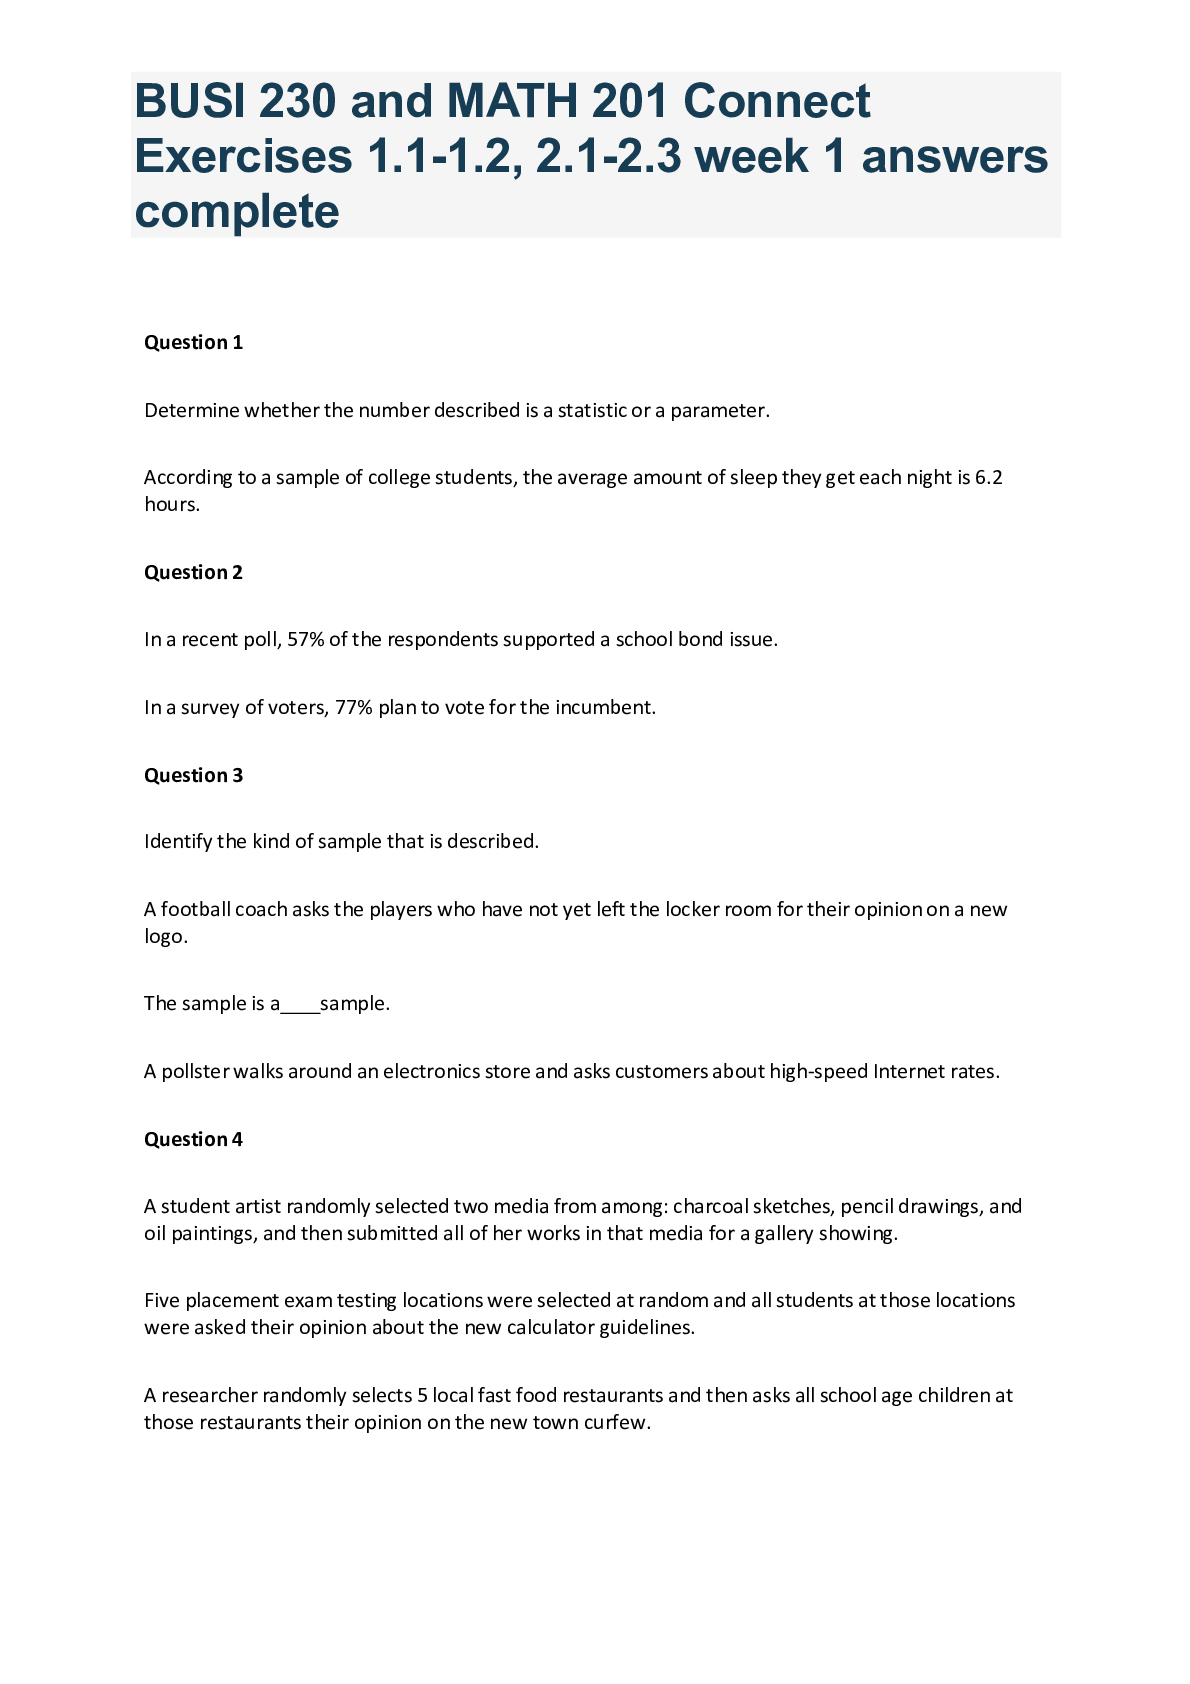
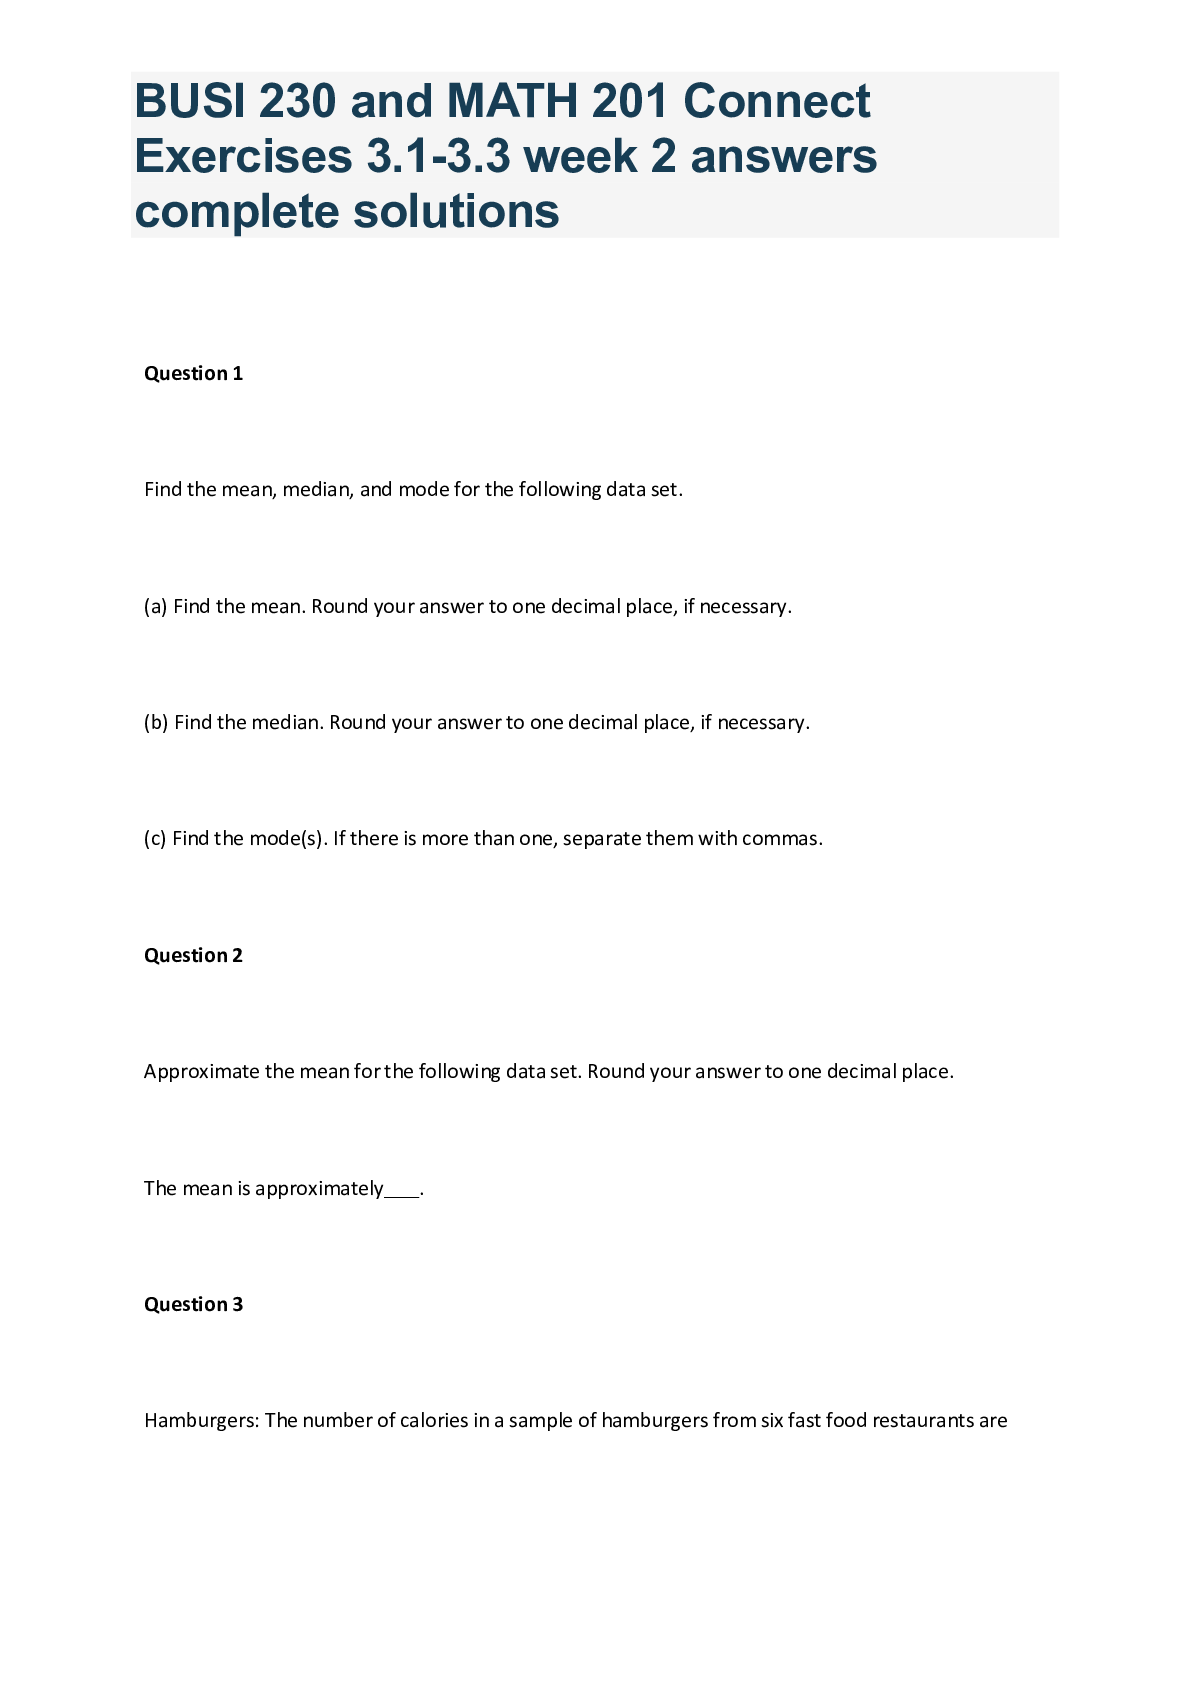
Liberty University BUSI 230 and MATH 201 Exam Review 1 and Exam 1 Power answer A+ Guarantee: https://liberty.selz.com/item/busi-230-exam-review-1-and-exam-1- liberty-university-answers-complete-solu... tions Question 1 54% of employees at a certain company are male. Question 2 In a survey of 500 high-school students, 60% of them said that they intended to go to college. Question 3 Identify the kind of sample that is described. A football coach asks the players who have not yet left the locker room for their opinion on a new logo. The sample is a sample. Question 4 In a large retail company, every employee is assigned a number and then every 50th one is selected to given their opinions about new employee benefits. Question 5 A salary committee for a Midwestern college uses a random number generator to select 40 employees based on their employee number and asks them questions about the proposed benefit package. A retailer samples 25 receipts from the past week by numbering all the receipts, generating a 25 random numbers, and sampling the receipts that correspond to these numbers. Question 6 A reality show posts phone numbers for each participant and asks viewers to phone in their favorite participant. Question 7 A researcher randomly selects 5 local fast food restaurants and then asks all school age children at those restaurants their opinion on the new town curfew. A football coach randomly selected the varisty or junior varsity team and then asks all players from that team their opinion on a new logo. Question 8 A sports columnist contacts a random sample of 3 owners, a random sample of 6 players, and a random sample of 20 fans to ask their opinion about the potential basketball lockout. Question 9 Determine whether the data described are qualitative or quantitative. Credit hours taken at a local community college. Question 10 Political party affiliations of survey respondents. The rate at which your heart beats. Question 11 The flavors of shaved ice treats are grape, cherry, orange, watermelon, and coconut. Question 12 I got an A in statistics, a B in biology, and C's in history and English. A nursery sells small, medium, and large trees. Question 13 The temperature of a pottery kiln. The amount of rainfall over the last year. Question 14 The number of times you login to your email account each day. Question 15 Following is a pie chart that presents the percentages of video games sold in each of four rating categories. Construct a frequency bar graph for the data. Round your answers to two decimal places. In which rating category are the least games sold? True or false: More than twice as many E-rated games are sold as M-rated games. True or false: More than twice as many E10-rated games are sold as T-rated games. True or false: More than twice as many E10-rated games are sold as M-rated games. True or false: Greater than one in three games sold is a T-rated game. Question 16 The following side-by-side bar graph presents the percentages of the sources of funds for food expenditures in the given years. The following side-by-side bar graph presents the percentages of the sources of funds for food expenditures in the given years. Which sources of funds for food expenditures increased or decreased as a proportion of the total in the given years? In 1940, the smallest source of funds for food expenditures was Governments. Is this the smallest source of funds in 2012? In 1940, the largest source of funds for food expenditures was Families and individuals. Is this the largest source of funds in 2012? Question 17 Construct a relative frequency distribution. Round the answers to two decimal places. Construct a relative frequency bar graph. Question 18 and 19 Classify the histogram as skewed to the left, skewed to the right, or approximately symmetric. Question 20 (a) Construct a frequency distribution using a class width of 5, and using 55 as the lower class limit for the first class. (b) Construct a frequency histogram from the frequency distribution in part (a). Question 21 The following frequency distribution presents the number of murders (including negligent manslaughter) per 100,000 population for each U.S. city with population over 250,000 in the year 2011. Find the midpoints for the classes. Construct a frequency polygon for the frequency distribution. Question 22 Construct a frequency ogive for the frequency distribution. Question 23 Following are the running times (in minutes) for the 12 top-grossing movies rated PG or PG-13, and the 12 top-grossing movies rated R, for the recent weekend. Construct back-to-back stem-and-leaf plots for these data sets. If there are no leaves on a particular stem, select the "None" button. Question 24 (a) Construct a dotplot for these data. (b) Are there any gaps in the data? Question 25 What was the first year that the coverage dropped below 14 million square kilometers? What was the first year that the coverage dropped below 13 million square kilometers? Question 26 Find the mean and median. Find the mode(s). If there is more than one, separate them with commas. Question 27 Approximate the mean for the following data set. Round your answer to one decimal place. Question 28 (a) Find the mean and median price in May. Round the answers to two decimal places. (b) Find the mean and median price in June. Round the answers to two decimal places. (c) Does there appear to be a substantial difference in price between May and June, or are the prices about the same? Question 29 (a) Find the sample standard deviation for the weights for the offensive linemen. Round the answer to at least one decimal point. (b) Find the sample standard deviation for the weights for the defensive linemen. Round the answer to at least one decimal point. Question 30 (a) Find the population standard deviation of the ratings for 2007-2008. Round the answer to at least two decimal places. The population standard deviation of the ratings for 2007-2008 is %. (b) Find the population standard deviation of the ratings for 2012-2013. Round the answer to at least two decimal places. The population standard deviation of the ratings for 2012-2013 is %. Question 31 (a) Estimate the percentage of amounts that were less than $37.68. Round the answer to one decimal place. (b) Estimate the percentage of amounts that were greater than $45.90. Round the answer to one decimal place. (c) Estimate the percentage of amounts that were between $43.16 and $48.64. Round the answer to one decimal place. Question 32 (a) Find the z-score for a population value of 1. (b) Find the z-score for a population value of 23. (c) What number has a z-score of 0.2? Question 34 Find the upper and lower outlier boundaries. A systolic blood pressure greater than is considered high. Would a blood pressure of be an outlier? Question 35 (a) Find the first and third quartiles of these data. (b) Find the median of these data. (c) Find the upper and lower outlier boundaries. (d) Determine the outliers. Question 36 (a) What is the 23rd percentile? (b) What is the 66th percentile? Question 37 Caffeine: Following are the number of grams of carbohydrates in 12-ounce espresso beverages offered at a coffee shop. Construct a boxplot for these data. The first quartile is 23, median is 31, and third quartile is 39. Construct a boxplot for the given data (including outliers if any). A student artist numbers her pieces and selects every 4th one for a gallery showing. A salary committee for a Midwestern college sends an email to all employees asking them to fill out an optional online survey about the proposed benefit package. Five hundred people attend a charity event, and each buys a raffle ticket. The 500 ticket stubs are put in a drum and thoroughly mixed, and 10 of them are drawn. The 10 people whose tickets are drawn win a prize. Time it takes to run a marathon. Styles of shoes. The number of pixels in a cellphone display. The average age of the employees in a certain company is 35 years. Of the students enrolled in a certain college, 80% are full-time. According to a sample of college students, the average amount of sleep they get each night is 6.2 hours. In a large retail company, all store managers ask all employees currently working to give their opinions about new employee benefits. A representative of the student government association at a certain college stands at the door of the library and asks all students who enter about a new grading policy. A caterer is competing for a company's business. The caterer selects every 3rd item off the menu for a tasting. A football coach uses a random number generator to draw a sample of players based on their jersey number to ask them about the new logo. A smartphone app produces a message requesting customers to click on a link to rate the app. In a large retail company, a note is placed with each employee's paycheck inviting them to post their opinion about new employee benefits on a blog on the company's website. Officials at a metropolitan tranist authority want to get input from people who use a certain bus route about a possible change in the schedule. They randomly select 5 buses during a certain week and poll all riders on those buses about the change. A news reporter at a family amusement park asked a random sample of 20 kids and a random sample of 20 adults about their experience at the park. The horsepower of motorcycles in a dealership. Academic departments at a university. In my coffee I like cream, sugar, honey, and cinnamon. My grades this semester were C, D, A, and B. Determine whether the data described are discrete or continuous. The number of keys on your key ring. The number of questions on a test. The length of time that a cell phone stays charged. Which of the visual displays below has the correctly ordered categories along the x-axis for a relative frequency Pareto chart of the data? Construct a relative frequency Pareto chart of the data. Round your answers to two decimal places. In which rating category are the most games sold? True or false: Greater than one in four games sold is an E-rated game. True or false: Greater than one in five games sold is an E10-rated game. Which sources of funds for food expenditures increased or decreased as a proportion of the total in the given years? In 1940, the smallest source of funds for food expenditures was Businesses. Is this the smallest source of funds in 2012? In 1940, the largest source of funds for food expenditures was Families and individuals. Is this the largest source of funds in 2012? Hospital admissions: The following frequency distribution presents the five most frequent reasons for hospital admissions in U.S. community hospitals in a recent year. The geyser Old Faithful in Yellowstone National Park alternates periods of eruption, which typically last from 1.5 to 4 minutes, with periods of dormancy, which are considerably longer. The following table presents the durations, in minutes, of 30 dormancy periods that occurred during a recent year. The following frequency distribution presents the batting averages of Major League Baseball players who had 300 or more plate appearances during the 2012 season. The following table presents the daily high temperatures for the city of Macon, Georgia, in degrees Fahrenheit, for the winter months of January and February in a recent year. The following time-series plot presents the extent of ice coverage (in millions of square kilometers) in the Arctic region on January 1st of each year from 1989 through 2013. Find the mean, median, and mode for the following data set. Round your answers to one decimal place, if necessary. Stock prices: Following are the closing prices of a particular stock for each trading day in May and June of a recent year. Heavy football players: Following are the weights, in pounds, for offensive and defensive linemen on a professional football team at the beginning of a recent year. What's your favorite TV show? The following tables present the ratings for 8 top prime-time shows for the 2007-2008 and for the 2012-2013 season. The rating is the percentage of households with TV sets that watched the program. Lunch break: In a recent survey of 631 working Americans ages 25-34, the average weekly amount spent on lunch as $43.16 with standard deviation $2.74. The weekly amounts are approximately bell- shaped. A population has mean 17 and standard deviation 5. Round the answers to two decimal places as needed. Blood pressure in women: The three quartiles for systolic blood pressure in a sample of 1213 women were Q1=95, Q2=107, and Q3=112. Cholesterol levels: A national health survey measured the serum HDL cholesterol levels in a large number of women. Following is a sample of 40 HDL levels (in milligrams per deciliter) that are based on the results of that survey. They have been sorted into numerical order. Cholesterol levels: A national health survey measured the serum HDL cholesterol levels in a large number of women. Following is a sample of 40 HDL levels (in milligrams per deciliter) that are based on the results of that survey. The list has been sorted into numerical order. True or false: On the average, families spent less on cereals and bakery products than on fruits and vegetables. The director of a hospital pharmacy chooses at random 100 people age 60 or older from each of three surrounding counties to ask their opinions of a new prescription drug program. Salary committee members for a Midwestern college asked everyone who attended the college picnic for their opinion regarding the proposed benefit package. [Show More]
Last updated: 2 years ago
Preview 1 out of 17 pages

Buy this document to get the full access instantly
Instant Download Access after purchase
Buy NowInstant download
We Accept:

Reviews( 0 )
$8.00
Can't find what you want? Try our AI powered Search
Document information
Connected school, study & course
About the document
Uploaded On
Apr 19, 2021
Number of pages
17
Written in

Additional information
This document has been written for:
Uploaded
Apr 19, 2021
Downloads
0
Views
137