MSIS 3223 QUIZZES QUESTIONS AND 100% VERIFIED ANSWERS
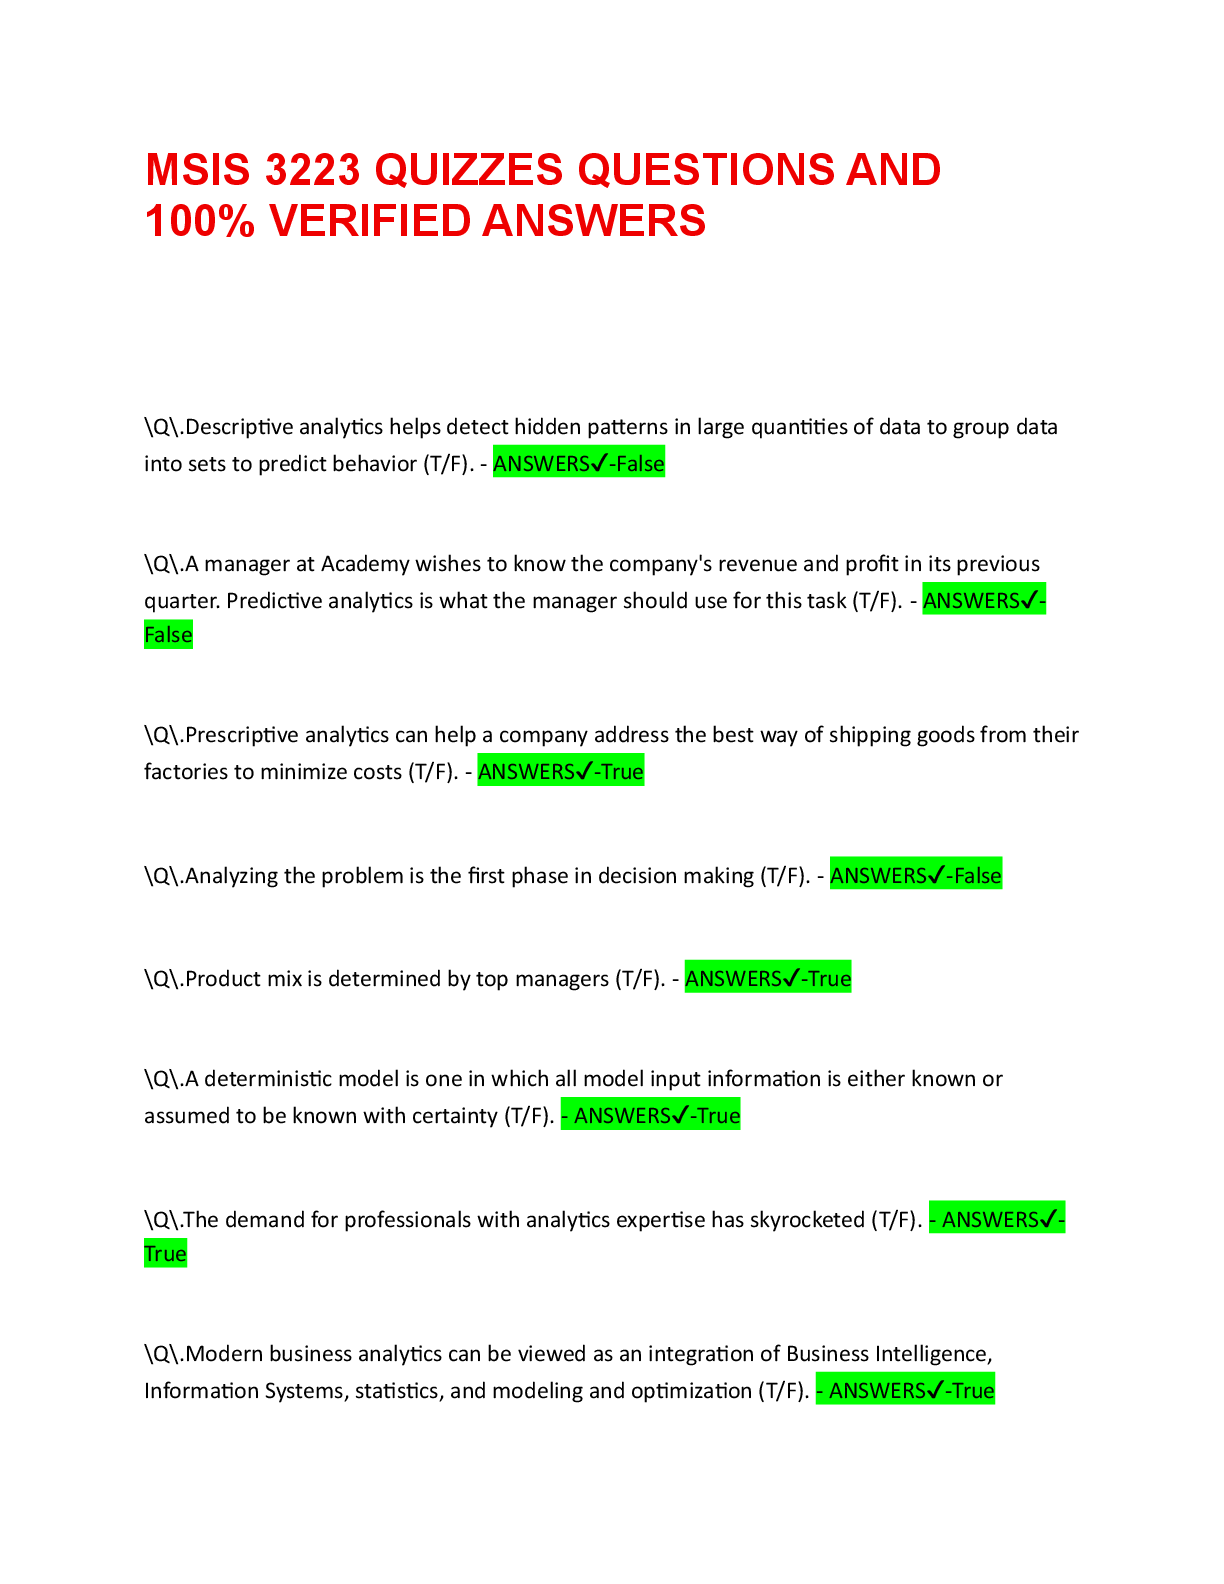
\Q\.Descriptive analytics helps detect hidden patterns in large quantities of data to group data into sets to predict behavior (T/F). - ANSWERS✔-False
\Q\.A
...
MSIS 3223 QUIZZES QUESTIONS AND 100% VERIFIED ANSWERS
\Q\.Descriptive analytics helps detect hidden patterns in large quantities of data to group data into sets to predict behavior (T/F). - ANSWERS✔-False
\Q\.A manager at Academy wishes to know the company's revenue and profit in its previous quarter. Predictive analytics is what the manager should use for this task (T/F). - ANSWERS✔-False
\Q\.Prescriptive analytics can help a company address the best way of shipping goods from their factories to minimize costs (T/F). - ANSWERS✔-True
\Q\.Analyzing the problem is the first phase in decision making (T/F). - ANSWERS✔-False
\Q\.Product mix is determined by top managers (T/F). - ANSWERS✔-True
\Q\.A deterministic model is one in which all model input information is either known or assumed to be known with certainty (T/F). - ANSWERS✔-True
\Q\.The demand for professionals with analytics expertise has skyrocketed (T/F). - ANSWERS✔-True
\Q\.Modern business analytics can be viewed as an integration of Business Intelligence, Information Systems, statistics, and modeling and optimization (T/F). - ANSWERS✔-True
\Q\.Statistics has a long and rich history, yet only rather recently has it been recognized as an important element of business, driven to a large extent by the massive growth of data in today's world (T/F). - ANSWERS✔-True
\Q\.Decision models typically have three types of input: Data, uncontrollable inputs, and decision options (T/F). - ANSWERS✔-True
\Q\.AND(condition 1, condition 2...) is a logical function that returns TRUE if all conditions are true and FALSE if not (T/F). - ANSWERS✔-True
\Q\.The Pareto principle is often called the "80--20 rule" (T/F). - ANSWERS✔-True
\Q\.The filter tool extracts records meeting the specified criteria, deleting any records that don't match the criteria (T/F). - ANSWERS✔-False
\Q\.Three useful logical functions in business analytics applications are IF, AND, and OR followed by conditions in parentheses (T/F). - ANSWERS✔-True
\Q\.Form controls are buttons, boxes, and other mechanisms for inputting or changing data on spreadsheets easily and used to design user-friendly spreadsheets (T/F). - ANSWERS✔-True
\Q\.PivotTables may be used to facilitate data visualization and statistical analysis of data sets (T/F). - ANSWERS✔-True
\Q\.Excel has a tool called 'dicers' for drilling down data in a PivotTable to display as subject of that data (T/F). - ANSWERS✔-False
\Q\.A database is a collection of related files (tables) containing records on people, places, or things (T/F). - ANSWERS✔-True
\Q\.Empirical data is data that comes from an organization's daily operations (T/F). - ANSWERS✔-False
\Q\.A data set is simply a collection of data (T/F). - ANSWERS✔-True
\Q\.Dashboards may include tabular as well as visual data to help a manager to quickly locate key information (T/F). - ANSWERS✔-True
\Q\.Excel distinguishes between vertical and horizontal bar charts, calling the former column charts and the latter bar charts (T/F). - ANSWERS✔-True
\Q\.Line charts provide a useful means for displaying data over time (T/F). - ANSWERS✔-True
\Q\.A bubble chart is a type of scatter chart that provides a way to plot three variables in two dimensions (T/F). - ANSWERS✔-True
\Q\.Color scales shade scales based on their numerical value using a color palette. This is an option in the Conditional Formatting menu (T/F). - ANSWERS✔-True
\Q\.Data visualization is the process of displaying data in a meaningful fashion to provide insights that will support better decisions (T/F). - ANSWERS✔-True
\Q\.An area chart combines the features of bubble charts with those of line charts (T/F). - ANSWERS✔-False
[Show More]