Economics > QUESTIONS & ANSWERS > Introduction to Econometrics Columbia UniversityECON W3412ps1_sol_Fall 2020 (1) (All)
Introduction to Econometrics Columbia UniversityECON W3412ps1_sol_Fall 2020 (1)
Document Content and Description Below
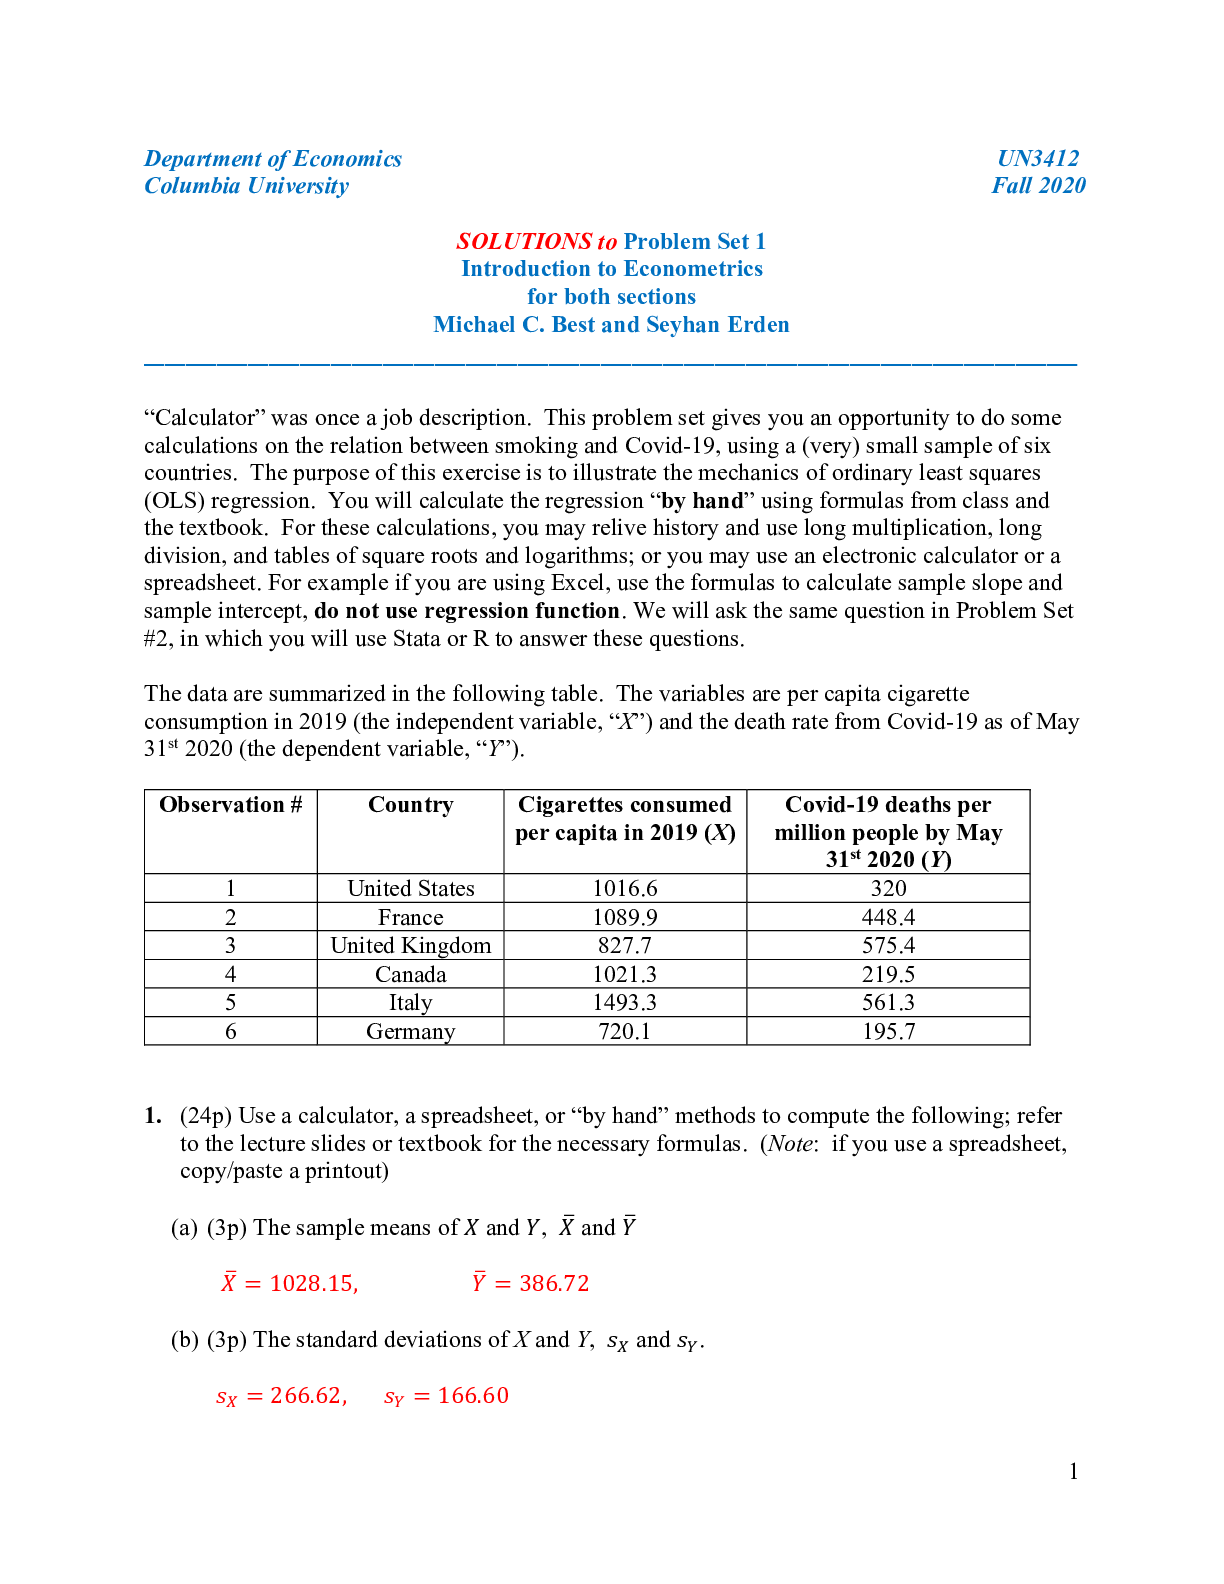
Department of Economics UN3412 Columbia University Fall 2020 SOLUTIONS to Problem Set 1 Introduction to Econometrics for both sections Michael C. Best and Seyhan Erden __________________________... ________________________________________________________________ “Calculator” was once a job description. This problem set gives you an opportunity to do some calculations on the relation between smoking and Covid-19, using a (very) small sample of six countries. The purpose of this exercise is to illustrate the mechanics of ordinary least squares (OLS) regression. You will calculate the regression “by hand” using formulas from class and the textbook. For these calculations, you may relive history and use long multiplication, long division, and tables of square roots and logarithms; or you may use an electronic calculator or a spreadsheet. For example if you are using Excel, use the formulas to calculate sample slope and sample intercept, do not use regression function. We will ask the same question in Problem Set #2, in which you will use Stata or R to answer these questions. The data are summarized in the following table. The variables are per capita cigarette consumption in 2019 (the independent variable, “X”) and the death rate from Covid-19 as of May 31st 2020 (the dependent variable, “Y”). Observation # Country Cigarettes consumed per capita in 2019 (X) Covid-19 deaths per million people by May 31st 2020 (Y) 1 United States 1016.6 320 2 France 1089.9 448.4 3 United Kingdom 827.7 575.4 4 Canada 1021.3 219.5 5 Italy 1493.3 561.3 6 Germany 720.1 195.7 1. (24p) Use a calculator, a spreadsheet, or “by hand” methods to compute the following; refer to the lecture slides or textbook for the necessary formulas. (Note: if you use a spreadsheet, copy/paste a printout) (a) (3p) The sample means of ? and ?, ?# and ?# ?# = 1028.15, ?# = 386.72 (b) (3p) The standard deviations of X and Y, ?1 and ?2. ?1 = 266.62, ?2 = 166.602 (c) (3p) Covariance X and Y, ?12. ?12 = 21590.7 (d) (3p) The correlation coefficient, r, between X and Y ? = 0.486 (e) (3p) ?78, the OLS estimated slope coefficient from the regression ?9 = ?7: + ?78?9 + ?9 ?78 = 0.3037 (f) (3p) ?7:, the OLS estimated intercept term from the same regression ?7: = 74.44 (g) (3p) ?=9, ? = 1, … , ?, the predicted values for each country from the regression [Show More]
Last updated: 2 years ago
Preview 1 out of 13 pages
Buy this document to get the full access instantly
Instant Download Access after purchase
Buy NowInstant download
We Accept:

Reviews( 0 )
$10.00
Can't find what you want? Try our AI powered Search
Document information
Connected school, study & course
About the document
Uploaded On
May 14, 2021
Number of pages
13
Written in

Additional information
This document has been written for:
Uploaded
May 14, 2021
Downloads
0
Views
48


