19 questions were answered correctly. 5 questions were answered incorrectly. 1
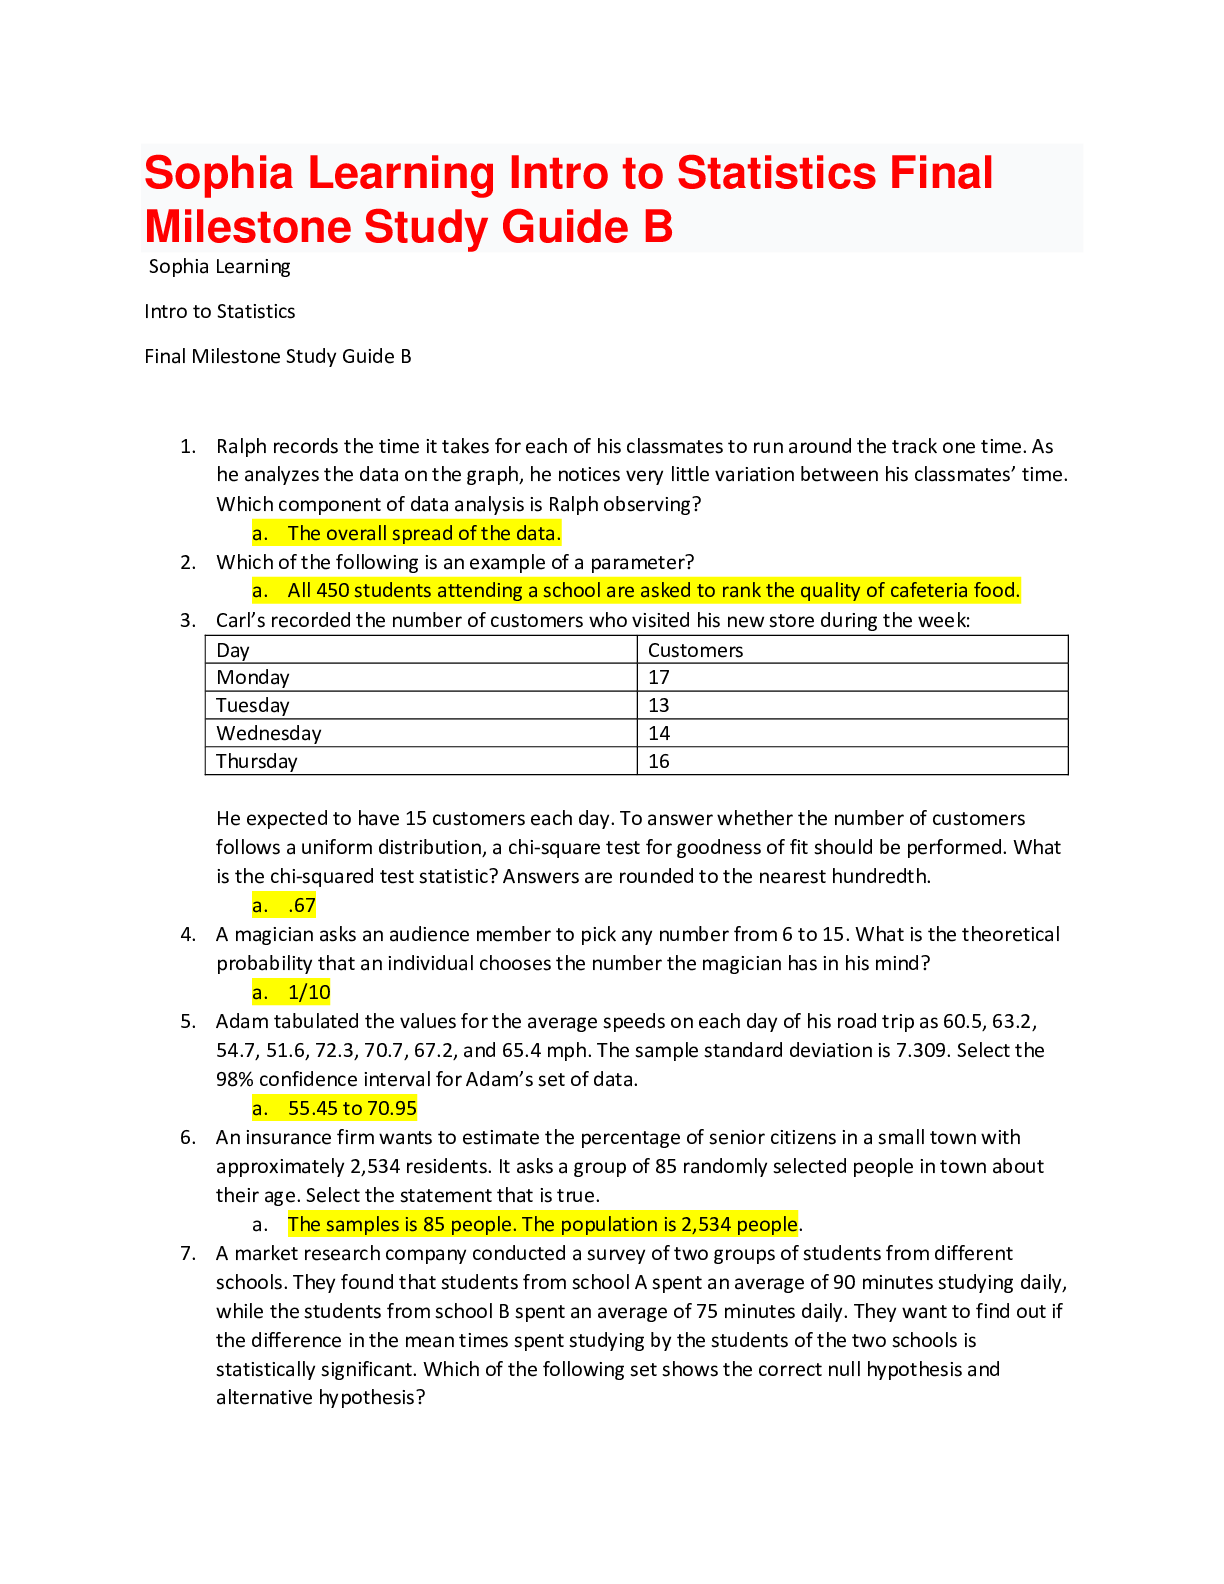
Adam tabulated the values for the average speeds on each day of his road trip as 60.5, 63.2, 54.7, 51.6, 72.3, 70.7, 67.2, and 65.4 mph. The
...
19 questions were answered correctly. 5 questions were answered incorrectly. 1
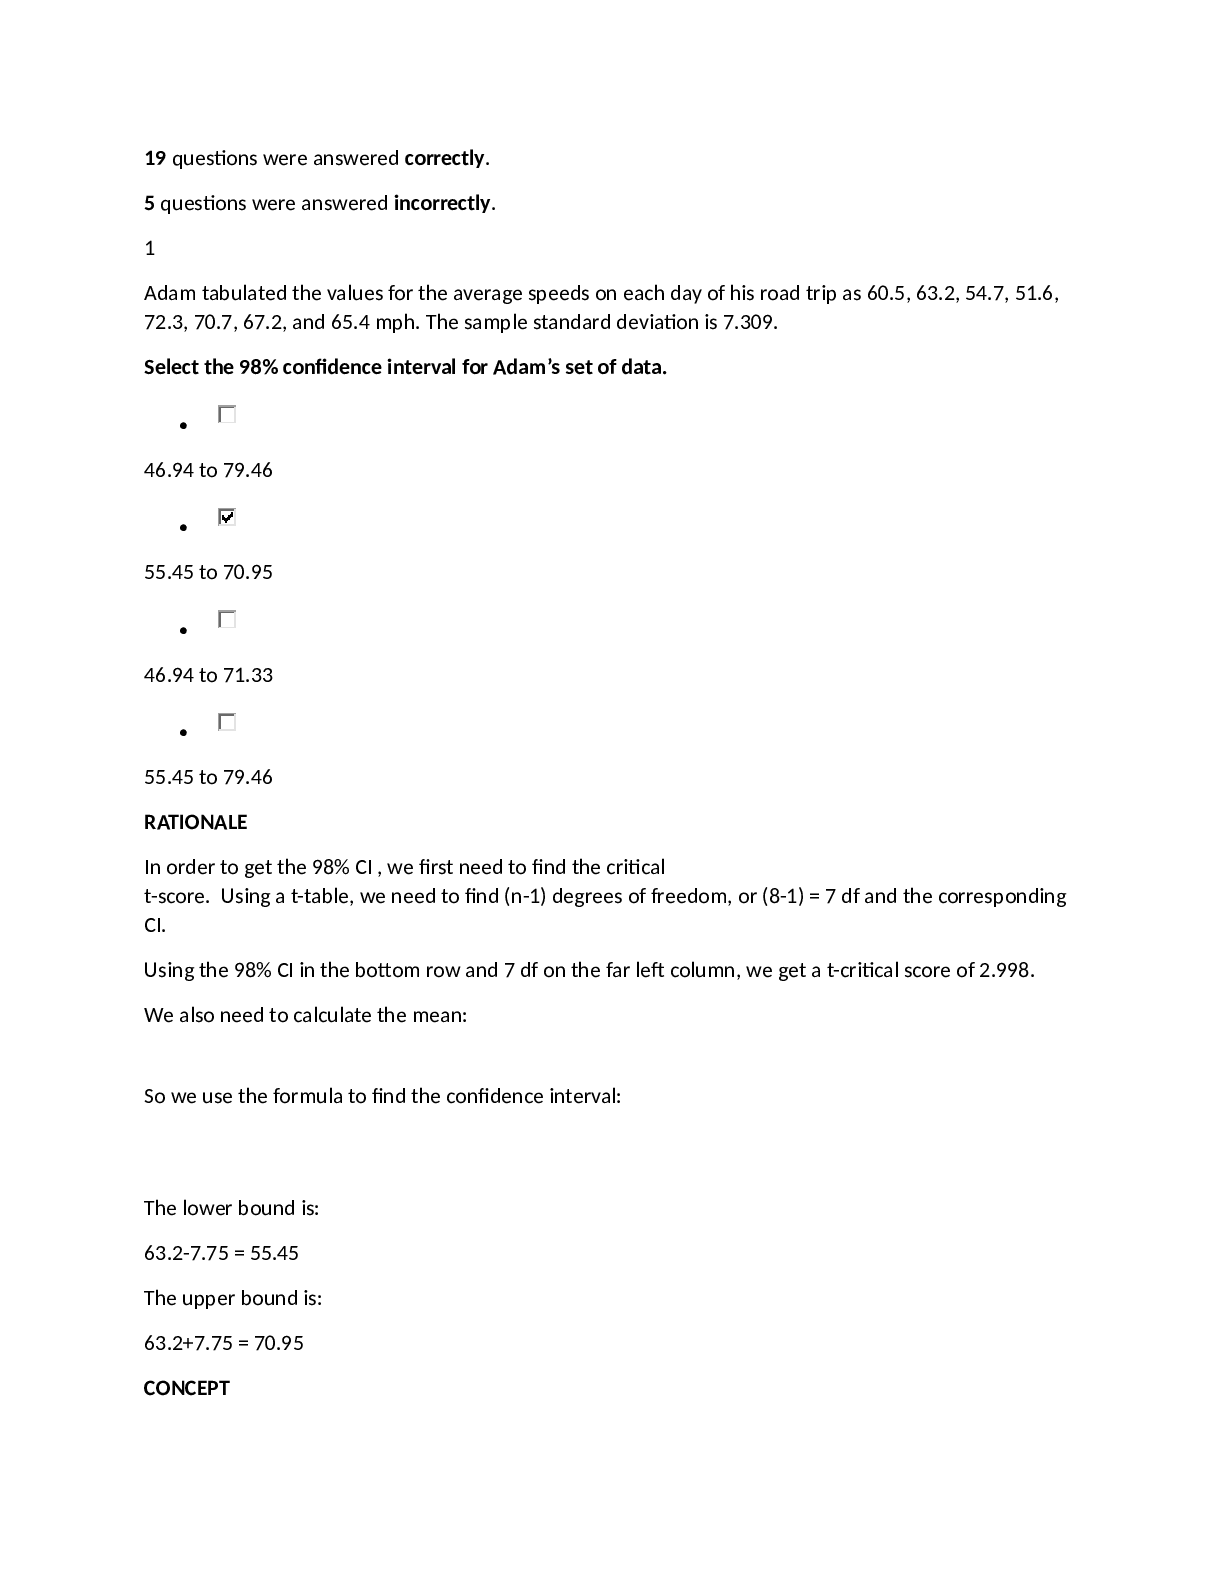
Adam tabulated the values for the average speeds on each day of his road trip as 60.5, 63.2, 54.7, 51.6, 72.3, 70.7, 67.2, and 65.4 mph. The sample standard deviation is 7.309.
Select the 98% confidence interval for Adam’s set of data.
•
46.94 to 79.46
•
55.45 to 70.95
•
46.94 to 71.33
•
55.45 to 79.46
RATIONALE
In order to get the 98% CI , we first need to find the critical
t-score. Using a t-table, we need to find (n-1) degrees of freedom, or (8-1) = 7 df and the corresponding CI.
Using the 98% CI in the bottom row and 7 df on the far left column, we get a t-critical score of 2.998. We also need to calculate the mean:
So we use the formula to find the confidence interval:
The lower bound is:
63.2-7.75 = 55.45
The upper bound is: 63.2+7.75 = 70.95 CONCEPT
Confidence Intervals Using the T-Distribution
2
A table represents the number of students who passed or failed an aptitude test at two different campuses.
In order to determine if there is a significant difference between campuses and pass rate, the chi-square test for association and independence should be performed.
What is the expected frequency of South Campus and passed?
•
50 students
•
36.5 students
•
42 students
•
43.7 students
RATIONALE
In order to get the expected counts we can note the formula is:
CONCEPT
Chi-Square Test for Homogeneity
3
Sukie interviewed 125 employees at her company and discovered that 21 of them planned to take an extended vacation next year.
What is the 95% confidence interval for this population proportion? Answer choices are rounded to the hundredths place.
•
0.10 to 0.23
•
0.16 to 0.17
•
0.11 to 0.16
•
0.11 to 0.21
RATIONALE
In order to get the CI we want to use the following form.
First, we must determine the corresponding z*score for 95% Confidence Interval. Remember, this means that we have 5% for the tails, meaning 5%, or 0.025, for each tail. Using a z-table, we can find the upper z-score by finding (1 - 0.025) or 0.975 in the table.
This corresponding z-score is at 1.96. We can know
So putting it all together:
The lower bound is:
0.168-0.065 =0.103 or 0.10
The upper bound is:
0.168+0.065 =0.233 or 0.23
CONCEPT
Confidence Interval for Population Proportion
4
A market research company conducted a survey of two groups of students from different schools. They found that students from school A spent an average of 90 minutes studying daily, while the students from school B spent an average of 75 minutes daily.
They want to find out if the difference in the mean times spent studying by the students of the two schools is statistically significant.
Which of the following sets shows the correct null hypothesis and alternative hypothesis?
•
Null Hypothesis: There is no difference in the mean times spent by the schools' students. Alternative Hypothesis: There is at least some difference in the mean times spent by the schools' students.
•
Null Hypothesis: There is at least some difference in the mean times spent by the schools' students. Alternative Hypothesis: The students from school B spend more time studying than the students from school A.
•
Null Hypothesis: The difference in the mean times spent by the schools' students is 15 minutes. Alternative Hypothesis: There is no difference in the mean times spent by the schools' students.
•
Null Hypothesis: School B students spend more time studying than School A.
Alternative Hypothesis: The difference in the mean times spent by the schools' students is 15 minutes.
RATIONALE
Recall that the null hypothesis is always of no difference.
So the null hypothesis (Ho) is that the mean time studying for group A = mean for group B. This would indicate no difference between the two groups.
The alternative hypothesis (Ha) is that there is difference in the mean study time between the two groups.
CONCEPT
Hypothesis Testing
5
Carl recorded the number of customers who visited his new store during the week:
He expected to have 15 customers each day. To answer whether the number of customers follows a uniform distribution, a chi-square test for goodness of fit should be performed. (alpha = 0.10)
What is the chi-squared test statistic? Answers are rounded to the nearest hundredth.
•
0.40
•
1.60
•
0.67
•
2.33
RATIONALE
Using the chi-square formula we can note the test statistic is
CONCEPT
Chi-Square Test for Goodness-of-Fit
6
Rachel measured the lengths of a random sample of 100 screws. The mean length was 2.9 inches, and the population standard deviation is 0.1 inch.
To see if the batch of screws has a significantly different mean length from 3 inches, what would the value of the z-test statistic be?
•
1
•
10
•
-10
•
-1
RATIONALE
If we first note the denominator of
Then, getting the z-score we can note it is
This tells us that 2.9 is 10 standard deviations below the value of 3, which is extremely far away.
CONCEPT
Z-Test for Population Means
7
What do the symbols , , and represent?
•
Sample statistics
•
Variables of interest
•
Population parameters
•
Defined variables
RATIONALE
Recall that is the sample proportion, is the sample mean, and is the sample standard
deviation. Since all of these come from samples they are statistics.
CONCEPT
Sample Statistics and Population Parameters
8
The data below shows the grams of fat in a series of popular snacks.
If Morris wanted to construct a one-sample t-statistic, what would the value for the degrees of freedom be?
•
10
•
9
•
11
•
5
RATIONALE
The degrees of freedom for a 1 sample t-test are df=n-1 where n is the sample size. In this case, n=10, then df = n-1 = 10-1 = 9.
CONCEPT
T-Tests
9
A researcher has a table of data with 5 column variables and 5 row variables.
The value for the degrees of freedom in order to calculate the statistic is .
•
25
•
24
•
4
•
16
RATIONALE
Recall to get the degrees of freedom we use df = (r-1)(c-1) where c and r are the number of rows and columns. This means df = (5-1)(5-1) = 4*4 =16.
CONCEPT
Pick Your Inference Test
Chi-Square Test for Homogeneity
Chi-Square Test for Association and Independence
10
Edwin conducted a survey to find the percentage of people in an area who smoked regularly. He defined the label “smoking regularly” for males smoking 30 or more cigarettes in a day and for females smoking 20 or more. Out of 635 people who took part in the survey, 71 are labeled as people who smoke regularly.
Edwin wishes to construct a significance test for his data. He finds that the proportion of chain smokers nationally is 14.1%.
What is the z-statistic for this data? Answer choices are rounded to the hundredths place.
•
-0.03
•
-2.34
•
-0.24
•
-2.11
RATIONALE
To make things a little easier, let's first note the denominator We can now note that
Finally, subbing all in we find
*note that if you round, the values can be slightly different.
CONCEPT
Z-Test for Population Proportions
11
Select the false statement about ANOVA.
•
If a researcher wants to compare the mean wages of females in different age groups at a particular company, he or she should not use an ANOVA because the population means are unknown.
•
If a researcher wants to study the effectiveness of three brands of nicotine patches, the researcher should use a One-Way ANOVA test.
•
A one-way ANOVA hypothesis test considers comparisons between populations based on
one characteristic, while a two-way ANOVA hypothesis test considers comparisons between populations based on multiple characteristics.
•
If a researcher wants to compare the mean wages of females in different age groups at a particular company to the mean wages of males in different age groups at the same company, the researcher should use a Two-Way ANOVA test.
RATIONALE
If performing a statistical test, we don't need to know the population values. This is true for one-way ANOVA. We use the sample evidence to determine if the means between groups in population are equal.
CONCEPT
One-Way ANOVA/Two-Way ANOVA
12
Rachel measures the lengths of a random sample of 100 screws. The mean length was 2.6 inches, with a standard deviation of 1.0 inches.
Using the alternative hypothesis (µ < µ0), Rachel found that a z-test statistic was equal to -1.25.
What is the p-value of the test statistic? Answer choices are rounded to the thousandths place.
•
0.211
•
0.317
•
0.106
•
0.159
RATIONALE
If we go to the chart and the row for the z-column for -1.2 and then the column 0.05, this value corresponds to 0.1056 or 0.106.
CONCEPT
How to Find a P-Value from a Z-Test Statistic
13
The data below shows the heights in inches of 10 students in a class.
The standard error of the sample mean for this set of data is . Answer choices are rounded to the hundredths place.
•
1.77
•
0.59
•
0.19
•
1.87
RATIONALE
In order to get the standard error of the mean, we can use the following formula: , where is the standard deviation and is the sample size.
Either calculate by hand or use Excel to find the standard deviation, which is 1.87. The sample size is 10 students.
The standard error is then:
CONCEPT
Calculating Standard Error of a Sample Mean
14
For a left-tailed test, the critical value of z so that a hypothesis test would reject the null hypothesis at 10% significance level would be . Answer choices are rounded to the hundredths place.
•
-1.03
•
-2.33
•
-1.65
•
-1.28
RATIONALE
Recall that when a test statistic is smaller than in a left tailed
test we would reject Ho. If we go to the standard normal chart and use 10% or 0.10, we will search for the closest value to 10% as closely as possible.
0.1003 corresponds with a z-score of -1.28.
CONCEPT
How to Find a Critical Z Value
15
One condition for performing a hypothesis test is that the observations are independent. Mary is going to take a sample from a population of 500 students.
How many students will Mary have to sample without replacement to treat the observations as independent?
•
300
•
50
•
490
•
100
RATIONALE
In general we want about 10% or less to still assume independence. So size = 0.1*N = 0.1(500) = 50
A sample of 50 or less would be sufficient.
CONCEPT
Sampling With or Without Replacement
16
A market research company conducted a survey to find the level of affluence in a city. They defined the category "affluence" for males earning $100,000 or more annually and for females earning $80,000 or more annually. Out of 267 persons who replied to their survey, 32 are listed under this category.
What is the standard error of the sample proportion? Answer choices are rounded to the hundredths place.
•
1.96
•
0.20
•
0.02
•
0.32
RATIONALE
We can note the SE of the proportion is .
If we note that , which means .
So if we take all this information we can note SE = .
CONCEPT
Calculating Standard Error of a Sample Proportion
17
Joe hypothesizes that the average age of the population of Florida is less than 37 years. He records a sample mean equal to 37 and states the hypothesis as μ = 37 vs μ < 37.
What type of test should Joe do?
•
Left-tailed test
•
Joe should not do any of the types of tests listed
•
Two-tailed test
•
Right-tailed test
RATIONALE
Since the Ha is a less than sign, this indicates he wants to run a 1 tailed test where the rejection region is the lower or left tail.
This can be called a left-tailed test.
CONCEPT
One-Tailed and Two-Tailed Tests
18
Adam tabulated the values for the average speeds on each day of his road trip as 60.5, 63.2, 54.7, 51.6, 72.3, 70.7, 67.2, and 65.4 mph. He wishes to construct a 98% confidence interval.
What value of t* should Adam use to construct the confidence interval? Answer choices are rounded to the thousandths place.
•
2.998
•
2.896
•
4.489
•
2.517
RATIONALE
Recall that we have n = 8, so the df = n-1 = 7. So if we go to the
row where df = 7 and then 0.01 for the tail probability, this gives us a value of 2.998. Recall that a 98% confidence interval would have 2% for the tails, so 1% for each tail.
We can also use the last row and find the corresponding confidence level.
CONCEPT
How to Find a Critical T Value
19
Which of the following is an example of a parameter?
•
Over 10,000 out of 15,000 citizens in a precinct participate in a special election.
•
Thirty randomly selected teens are asked about their average weekly hours spent on the Internet.
•
Fifty students in first grade have their heights taken to estimate average length.
•
All 450 students attending a school are asked to rank the quality of cafeteria food.
RATIONALE
Recall a parameter comes from the entire set of interest, the population. Since they are looking at all students here, the ranking would be an example of a parameter.
CONCEPT
Sample Statistics and Population Parameters
20
Maximus is playing a game. When he rolls the dice he wins if he gets an even number and loses if he gets an odd number.
Which of the following statements is FALSE?
•
The count of rolling an odd number from a sample proportion size of 100 can be approximated with a normal distribution
•
The count of rolling an even number can be approximated with a normal distribution
•
Rolling an even number is considered a success
•
The count of rolling an odd number can be approximated with a normal distribution
RATIONALE
If we look at the counts from a large population of success and failures (2 outcomes), this is called a binomial distribution. Since we are examining odds and evens, which are discrete non-numeric values, the normal distribution cannot be used here.
CONCEPT
Distribution of Sample Proportions
21
A manufacturing company has two plants at different locations producing three different items. Based on the number of workers and the demand for the items in their respective locations, the number of items manufactured per day by each plant is listed in the table.
Select the observed and expected frequencies for Item 2 produced by Plant B.
•
Observed: 9.2
Expected: 10.8
•
Observed: 9.2
Expected: 17.3
•
Observed: 12
Expected: 17.3
•
Observed: 12
Expected: 10.8
RATIONALE
If we simply go to the chart then we can directly see the observed number of Item 2 from Plant B is 12.
To find the expected frequency, we need to find the number of
occurrences if the null hypothesis is true, which in this case, was that the three options are equally likely, or if the three options were all evenly distributed.
First, add up all the items in the Plant B column:
If each of these three options were evenly distributed among the 52 items produced by Plant B, we would need to divide the total evenly between the three options:
This means we would expect 17.3 items from Plant B for each item 1, 2, and 3.
CONCEPT
Chi-Square Statistic
22
Ryan, a baker, measured the weights of cakes baked in each batch at his bakery and found that the mean weight of each cake is 500 grams. He performed a hypothesis test to find the mean weight of each cake by setting and .
Select the statement that indicates a Type I error.
•
Rejecting the mean weight of each cake as 500 grams when .
•
Failing to reject the mean weight of each cake as 500 grams when .
•
Rejecting the mean weight of each cake as 500 grams when .
•
Failing to reject the mean weight of each cake as 500 grams when .
RATIONALE
Recall a Type I error is when we incorrectly reject a true null
hypothesis. So if we reject the mean weight of 500 grams from , when in fact it is greater, this
would be an example of Type I error.
CONCEPT
Type I/II Errors
23
What value of z* should be used to construct an 88% confidence interval of a population mean? Answer choices are rounded to the thousandths place.
•
1.175
•
1.645
•
1.220
•
1.555
RATIONALE
Using the z-chart to construct an 88% CI, this means that there is 6% for each tail. The lower tail would be at 0.06 and the upper tail would be at (1 - 0.06) or 0.94. The closest to 0.94 on the z-table is between 0.9394 and 0.9406.
0.9394 corresponds with a z-score of 1.55. 0.9406 corresponds with a z-score of 1.56.
Taking the average of these two scores, we get a z-score of 1.555.
CONCEPT
Confidence Intervals
24
Adam tabulated the values for the average speeds on each day of his road trip as 60.5, 63.2, 54.7, 51.6, 72.3, 70.7, 67.2, and 65.4 mph. The sample standard deviation is 7.309.
Adam reads that the average speed that cars drive on the highway is 65 mph.
The t-test statistic for a two-sided test would be . Answer choices are rounded to the hundredths place.
•
-2.87
•
-0.70
•
-1.39
•
-1.44
RATIONALE
Using the information given, we need to find the sample mean:
We now know the following information:
Let's plug in the values into the formula:
CONCEPT
T-Tests
[Show More]


.png)
 2e Peter Olver, Chehrzad Shakiban.png)




, 3e by Steven Krantz.png)



.png)
.png)