Mathematics > EXAM > MATH 221 Week 6 iLab DEVRY,(2019) Statistics for Decision Making. Already Graded A+ (All)
MATH 221 Week 6 iLab DEVRY,(2019) Statistics for Decision Making. Already Graded A+
Document Content and Description Below
Last updated: 3 years ago
Preview 1 out of 4 pages
Instant download

Buy this Document to get the Full Access Instantly
Provided by Students Who Aced it
We Verify Document Content to Gurantee Accuracy
Reviews( 0 )
Document information
Connected school, study & course
About the document
Uploaded On
Sep 25, 2019
Number of pages
4
Written in
All

Additional information
This document has been written for:
Uploaded
Sep 25, 2019
Downloads
0
Views
259
Document Keyword Tags
Recommended For You
Get more on EXAM »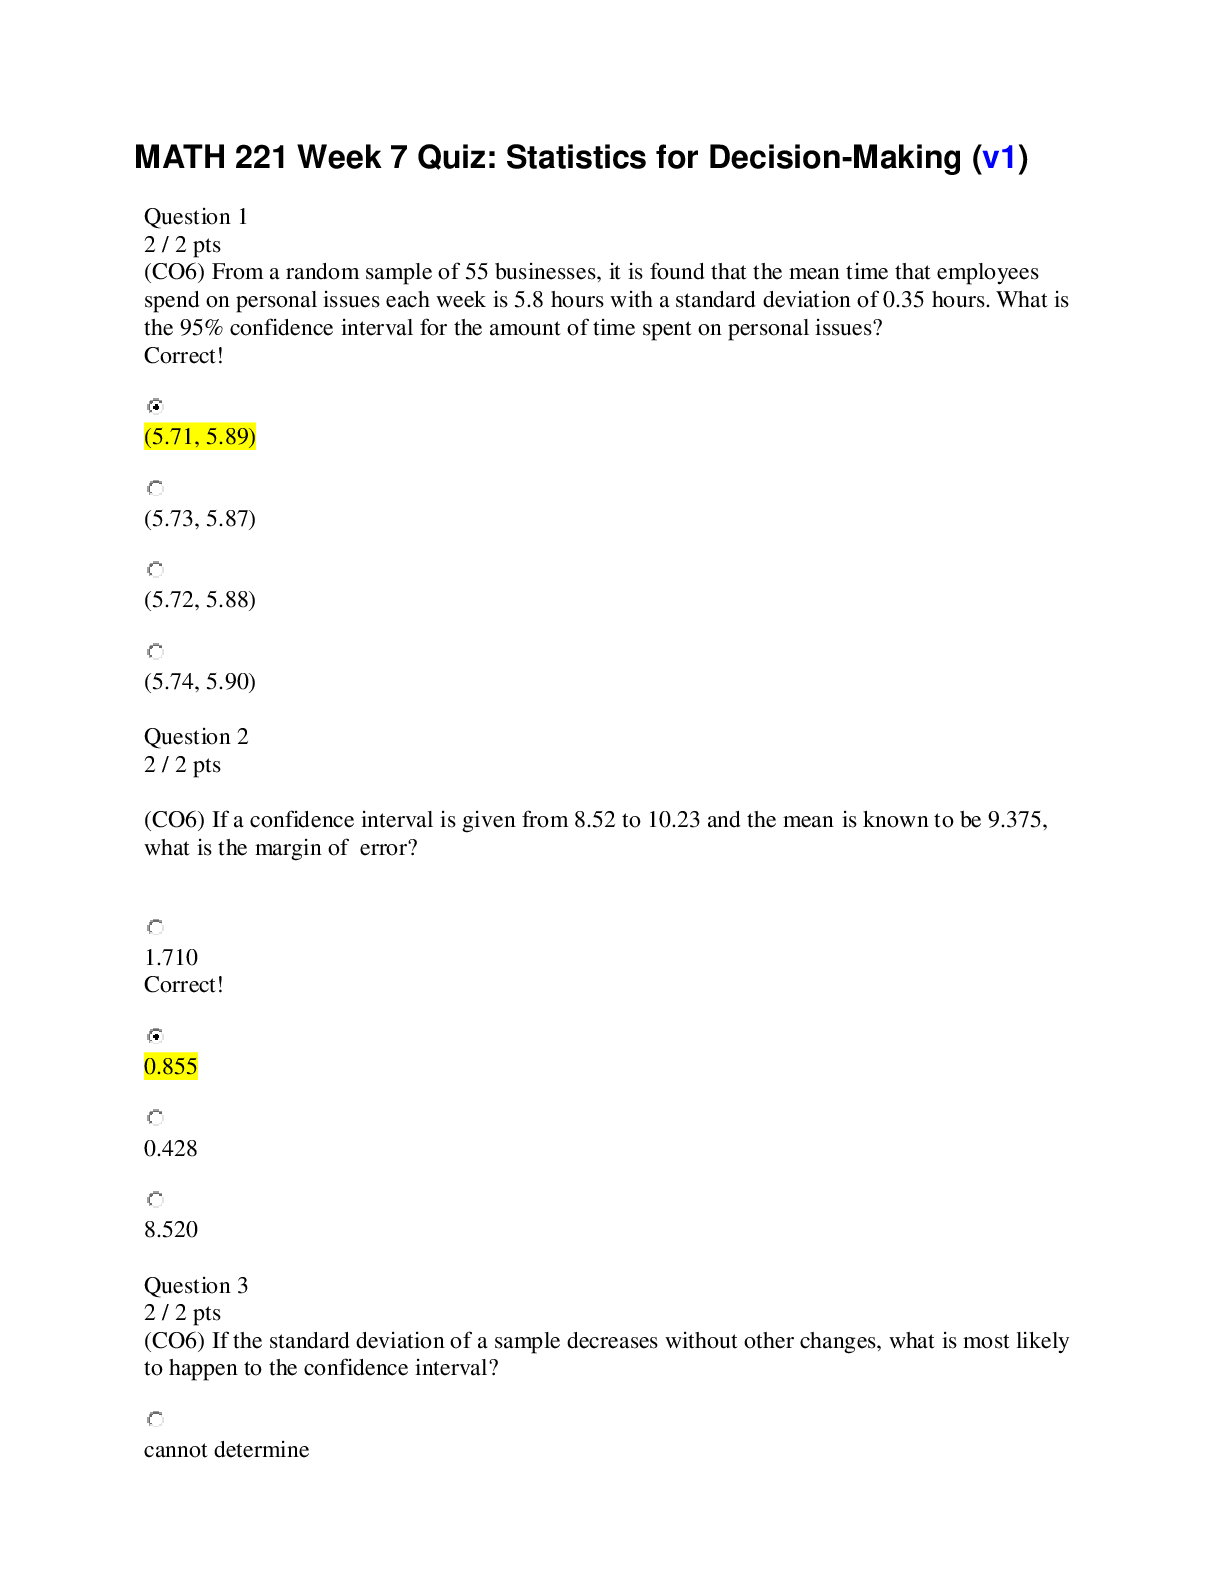
MATH 221 Week 7 Quiz: Statistics for Decision-Making (v1) |TOP...
MATH 221 Quiz Week 7 | DeVry University | Complete Q&A Fall 20...
MATH 221 WEEK 8 FINAL EXAM ANSWERS updated Spring 2025/2026.
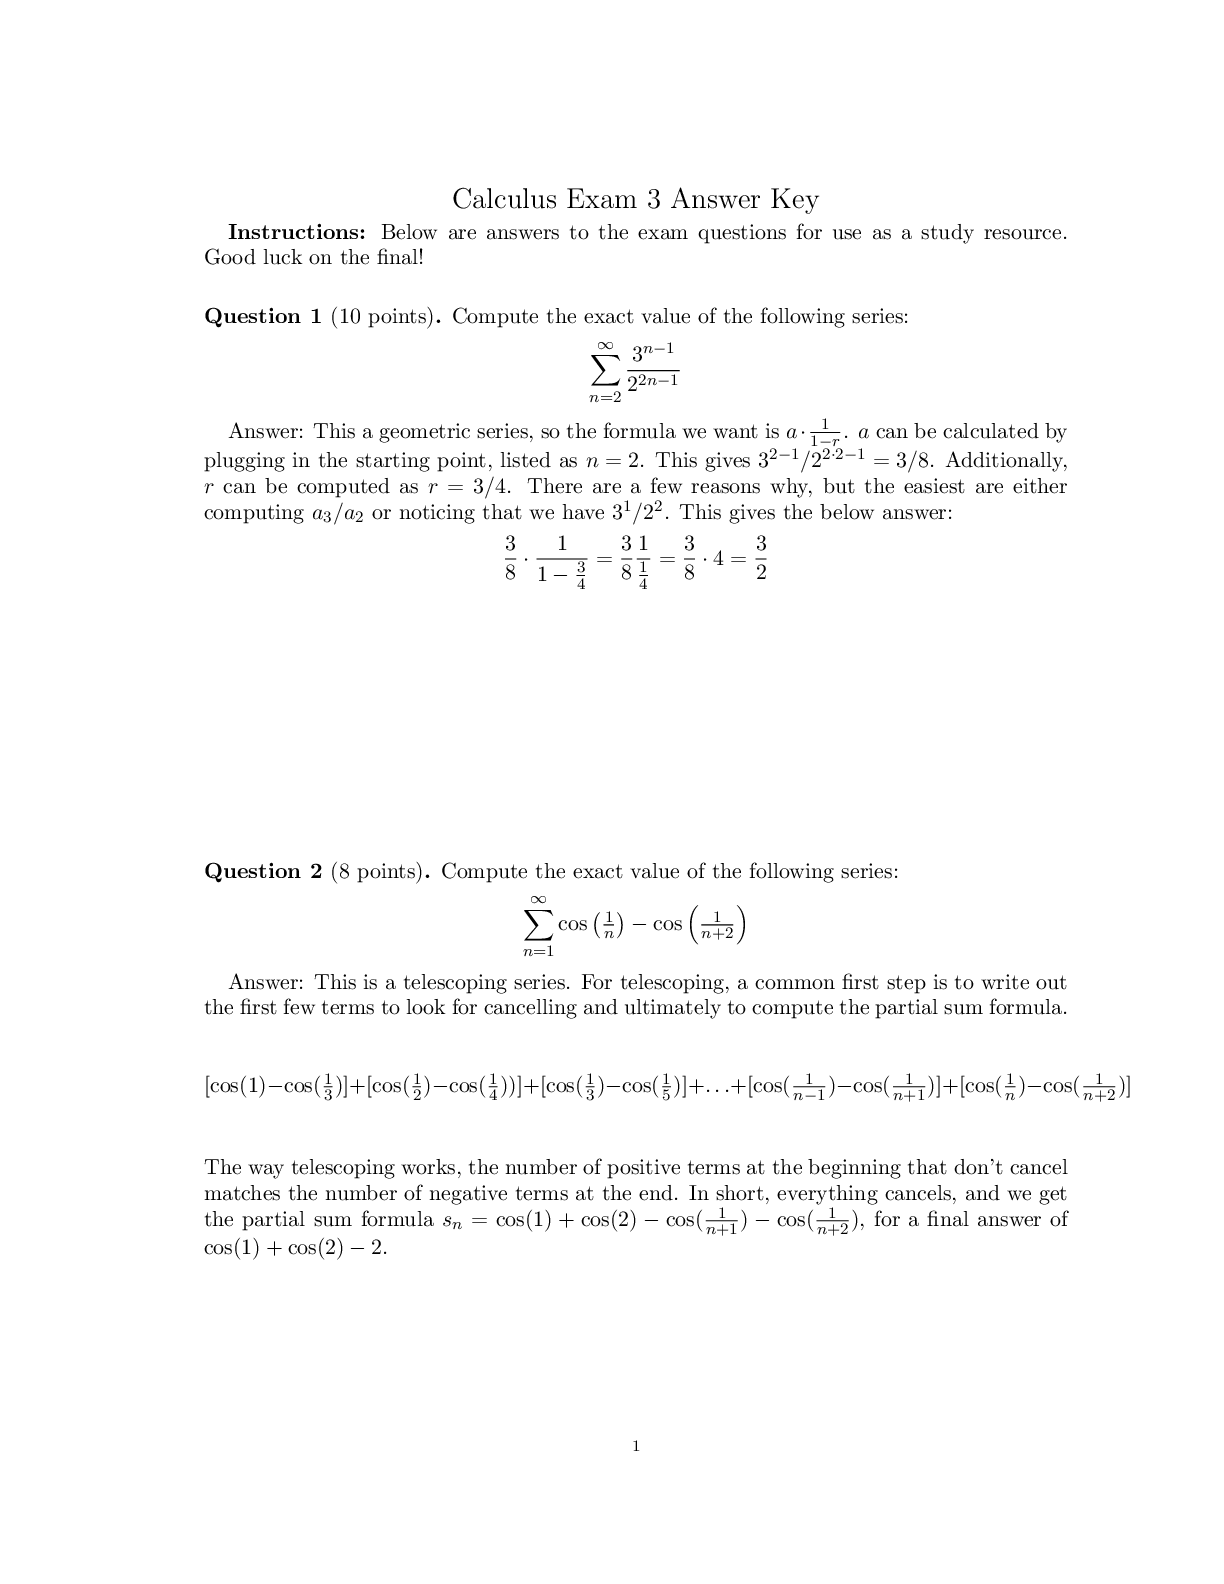
MATH 2212 Exam 3 Answer Key | Questions and Answers (Complete...
MATH 2212 Exam 2 Answer Key | Questions and Answers (Complete...
MATH-221 Week 6 Homework: Statistics for Decision-Making (v2)...
MATH 221 Week 6 Homework: Statistics for Decision-Making (LATE...

MATH 221 Homework Week 6 Attempt Score 40/40 | DeVry Universi...


![Preview of eBook [PDF] Mathematics in Action An Introduction to Algebraic Graphical and Numerical Pro](https://browseimages.nyc3.digitaloceanspaces.com/paper-thumbnails/2026/07/04/paper-648128-thumb-oia6byFhyaj7hCk4-6a4909738c7b3.jpg)