Statistics > EXAM > Strayer University - MAT 300 Final Milestone Exam. Questions And Answers. (All)
Strayer University - MAT 300 Final Milestone Exam. Questions And Answers.
Document Content and Description Below
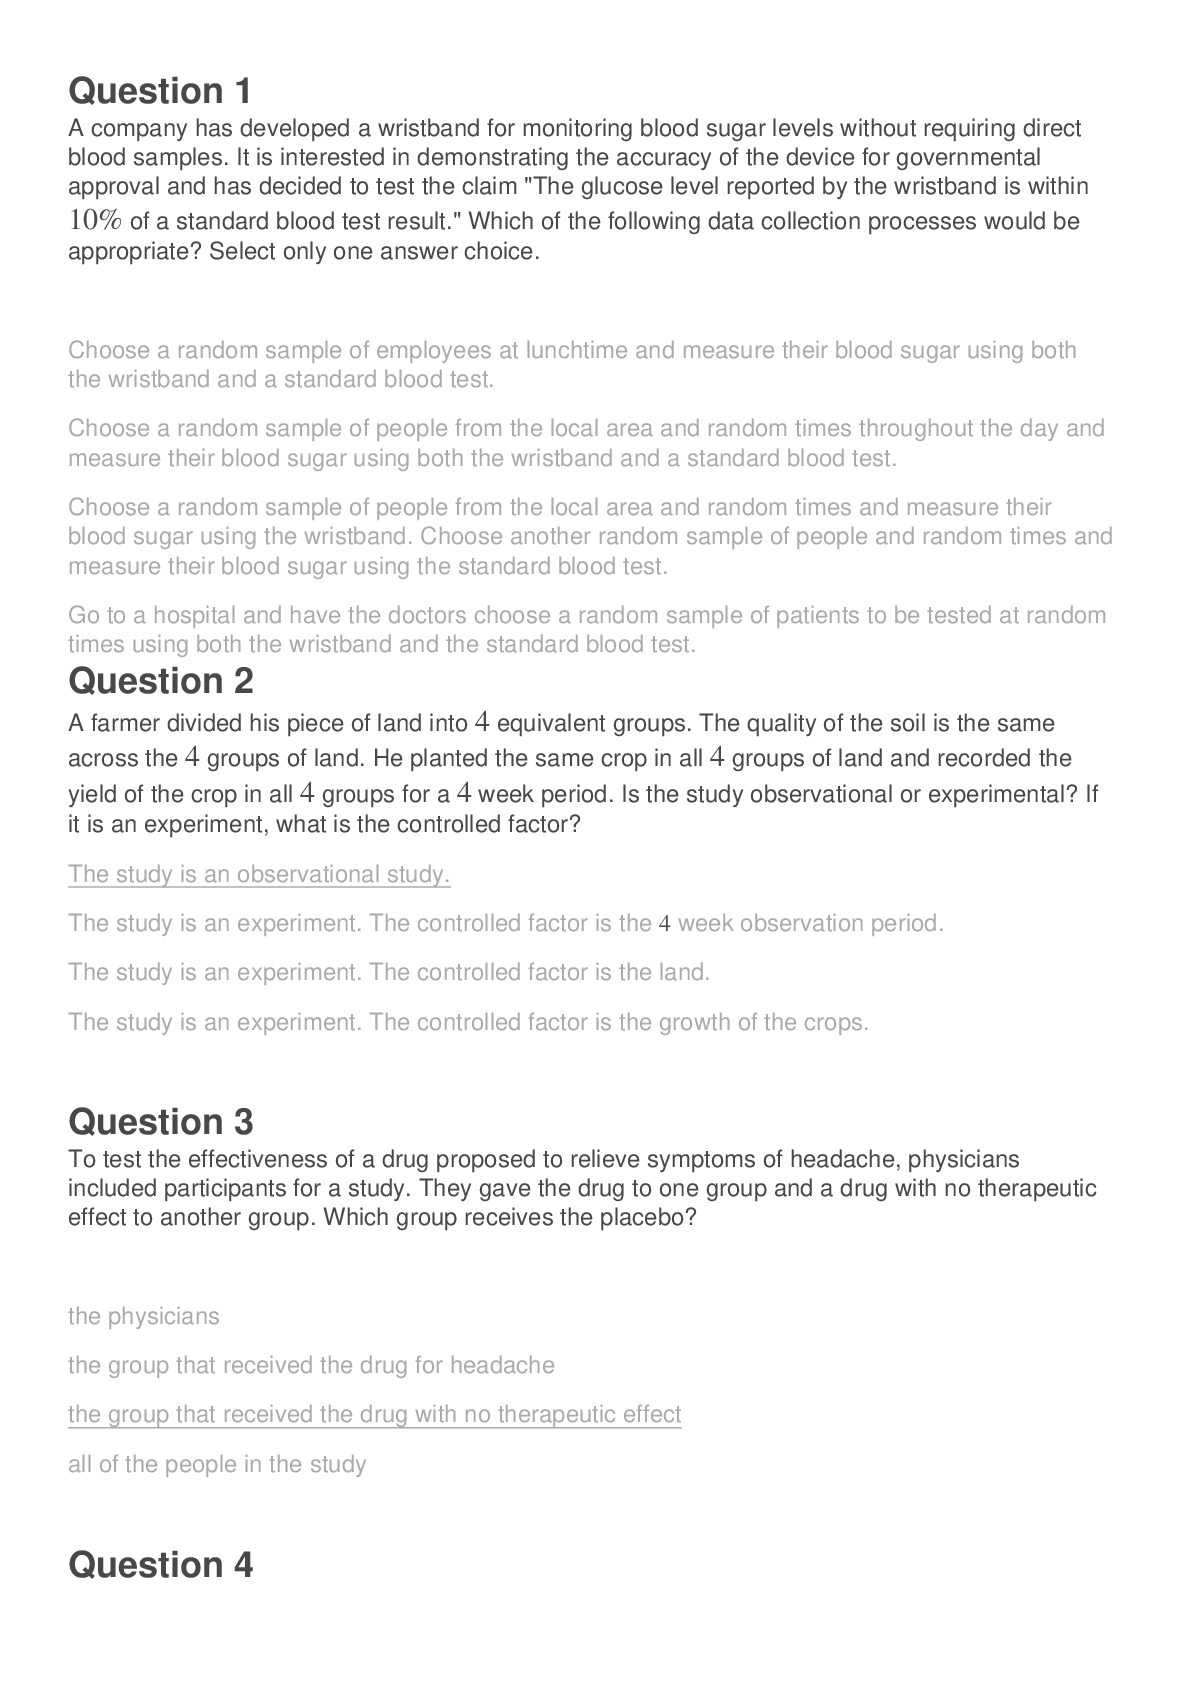
Strayer University - MAT 300 Final Milestone Exam. Questions And Answers.Which of the following sets of statements is true? 98.5% of the variation in age is explained by a nonlinear relationship with... yearly income. The correlation coefficient, r, is 0.969. 9/18/2020 Sophia :: Welcome https://strayer.sophia.org/spcc/introduction-to-statistics-2/milestone_take_feedbacks/6220477 3/14 98.5% of the variation in age is explained by a linear relationship with yearly income. The correlation coefficient, r, is 0.969. 98.5% of the variation in yearly income is explained by a linear relationship with age. The correlation coefficient, r, is 0.992 98.5% of the variation in yearly income is explained by a nonlinear relationship with age. The correlation coefficient, r, is 0.992. RATIONALE The coefficient of determination measures the percent of variation in the outcome, y, explained by the regression. So a value of 0.9846 tells us the regression with age, x, can explain about 98.5% of the variation in income, y. We can also note that r = . CONCEPT Coefficient of Determination/r^2 2 The first quartile (Q1) value from the above box plot is __________. 40 33 29 52 RATIONALE Note the value for Q1 is the left edge of the box, which is 33. CONCEPT Five Number Summary and Boxplots 3 The manager of a mall conducted a survey among two groups (n1 = 100, n2 = 100) of visitors to the mall on different days. She found that the first group spent an average of 60 minutes in the mall, while the second group spent an average of 90 minutes in the mall. If the manager wishes to see the difference in the average times spent by the two groups in the mall, which of the following sets shows the null hypothesis and alternative hypothesis? Null Hypothesis: There is at least some difference in the average times spent by the two groups in the mall. Alternative Hypothesis: The difference in the average times spent by the two groups in the mall is 30 minutes. 9/18/2020 Sophia :: Welcome https://strayer.sophia.org/spcc/introduction-to-statistics-2/milestone_take_feedbacks/6220477 4/14 Null Hypothesis: There is at least some difference in the average times spent by the two groups in the mall. Alternative Hypothesis: There is no difference in the average times spent by the two groups in the mall. Null Hypothesis: There is no difference in the average times spent by the two groups in the mall. Alternative Hypothesis: There is at least some difference in the average times spent by the two groups in the mall. Null Hypothesis: There is no difference in the average times spent by the two groups in the mall. Alternative Hypothesis: There is a difference in the average times spent by the two groups in the mall, with a standard deviation of 30 minutes. RATIONALE Recall that the null hypothesis is always of no difference. So the null hypothesis (Ho) is that the mean time spent at the mall for the first group = mean time for the second group. This would indicate no difference between the two groups. The alternative hypothesis (Ha) is that there is difference in the mean time spent at the mall between the two groups. CONCEPT Hypothesis Testing 4 An art teacher is trying to determine which class to offer next summer. She passes out a slip of paper to some of the students in the class asking them whether or not they liked her course, and what class they would most like to see offered in the summer. Which type of statistical study is the art teacher conducting? A survey A census A double-blind study A single-blind study RATIONALE Since she asks people what their preferences would be, this is an example of a survey. CONCEPT Surveys 5 Edwin conducted a survey to find the percentage of people in an area who smoked regularly. He defined the label “smoking regularly” for males smoking 30 or more cigarettes in a day and for females smoking 20 or more. Out of 635 persons who took part in the survey, 71 are labeled as people who smoke regularly. What is the 90% confidence interval for this population proportion? Answer choices are rounded to the hundredths place. 0.09 to 0.80 0.09 to 0.13 0.11 to 0.80 0.11 to 0.13 [Show More]
Last updated: 2 years ago
Preview 1 out of 14 pages

Buy this document to get the full access instantly
Instant Download Access after purchase
Buy NowInstant download
We Accept:

Reviews( 0 )
$15.00
Can't find what you want? Try our AI powered Search
Document information
Connected school, study & course
About the document
Uploaded On
Jun 17, 2021
Number of pages
14
Written in
Additional information
This document has been written for:
Uploaded
Jun 17, 2021
Downloads
0
Views
133


.png)


.png)
.png)



.png)

