Psychology > QUESTIONS & ANSWERS > Liberty UniversityPSYC 515HW4_AngelinaColeman_515B03 (All)
Liberty UniversityPSYC 515HW4_AngelinaColeman_515B03
Document Content and Description Below
Last updated: 3 years ago
Preview 1 out of 5 pages
Instant download

Buy this Document to get the Full Access Instantly
Provided by Students Who Aced it
We Verify Document Content to Gurantee Accuracy
Reviews( 0 )
Document information
Connected school, study & course
About the document
Uploaded On
Jul 02, 2021
Number of pages
5
Written in
All

Additional information
This document has been written for:
Uploaded
Jul 02, 2021
Downloads
0
Views
108
Topic Tags
Recommended For You
Get more on QUESTIONS & ANSWERS »
eBook [PDF] Abnormal Psychology 6th Edition By Gordon L. Flett...
Educational Psychology 8th Edition by John W. Santrock | eBook...

eBook [PDF] Psychology of Success 8th Edition By Denis Waitley
Abnormal Psychology Clinical Perspectives on Psychological Dis...
TEST BANK FOR Abnormal Psychology 6th Edition by Canadian Flet
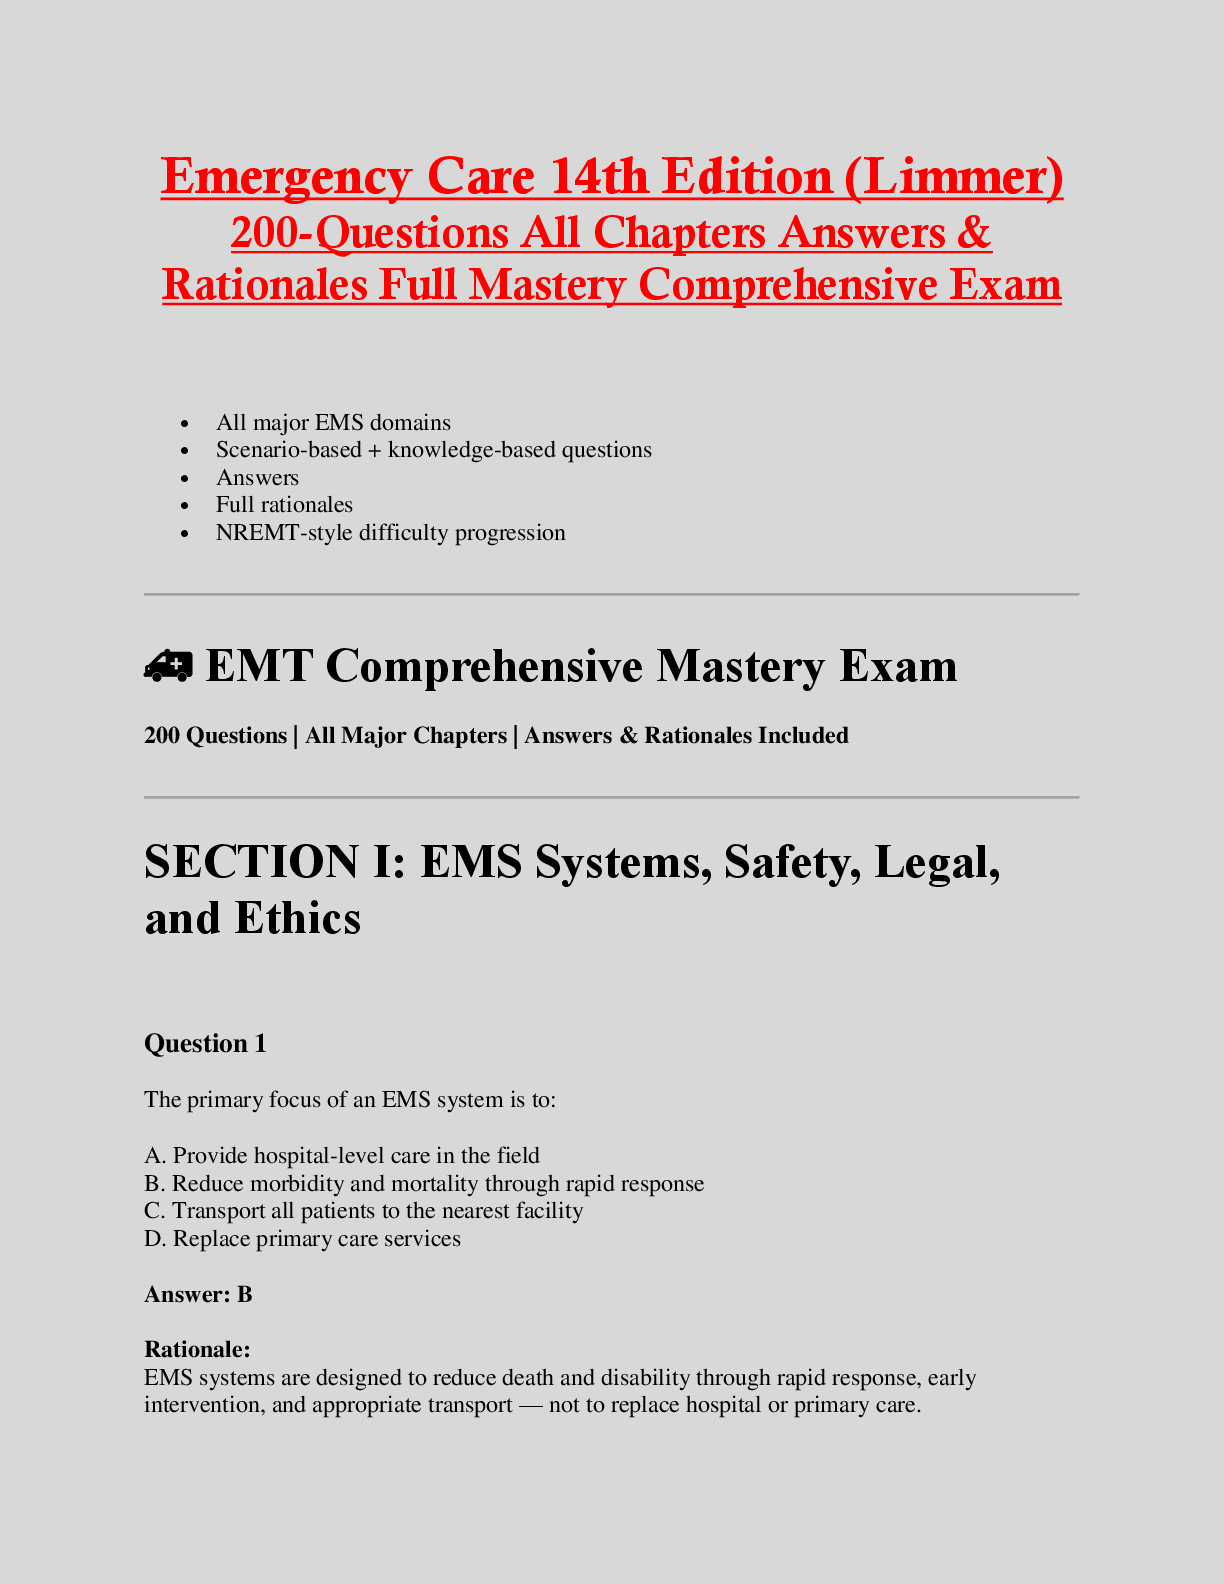
Emergency Care 14th Edition (Limmer) 200-Questions All Chapte...
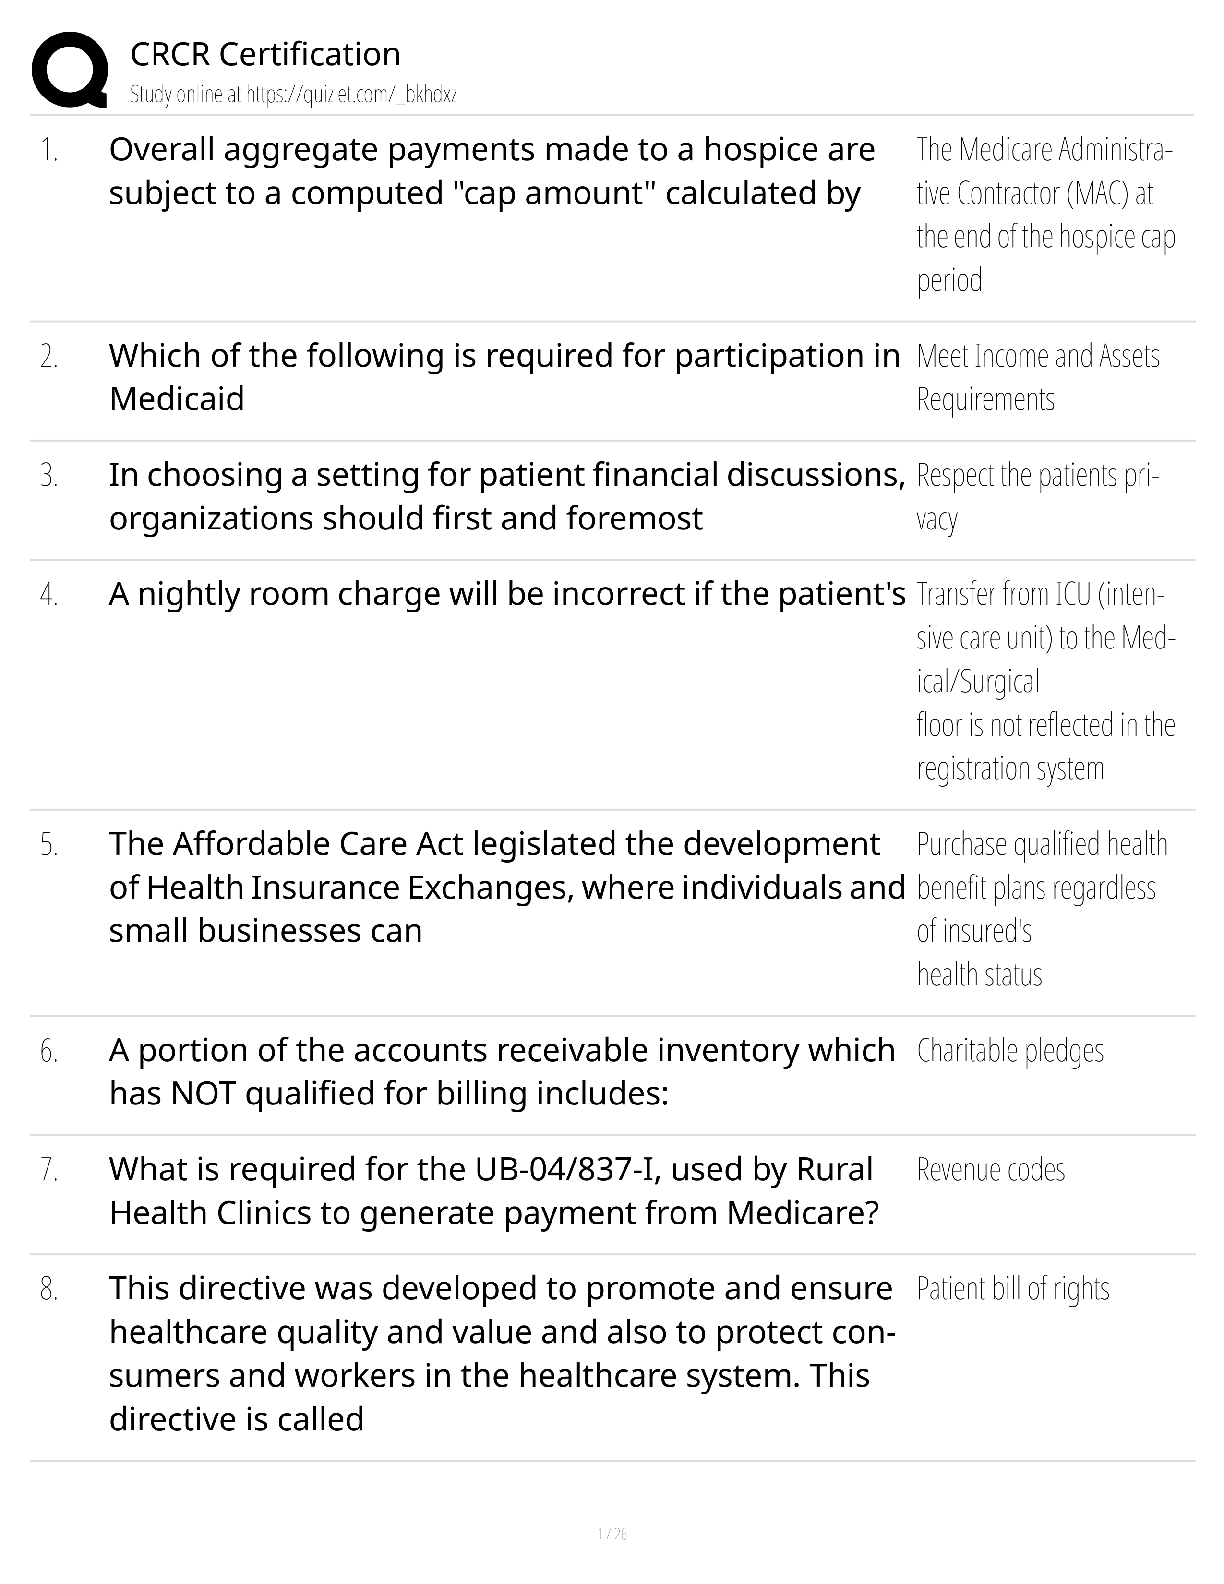
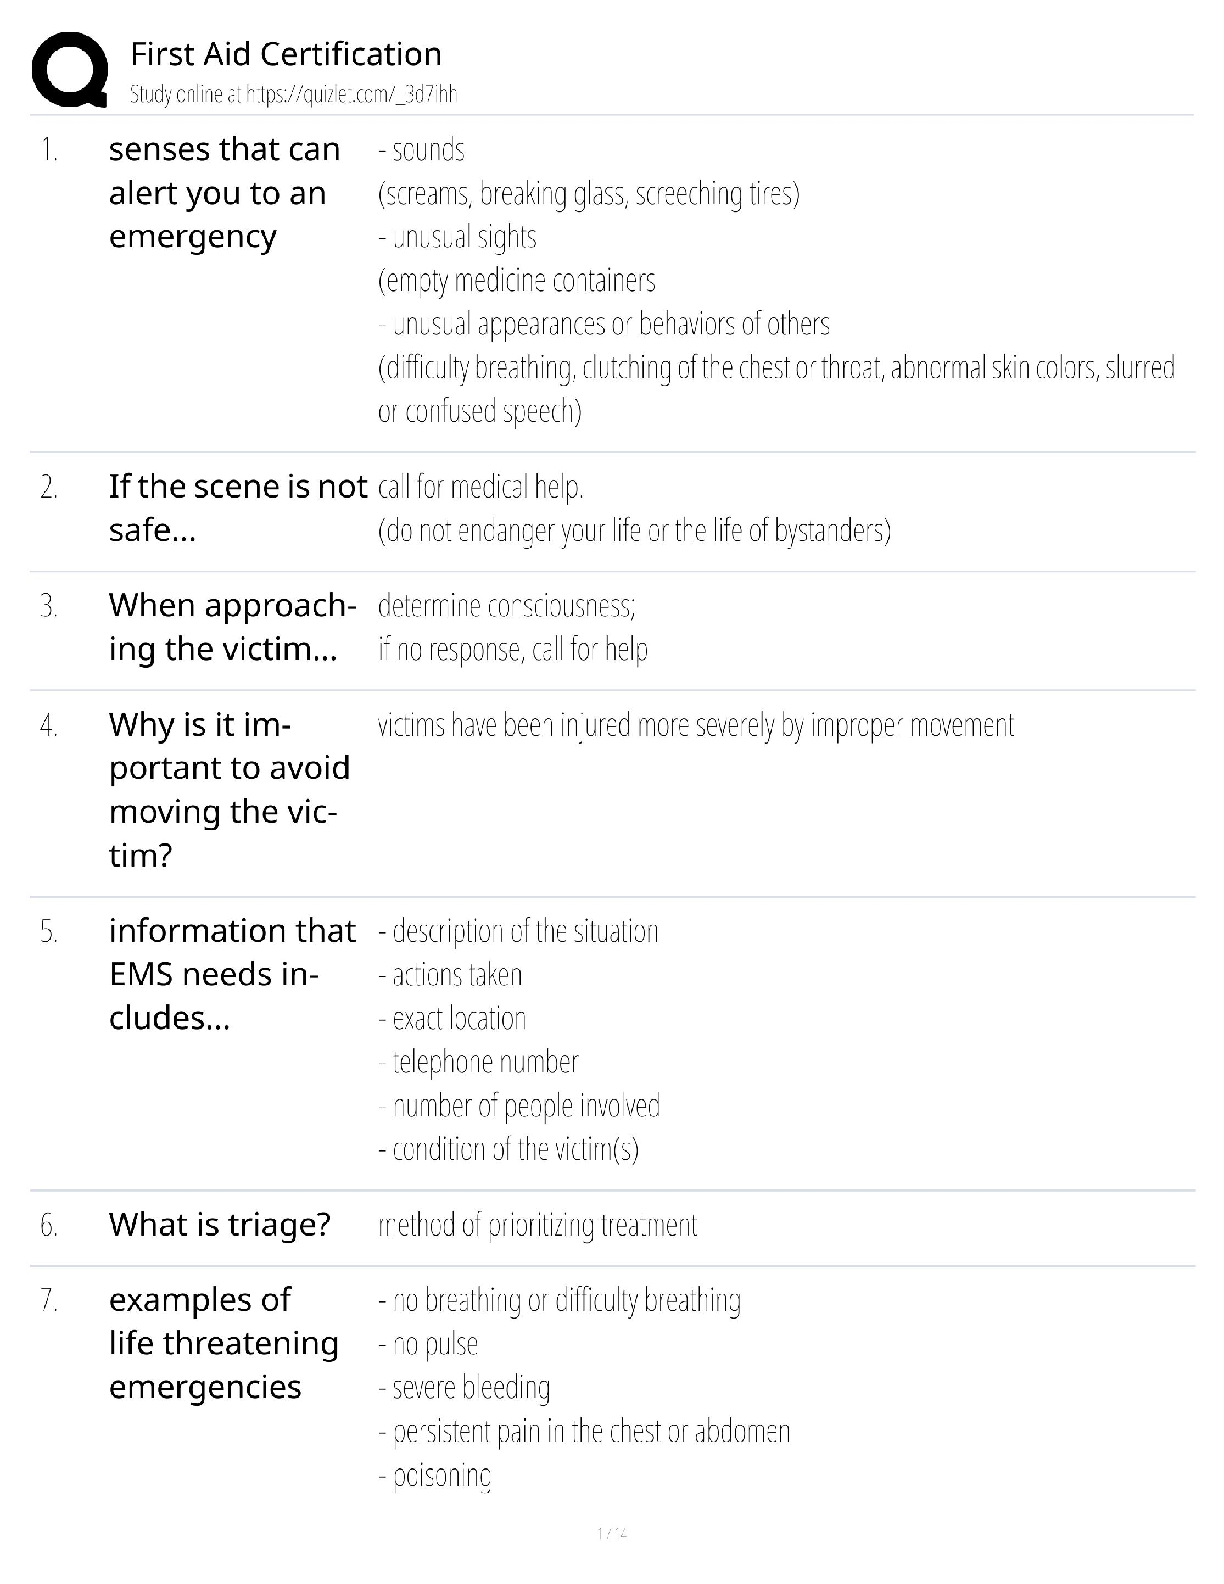
First Aid Certification CPR AED & BLS Study Guide & Practice E...

 Charles Herrick - 100 Q&A About Alcoholism & Drug Addiction-Jones and Bartlett Publishers, Inc.png)